
Software use on ARCHER2 - an initial look
By Andrew Turner (EPCC) on May 19, 2021
Tags:
Back in February, I reviewed the usage of different research software on ARCHER over a large period of its life. Now we have just come to the end of the first month of charged use on the ARCHER2 4-cabinet system I thought it would be interesting to have an initial look at how people are using the new system in terms of research software use and job sizes.
First some numbers on the ARCHER2 4-cabinet system: The system is an HPE Cray EX Supercomputer; this subset of the full ARCHER2 system has 1024 compute nodes, each of which has two AMD EPYC 7742 64-core processors, giving 128 compute cores per node. There are 256 GiB of RAM per node and two 100 Gbps network interfaces (one per socket) onto the HPE Cray Slingshot interconnect. This gives an overall core count of 131,072 compute cores, slightly more than the 118,080 compute cores available on the full ARCHER system but contained in many less nodes (1024 on ARCHER2 4-cab vs 4920 on ARCHER). As the minimum unit of request on ARCHER2 is a full compute node this means that 4-cabinet ARCHER2 system actually has far less capacity in terms of number of jobs compared to ARCHER. This will be rectified when the full ARCHER2 system is available as it will have 5848 compute nodes, giving 748,544 compute cores in total.
We used the data in the ARCHER2 Slurm database to analyse the usage of the system for the whole of April 2021. The executable names from jobs in Slurm were matched to research software using a library of regex patterns that we have built up over the lifetime of ARCHER and ARCHER2. The analysis tool and the regex patterns can be found at:
A summary of the method:
- We extract all Slurm subjobs that completed within the specified period
- We match the job name field (for Slurm subjobs this usually contains the executable name) against known research software applications using a regex library
- We use Pandas to analyse the data and summarise the use of research software on ARCHER2s
The distribution of use of ARCHER2 by research software for April 2021 is given in the plot below:
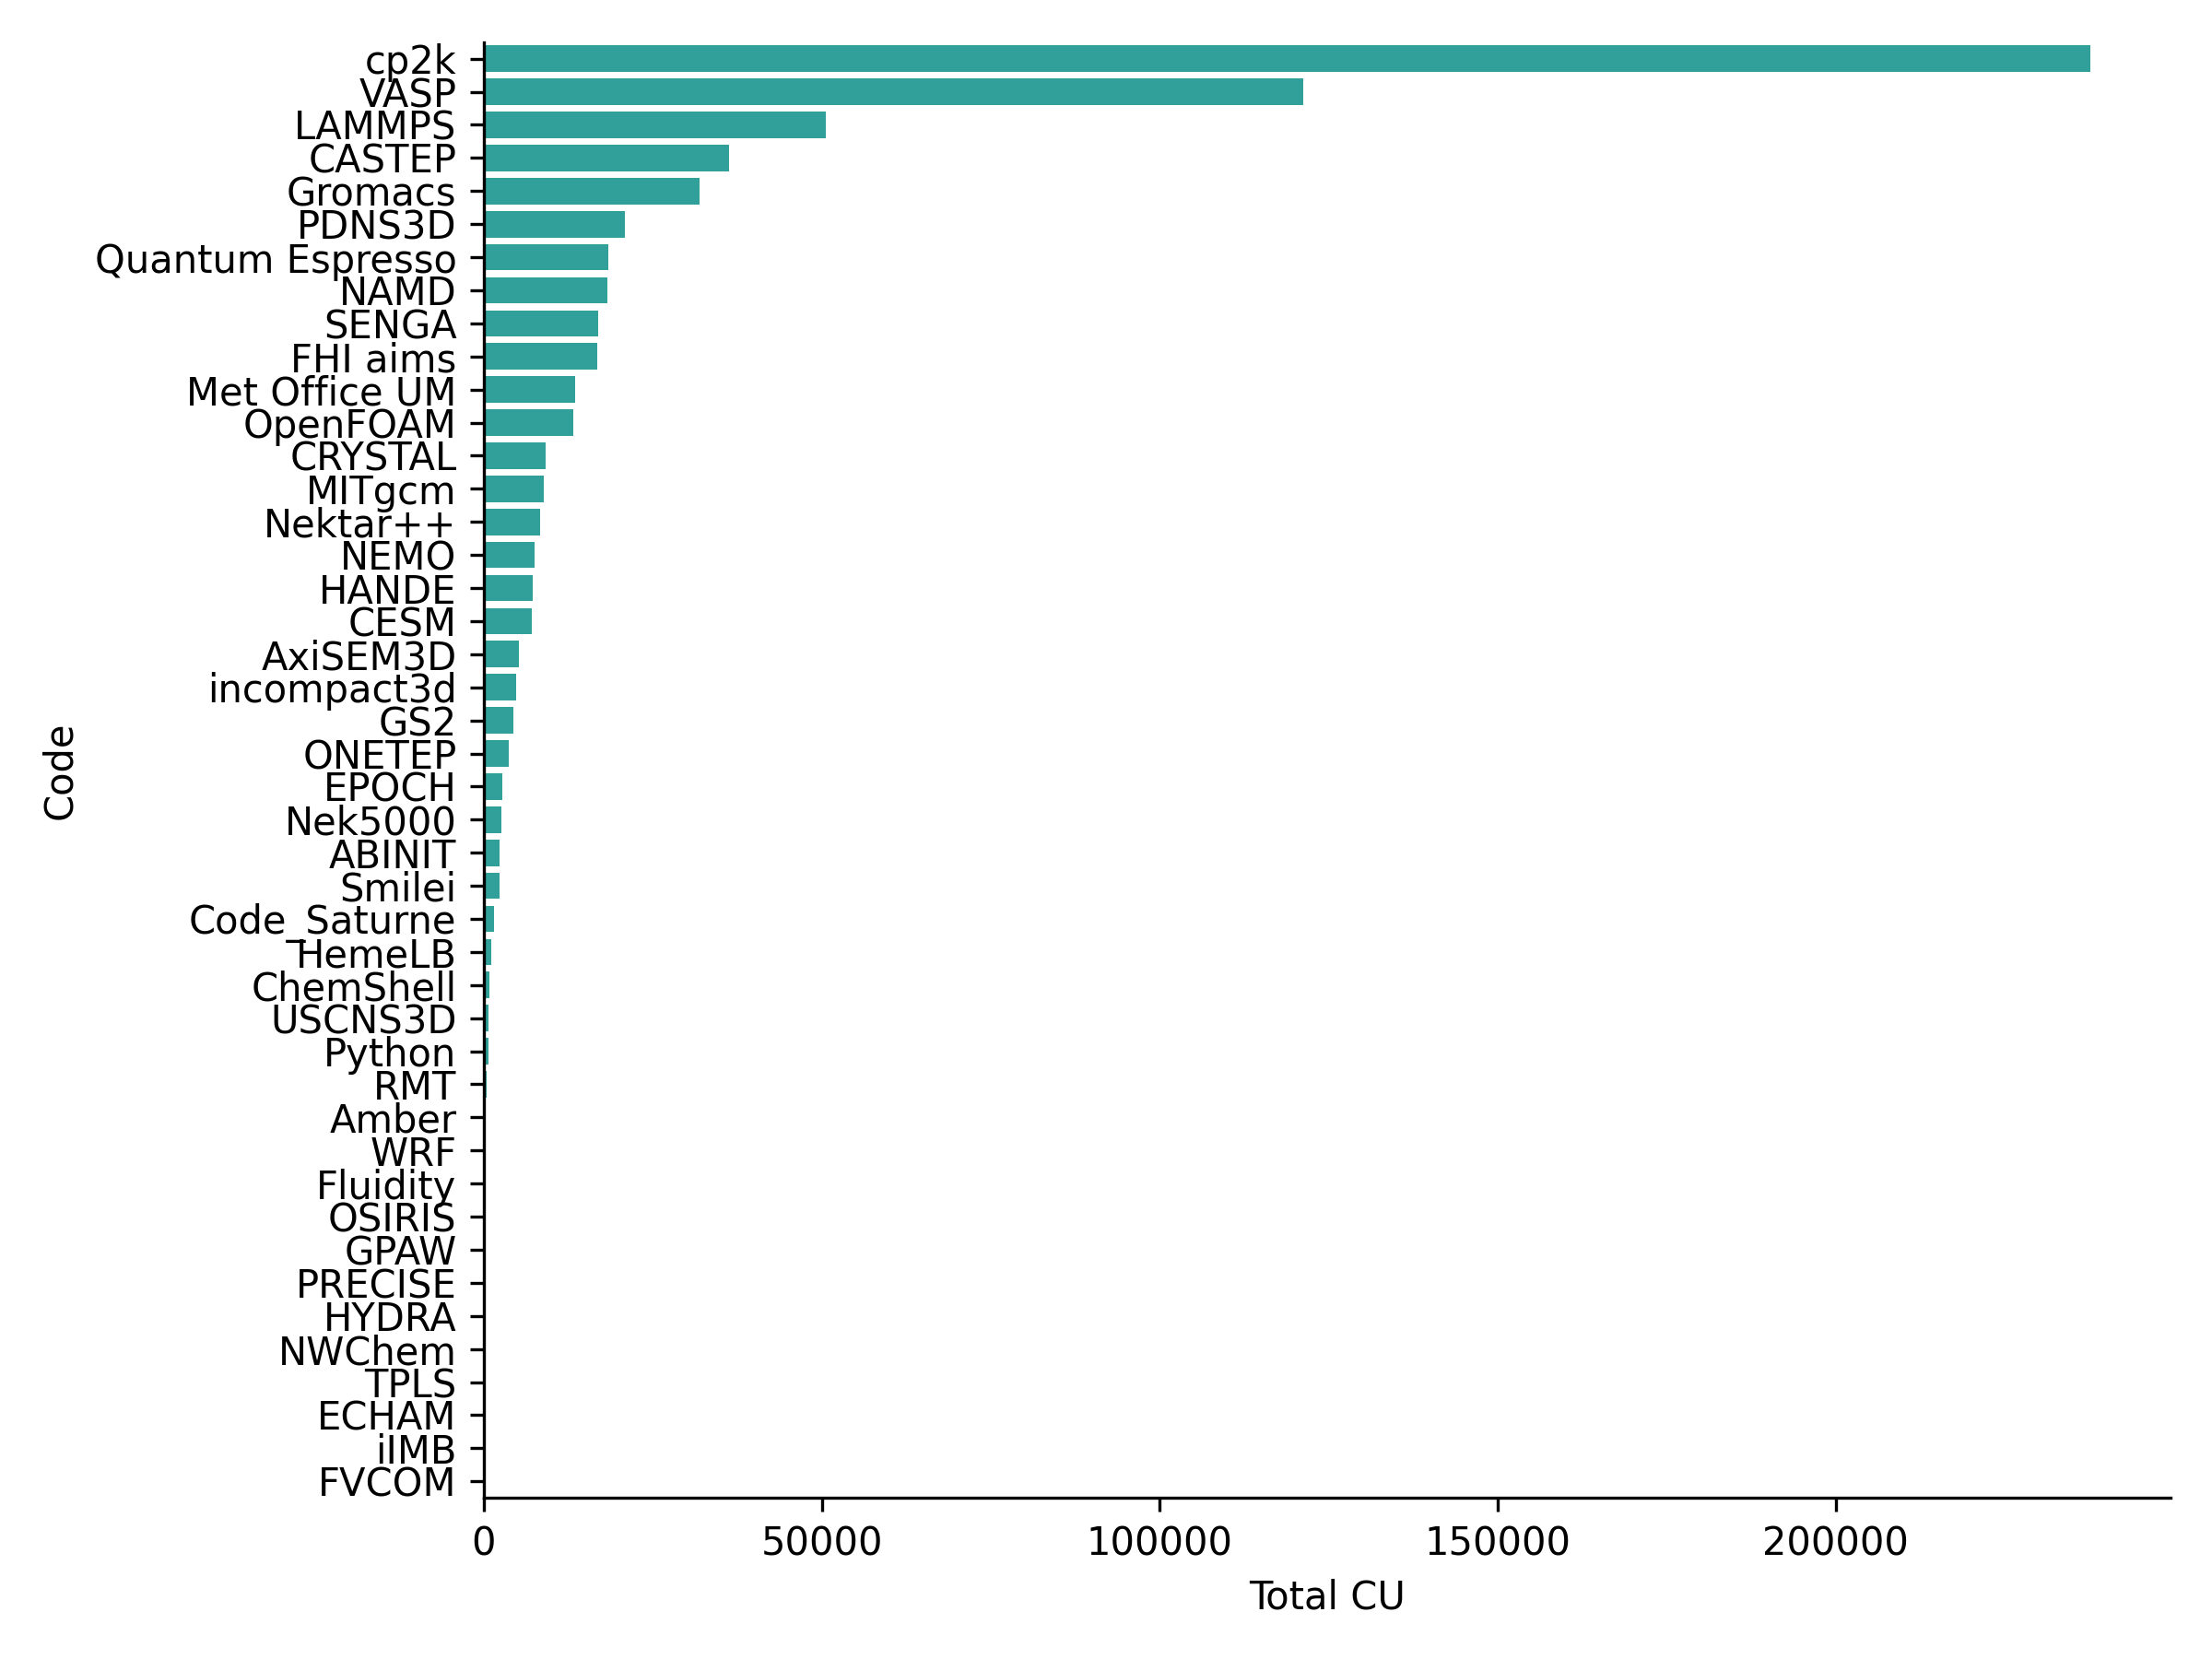
The research software applications generally match those seen on ARCHER though the ordering is slightly different. Due to the short usage period analysed here, we do not yet have enough data to say if this is a real difference or not. Research software applications in the top 15 in terms of use that are common with the top 15 on ARCHER are: cp2k, VASP, LAMMPS, CASTEP, GROMACS, Met Office Unified Model, MITgcm, NEMO, Quantum Espresso and NAMD. Entries that appear in the ARCHER2 top 15 but not in ARCHER top 15 are: PDNS3D, HANDE, CESM, incompact3d and AxiSEM3D. We will report back on this picture once we have data for a longer period of use.
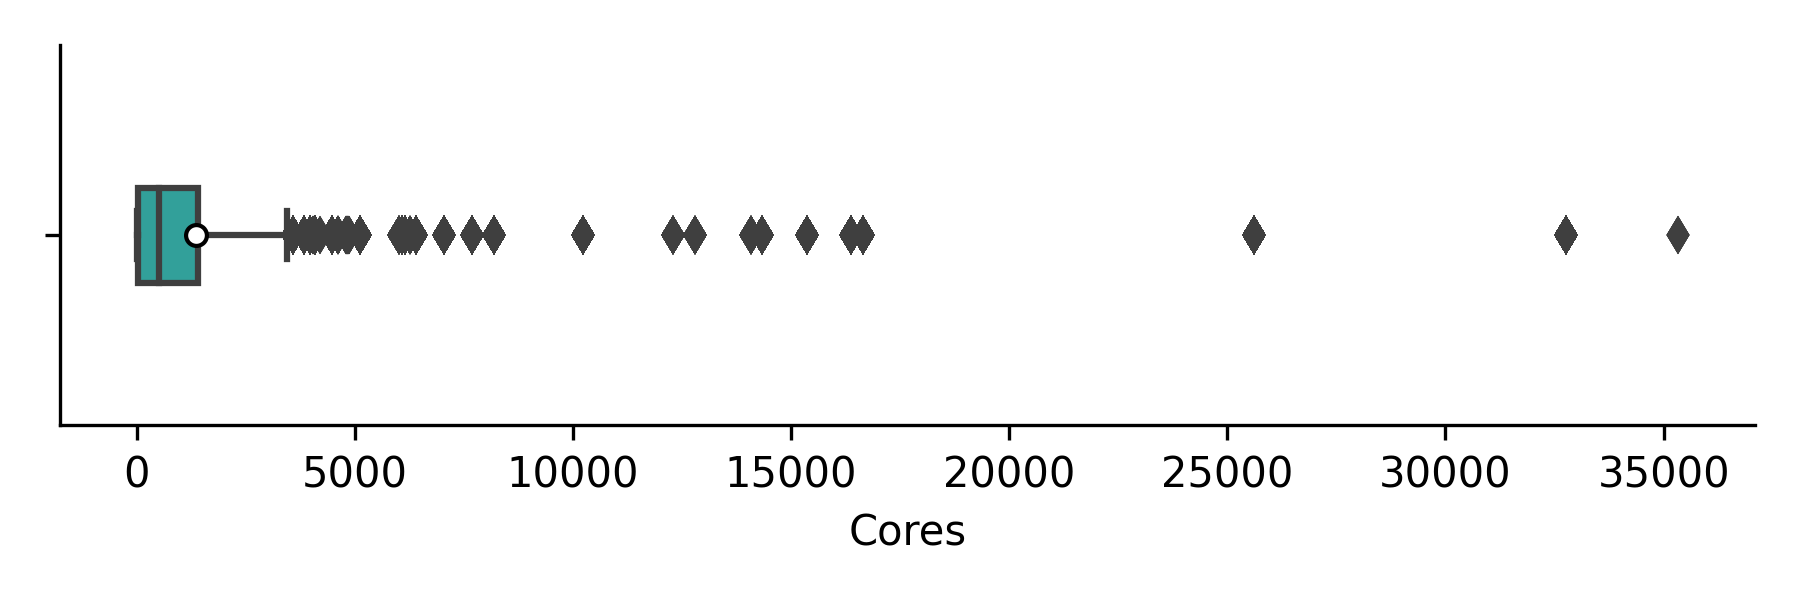
We have also looked at the job size distribution, the overall job size ditribution in cores (weighted by job CU use)is shown in the boxplot below (white circles indicate the mean job size but these are not generally a useful statistic here) with the corresponding numerical values in the table.
| Code | Min | Q1 | Median | Q3 | Max | Jobs | CU |
|---|---|---|---|---|---|---|---|
| Overall | 1 | 48.0 | 512.0 | 1408.0 | 35328 | 325216 | 768873.8 |
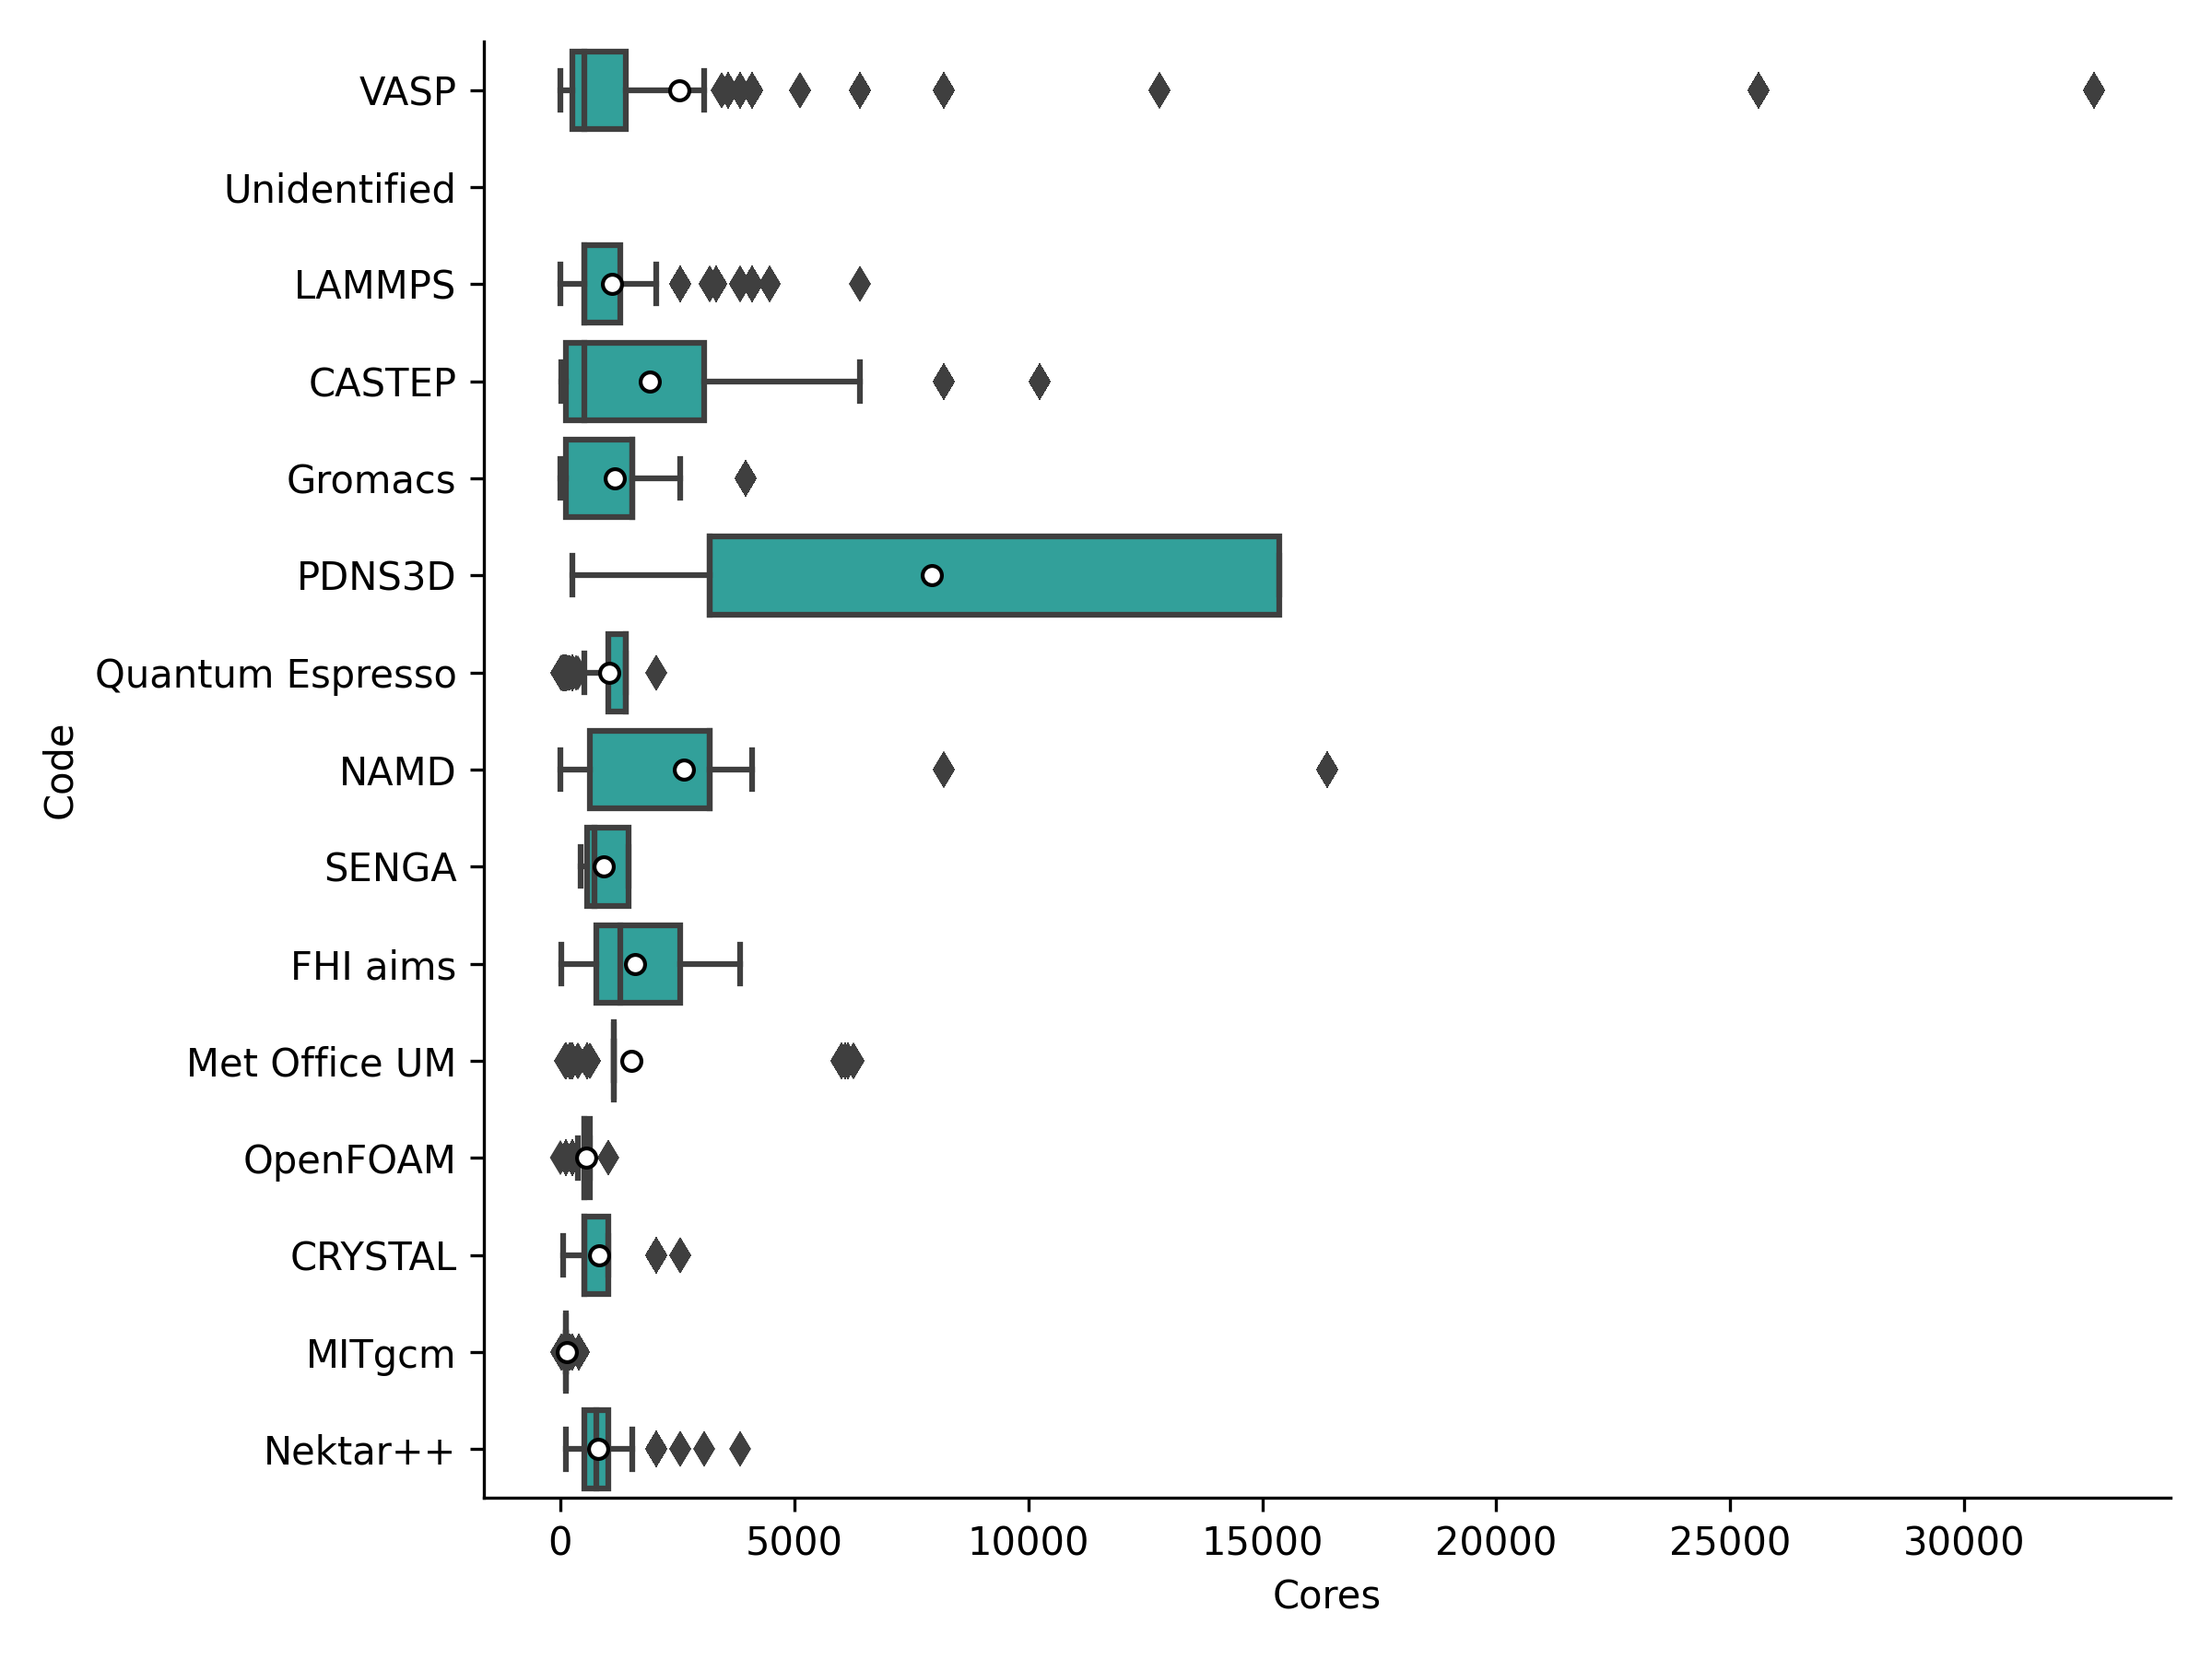
We have also broken down the job size statistics (in cores) by the top 15 research software used on ARCHER2 in the period. The following plot and table provide details on these job sizes.
| Code | Min | Q1 | Median | Q3 | Max | Jobs | CU | % CU |
|---|---|---|---|---|---|---|---|---|
| cp2k | 1 | 1.0 | 1.0 | 64.0 | 4096 | 23677 | 237609.3 | 30.9 |
| VASP | 1 | 256.0 | 384.0 | 1408.0 | 32768 | 64231 | 121166.8 | 15.8 |
| LAMMPS | 1 | 512.0 | 512.0 | 1280.0 | 6400 | 9192 | 50634.0 | 6.6 |
| CASTEP | 1 | 128.0 | 256.0 | 2560.0 | 10240 | 132161 | 36330.5 | 4.7 |
| Gromacs | 1 | 128.0 | 1536.0 | 1536.0 | 4096 | 27196 | 31878.8 | 4.1 |
| PDNS3D | 1 | 3200.0 | 3200.0 | 15360.0 | 15360 | 121 | 20867.7 | 2.7 |
| Quantum Espresso | 1 | 1024.0 | 1024.0 | 1408.0 | 2048 | 8347 | 18406.5 | 2.4 |
| NAMD | 1 | 640.0 | 3200.0 | 3200.0 | 16384 | 1481 | 18318.6 | 2.4 |
| SENGA | 432 | 576.0 | 729.0 | 1458.0 | 1458 | 78 | 16879.1 | 2.2 |
| FHI aims | 8 | 512.0 | 1280.0 | 2560.0 | 3840 | 4757 | 16766.1 | 2.2 |
| Met Office UM | 1 | 1152.0 | 1152.0 | 1152.0 | 6272 | 928 | 13473.1 | 1.8 |
| OpenFOAM | 2 | 512.0 | 512.0 | 640.0 | 1024 | 804 | 13215.2 | 1.7 |
| CRYSTAL | 1 | 512.0 | 512.0 | 1024.0 | 2560 | 442 | 9217.2 | 1.2 |
| MITgcm | 1 | 128.0 | 128.0 | 128.0 | 400 | 528 | 8843.1 | 1.2 |
| Nektar++ | 128 | 512.0 | 768.0 | 1024.0 | 3840 | 348 | 8317.4 | 1.1 |
Looking at this data, we can note a few trends:
- Some research software use a range of different job sizes whereas some are much more resticted to particular sizes. For example, at least half of the large cp2k use is made up of a large number of single core runs - presumably some kind of parameter sweep or statistical sampling workflow. This could indicate that over this short period the use of a particular piece of software is restricted to a single user with a particular use case.
- The only code that is currently being used at large scale is the PDNS3D CFD code with all jobs using at lease 3,200 cores and the largest jobs using 15,360 cores.
- 7 of the top 15 by usage are materials modelling research software (and they make up 4 of the top 5), 4 of the 15 are CFD, 2 are Earth systems modelling software and 2 are biomolecular simulation.
The restricted size of the current ARCHER2 system (only the initial 4 cabinets out of the full 23 are available at the time of writing) clearly limits the ability of users to scale up their calculations to higher core counts and still see reasonable throughput. In fact, the ability to run very large jobs (larger than 256 nodes) is currently restricted on the system to improve the throughput for the user community, leading to an effective cap on production job sizes at 256 nodes. We expect the user community to be able to make more effective use of larger scale calculations once the full ARCHER2 system is available.
We will report back in a future blog post on how the research software use trends have evolved over the ARCHER2 service and also report back on trends associated with different research areas and programming language use on the service.
If you wish to analyse the data yourself we provide links to the dataset used for this analysis below along with a link to the Python script used to produce the plots and tables in this post. We also include the full summary table for all research software that we are currently able to identify through the analysis tool.
Full job size statistics
Job size ditribution and usage in cores (weighted by job CU use)
| Code | Min | Q1 | Median | Q3 | Max | Jobs | CU | % CU |
|---|---|---|---|---|---|---|---|---|
| Overall | 1 | 48.0 | 512.0 | 1408.0 | 35328 | 325216 | 768873.8 | 100.0 |
| cp2k | 1 | 1.0 | 1.0 | 64.0 | 4096 | 23677 | 237609.3 | 30.9 |
| VASP | 1 | 256.0 | 384.0 | 1408.0 | 32768 | 64231 | 121166.8 | 15.8 |
| Unidentified | 1 | 192.0 | 1024.0 | 3584.0 | 35328 | 40261 | 90011.7 | 11.7 |
| LAMMPS | 1 | 512.0 | 512.0 | 1280.0 | 6400 | 9192 | 50634.0 | 6.6 |
| CASTEP | 1 | 128.0 | 256.0 | 2560.0 | 10240 | 132161 | 36330.5 | 4.7 |
| Gromacs | 1 | 128.0 | 1536.0 | 1536.0 | 4096 | 27196 | 31878.8 | 4.1 |
| PDNS3D | 1 | 3200.0 | 3200.0 | 15360.0 | 15360 | 121 | 20867.7 | 2.7 |
| Quantum Espresso | 1 | 1024.0 | 1024.0 | 1408.0 | 2048 | 8347 | 18406.5 | 2.4 |
| NAMD | 1 | 640.0 | 3200.0 | 3200.0 | 16384 | 1481 | 18318.6 | 2.4 |
| SENGA | 432 | 576.0 | 729.0 | 1458.0 | 1458 | 78 | 16879.1 | 2.2 |
| FHI aims | 8 | 512.0 | 1280.0 | 2560.0 | 3840 | 4757 | 16766.1 | 2.2 |
| Met Office UM | 1 | 1152.0 | 1152.0 | 1152.0 | 6272 | 928 | 13473.1 | 1.8 |
| OpenFOAM | 2 | 512.0 | 512.0 | 640.0 | 1024 | 804 | 13215.2 | 1.7 |
| CRYSTAL | 1 | 512.0 | 512.0 | 1024.0 | 2560 | 442 | 9217.2 | 1.2 |
| MITgcm | 1 | 128.0 | 128.0 | 128.0 | 400 | 528 | 8843.1 | 1.2 |
| Nektar++ | 128 | 512.0 | 768.0 | 1024.0 | 3840 | 348 | 8317.4 | 1.1 |
| NEMO | 1 | 456.0 | 456.0 | 1792.0 | 4864 | 5400 | 7533.5 | 1.0 |
| HANDE | 1 | 4.0 | 4.0 | 4.0 | 4 | 59 | 7245.4 | 0.9 |
| CESM | 48 | 48.0 | 48.0 | 48.0 | 288 | 232 | 7163.8 | 0.9 |
| AxiSEM3D | 15 | 1280.0 | 1536.0 | 1920.0 | 4480 | 106 | 5208.4 | 0.7 |
| incompact3d | 640 | 2048.0 | 2048.0 | 2048.0 | 4096 | 47 | 4744.1 | 0.6 |
| GS2 | 64 | 1408.0 | 1408.0 | 1408.0 | 1408 | 143 | 4335.2 | 0.6 |
| ONETEP | 1 | 32.0 | 64.0 | 64.0 | 2048 | 317 | 3715.6 | 0.5 |
| EPOCH | 128 | 1920.0 | 2560.0 | 2560.0 | 2560 | 36 | 2826.2 | 0.4 |
| Nek5000 | 72 | 72.0 | 288.0 | 576.0 | 864 | 46 | 2645.4 | 0.3 |
| ABINIT | 1 | 384.0 | 384.0 | 384.0 | 768 | 535 | 2386.9 | 0.3 |
| Smilei | 2 | 64.0 | 256.0 | 320.0 | 1024 | 116 | 2354.5 | 0.3 |
| Code_Saturne | 256 | 768.0 | 2048.0 | 3456.0 | 14080 | 43 | 1581.1 | 0.2 |
| HemeLB | 256 | 512.0 | 768.0 | 768.0 | 1536 | 17 | 1071.9 | 0.1 |
| ChemShell | 1 | 128.0 | 384.0 | 896.0 | 3072 | 177 | 887.8 | 0.1 |
| USCNS3D | 8 | 64.0 | 64.0 | 128.0 | 128 | 46 | 732.9 | 0.1 |
| Python | 1 | 1.0 | 1.0 | 256.0 | 4096 | 1745 | 704.5 | 0.1 |
| RMT | 4 | 384.0 | 384.0 | 384.0 | 2688 | 258 | 491.1 | 0.1 |
| Amber | 128 | 128.0 | 128.0 | 128.0 | 128 | 28 | 265.3 | 0.0 |
| WRF | 32 | 72.0 | 120.0 | 120.0 | 512 | 87 | 246.2 | 0.0 |
| Fluidity | 1000 | 1000.0 | 1000.0 | 1000.0 | 1000 | 19 | 227.1 | 0.0 |
| OSIRIS | 192 | 192.0 | 192.0 | 192.0 | 192 | 3 | 219.3 | 0.0 |
| GPAW | 128 | 128.0 | 128.0 | 256.0 | 384 | 299 | 116.3 | 0.0 |
| PRECISE | 1 | 1024.0 | 2048.0 | 2048.0 | 4096 | 227 | 93.3 | 0.0 |
| HYDRA | 1 | 18.0 | 256.0 | 512.0 | 1024 | 208 | 69.2 | 0.0 |
| NWChem | 128 | 1024.0 | 1024.0 | 1024.0 | 1024 | 27 | 34.8 | 0.0 |
| TPLS | 1 | 128.0 | 128.0 | 128.0 | 256 | 425 | 19.1 | 0.0 |
| ECHAM | 256 | 256.0 | 256.0 | 256.0 | 256 | 7 | 14.4 | 0.0 |
| iIMB | 256 | 256.0 | 256.0 | 256.0 | 256 | 4 | 2.9 | 0.0 |
| FVCOM | 1 | 256.0 | 256.0 | 256.0 | 256 | 7 | 2.4 | 0.0 |