
Research Software Use on ARCHER
By Andy Turner (EPCC) on February 4, 2021
Tags:
Now that the ARCHER service has finished, I thought it would be interesting to take a brief look at the use of different research software on the service over its lifetime.
ARCHER was in service for over 7 years: from late 2013 until its shutdown in early 2021. Over the whole service lifetime, there were just under 6.1 billion core hours used for computation. Assuming you had a 4-core laptop with the cores with the same performance as ARCHER cores, it would take over 173,000 years to get through the same amount of computation as ARCHER did in its lifetime.
For this initial look at software use, I have used the data that was collected by interrogating ALPS every hour via the apstat command. A full description of the collection methodology can be found in a previous paper. Over the lifetime of the service we moved to collecting data on running applications using the Cray RUR tool and importing them into the EPCC SAFE to leverage the more powerful reporting and analysis capabilities available via SAFE. The data from SAFE will form the basis of a future blog article. For this analysis, we are looking at research software usage for the period June 2014 to April 2020 inclusive. The chart below shows the use (in kAU, there are 0.015 core hours per kAU) for each application that we collect data on plus the remaining use that was not attributed to known applications:
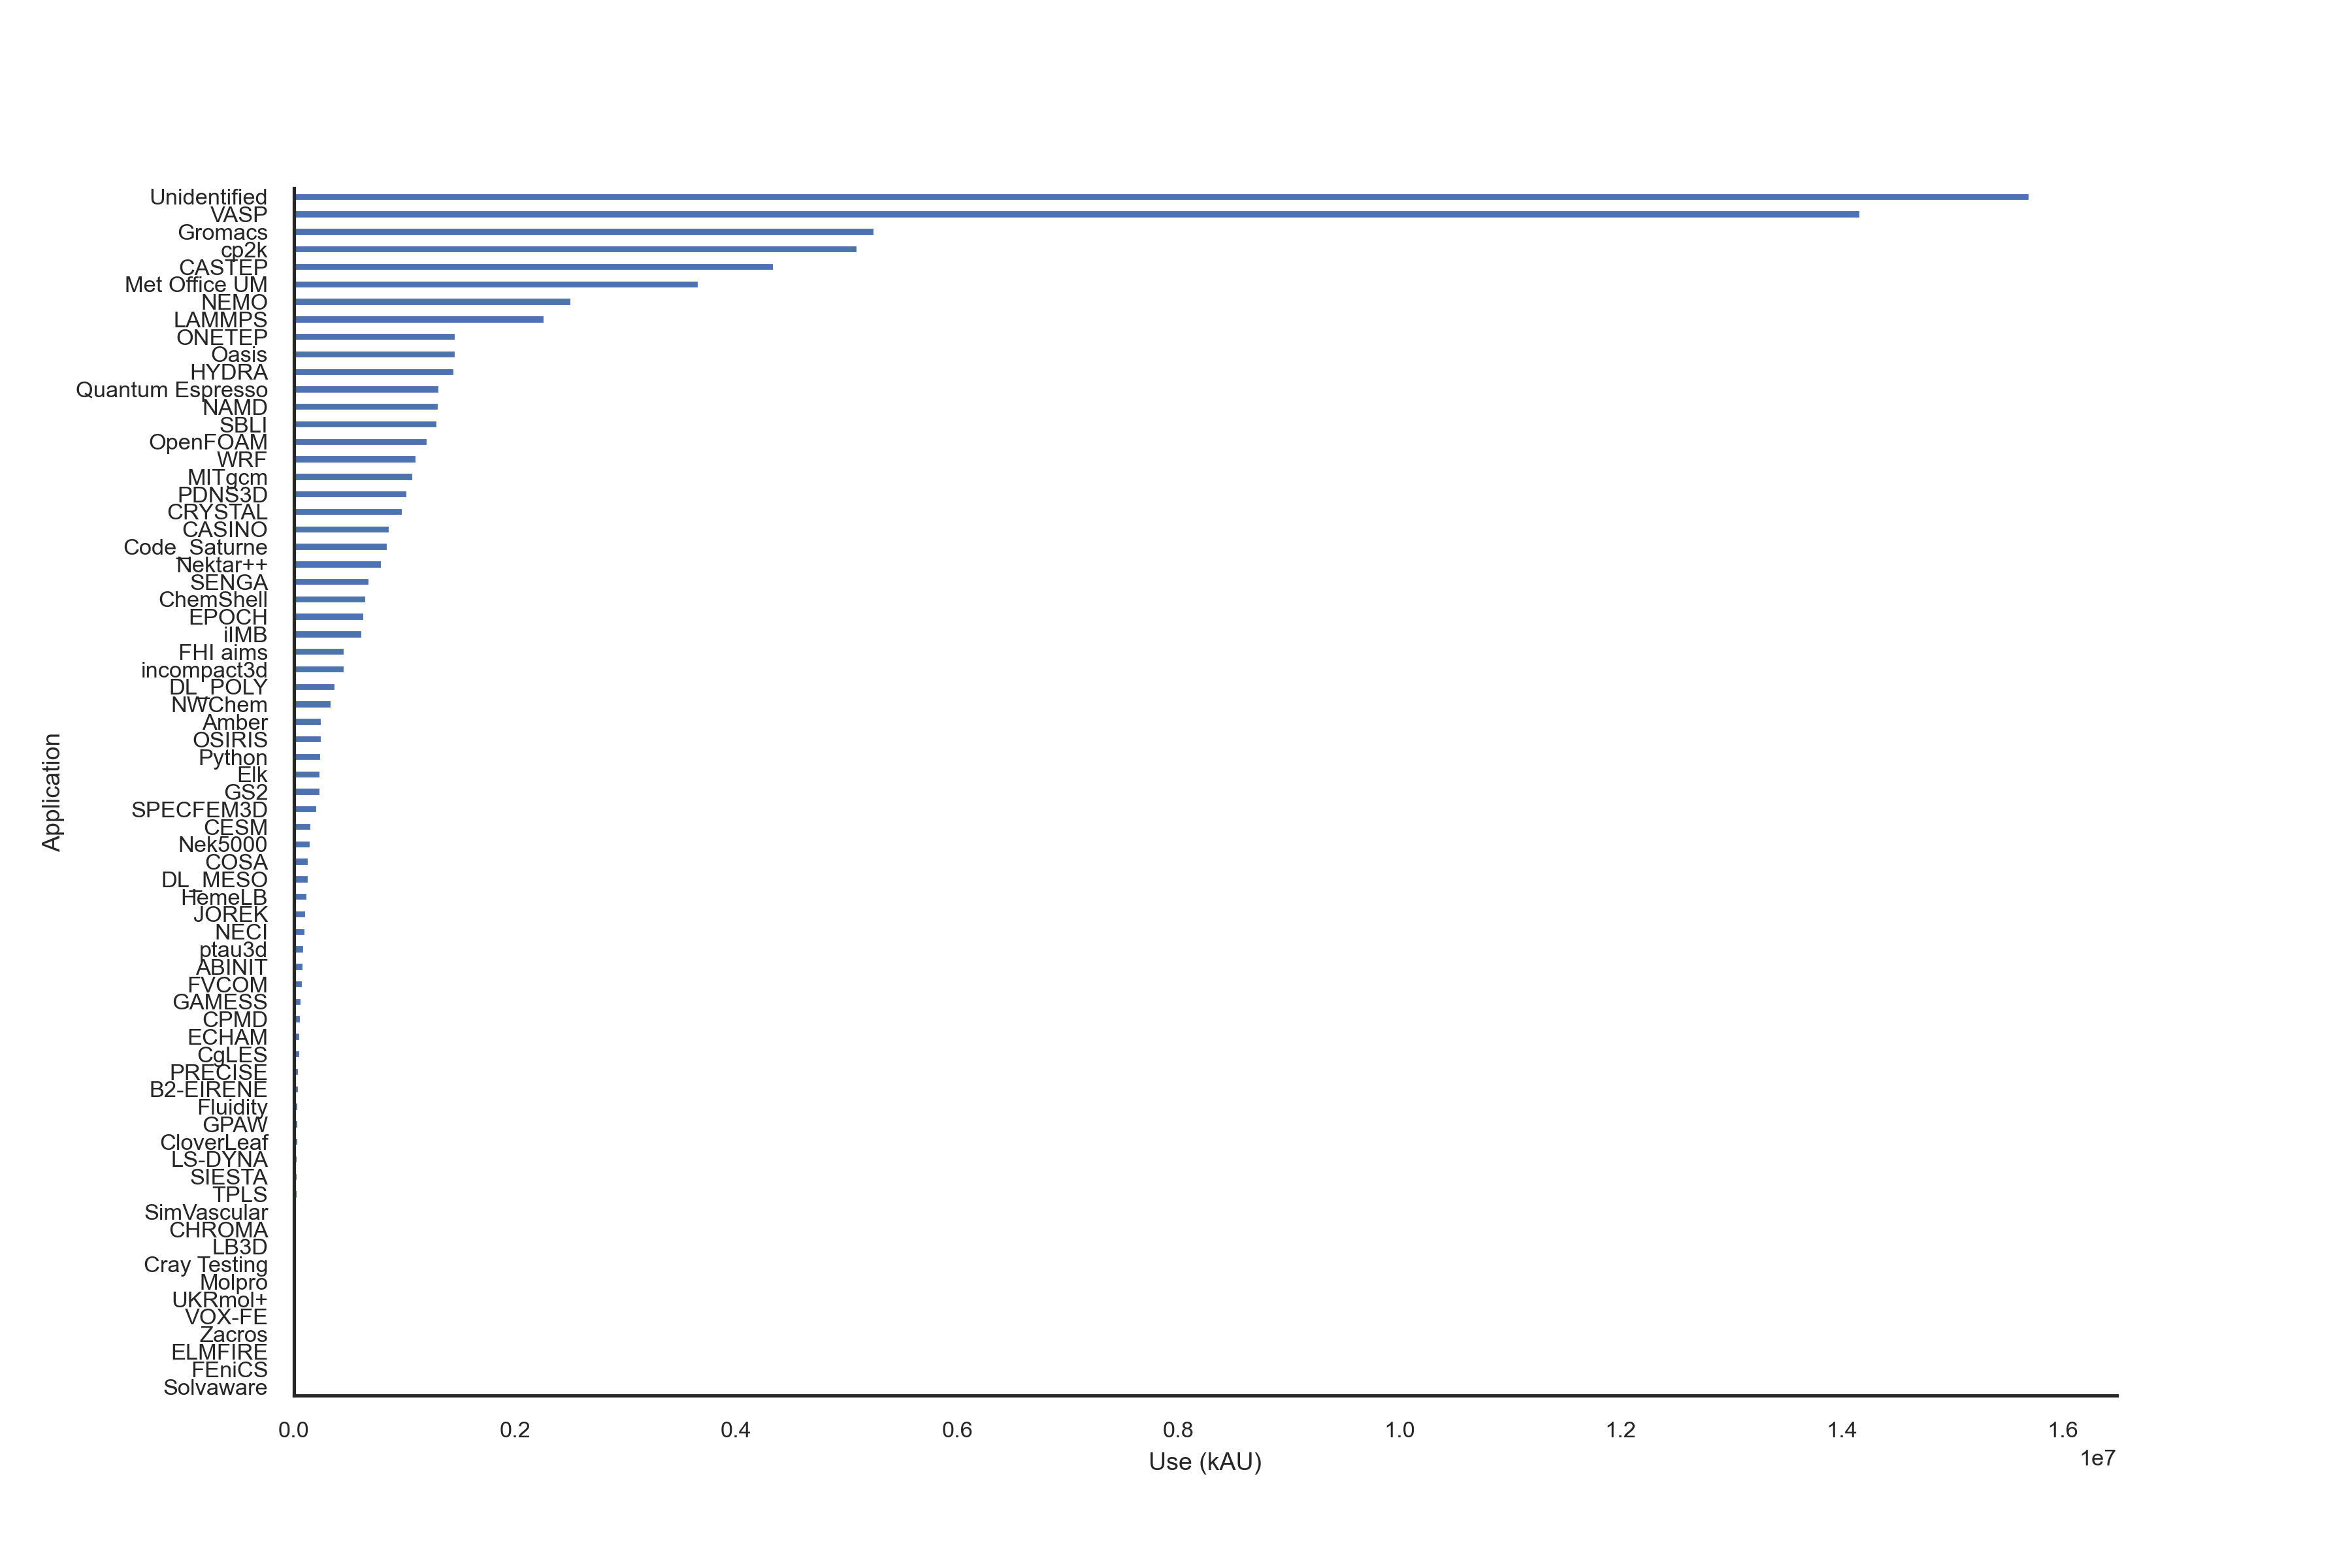
This chart shows that the software use is quite broad with some software using large amounts of time and a large number of software each using a small amount of time. To give an idea of the spread, the top 10 applications by use (not including the “Unidentified” group in the chart) account for around 55% of the total use, the top 20 applications by use account for around 68% and the top 40 account for around 78% (we identify use from 68 research software packages). Around 20% of use is not associated with known research software packages.
We can also look at how use over time has varied for the top 5 applications (which account for around 42% of use) on a monthly basis:
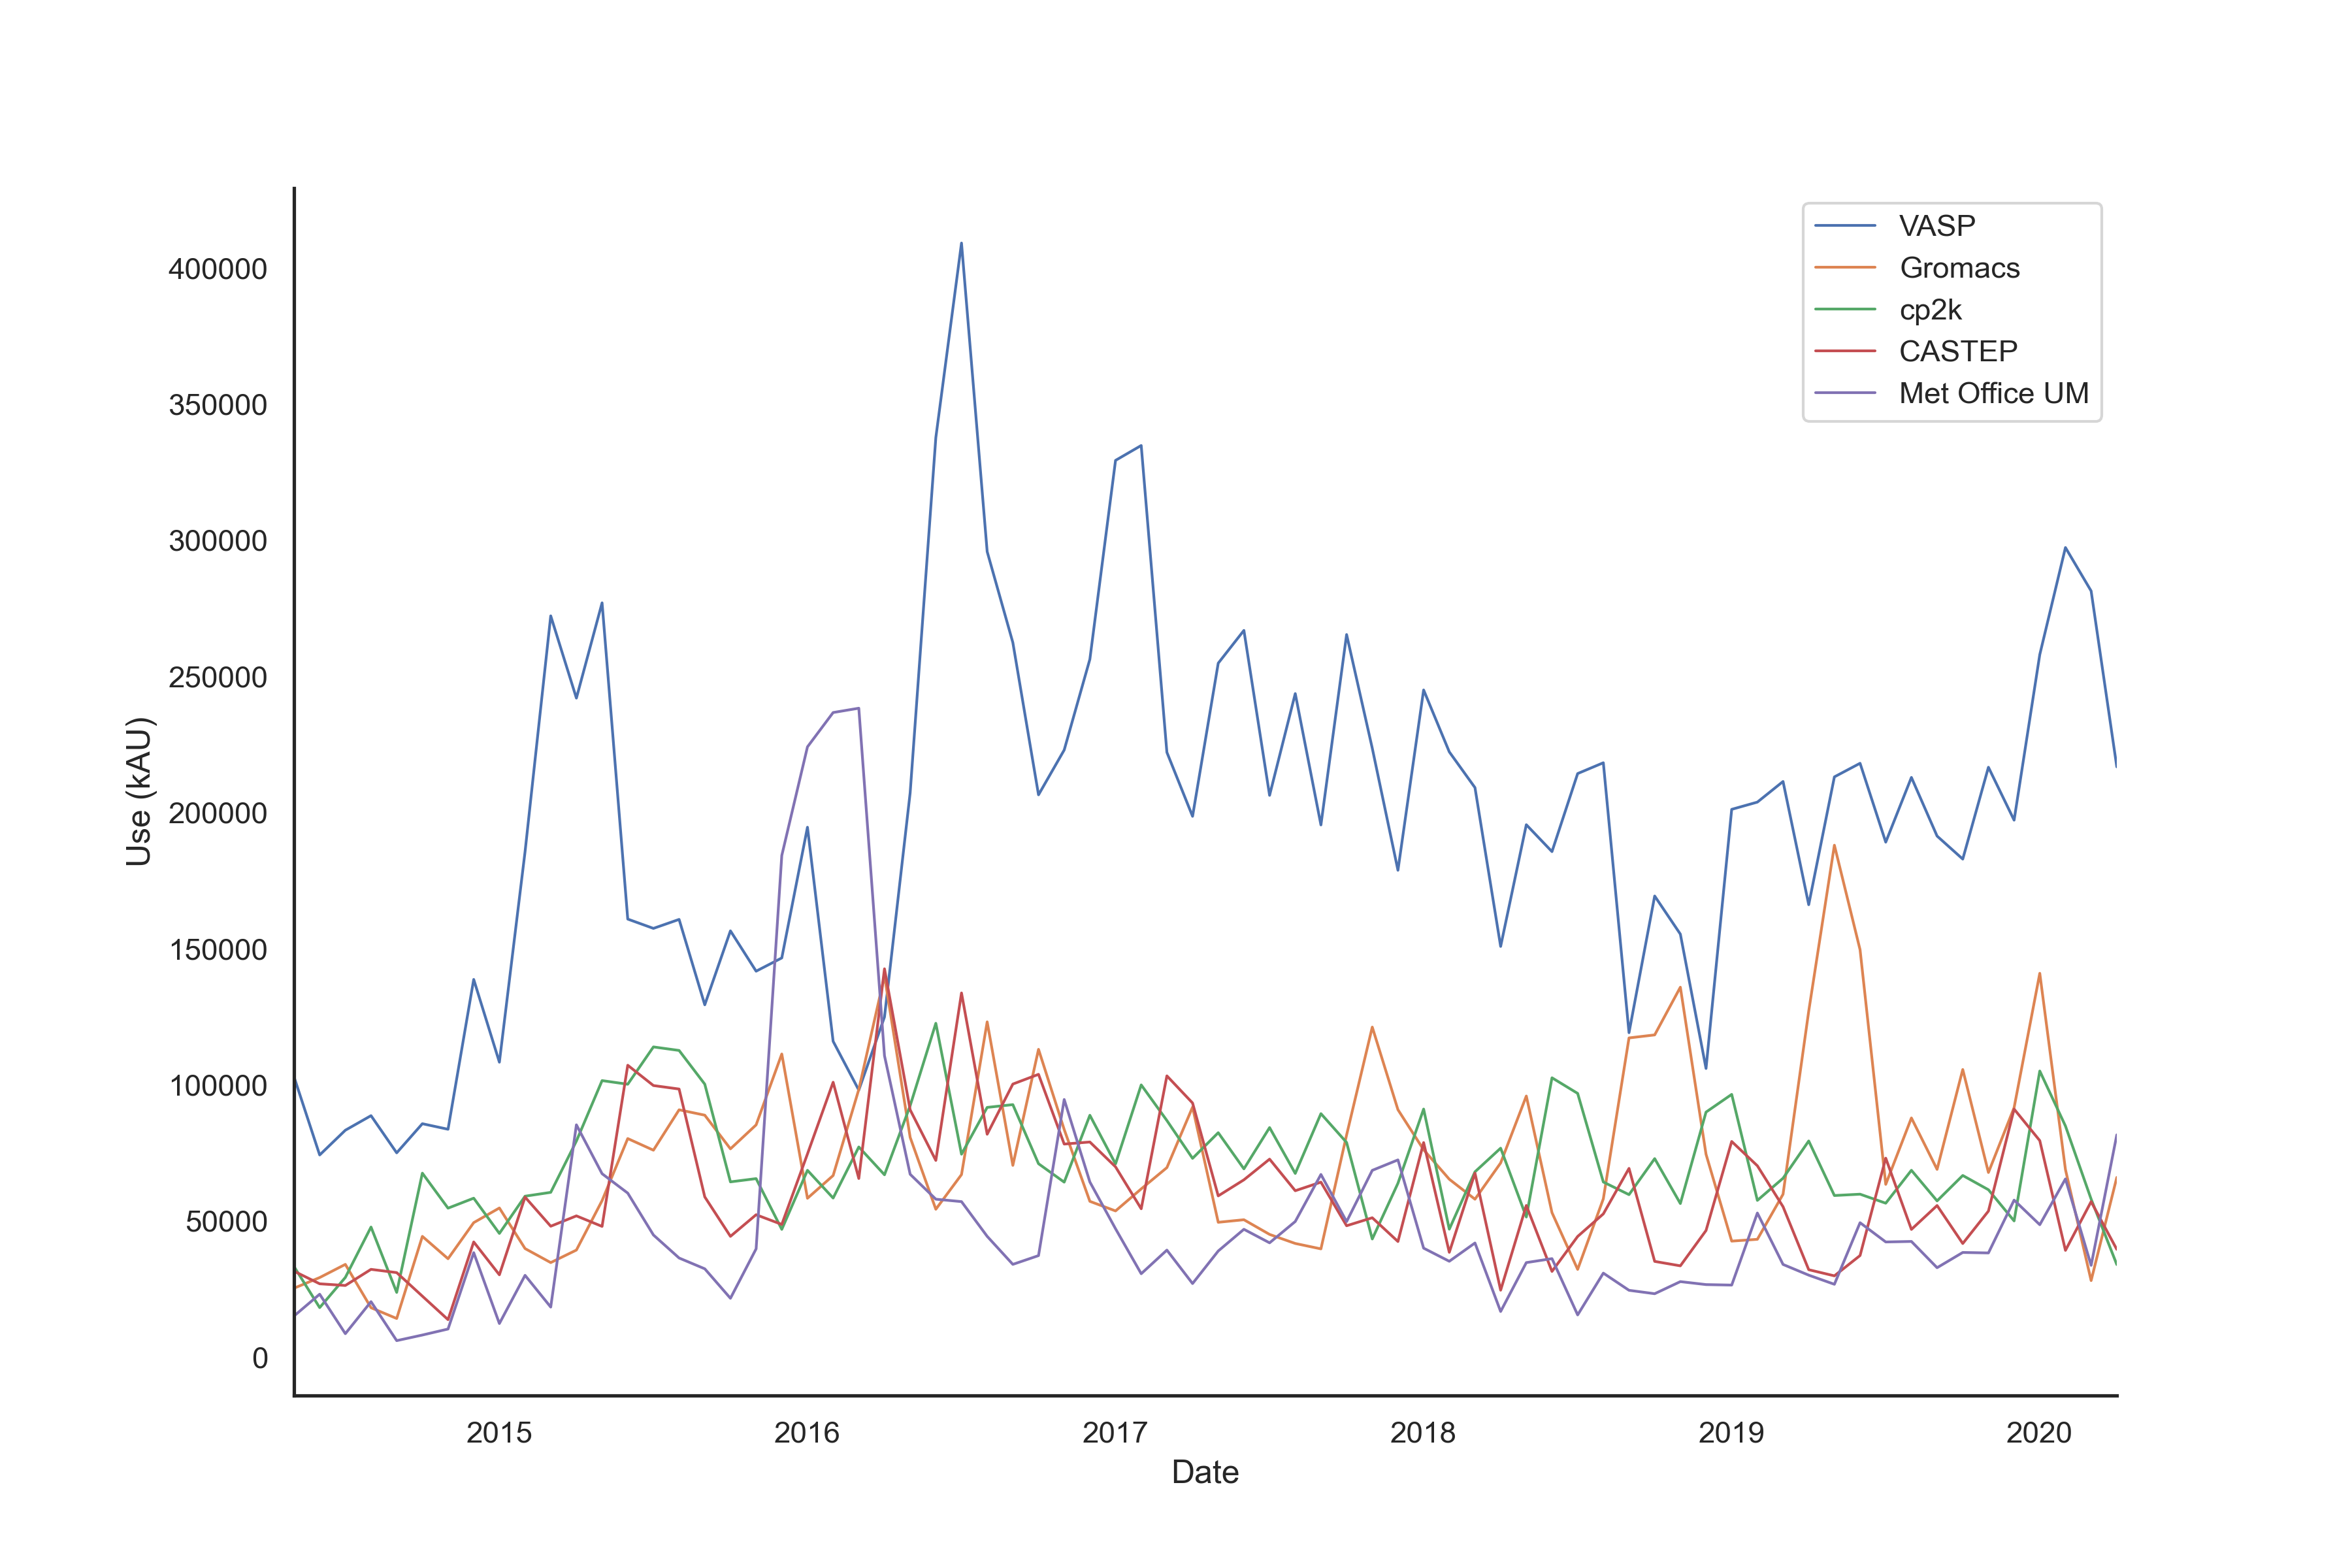
You can see that VASP has always been the top used research software package apart from a brief period in 2016 when the UK Met Office Unified Model application was extremely heavily used.
Finally, we can take a look at the size of the jobs that have been run over all use and for each of the top 5 applications. In the charts below, the markers represent the median job size and the shaded area covers the interquartile range for the job size. The job size statistics are weighted by usage rather than job count.
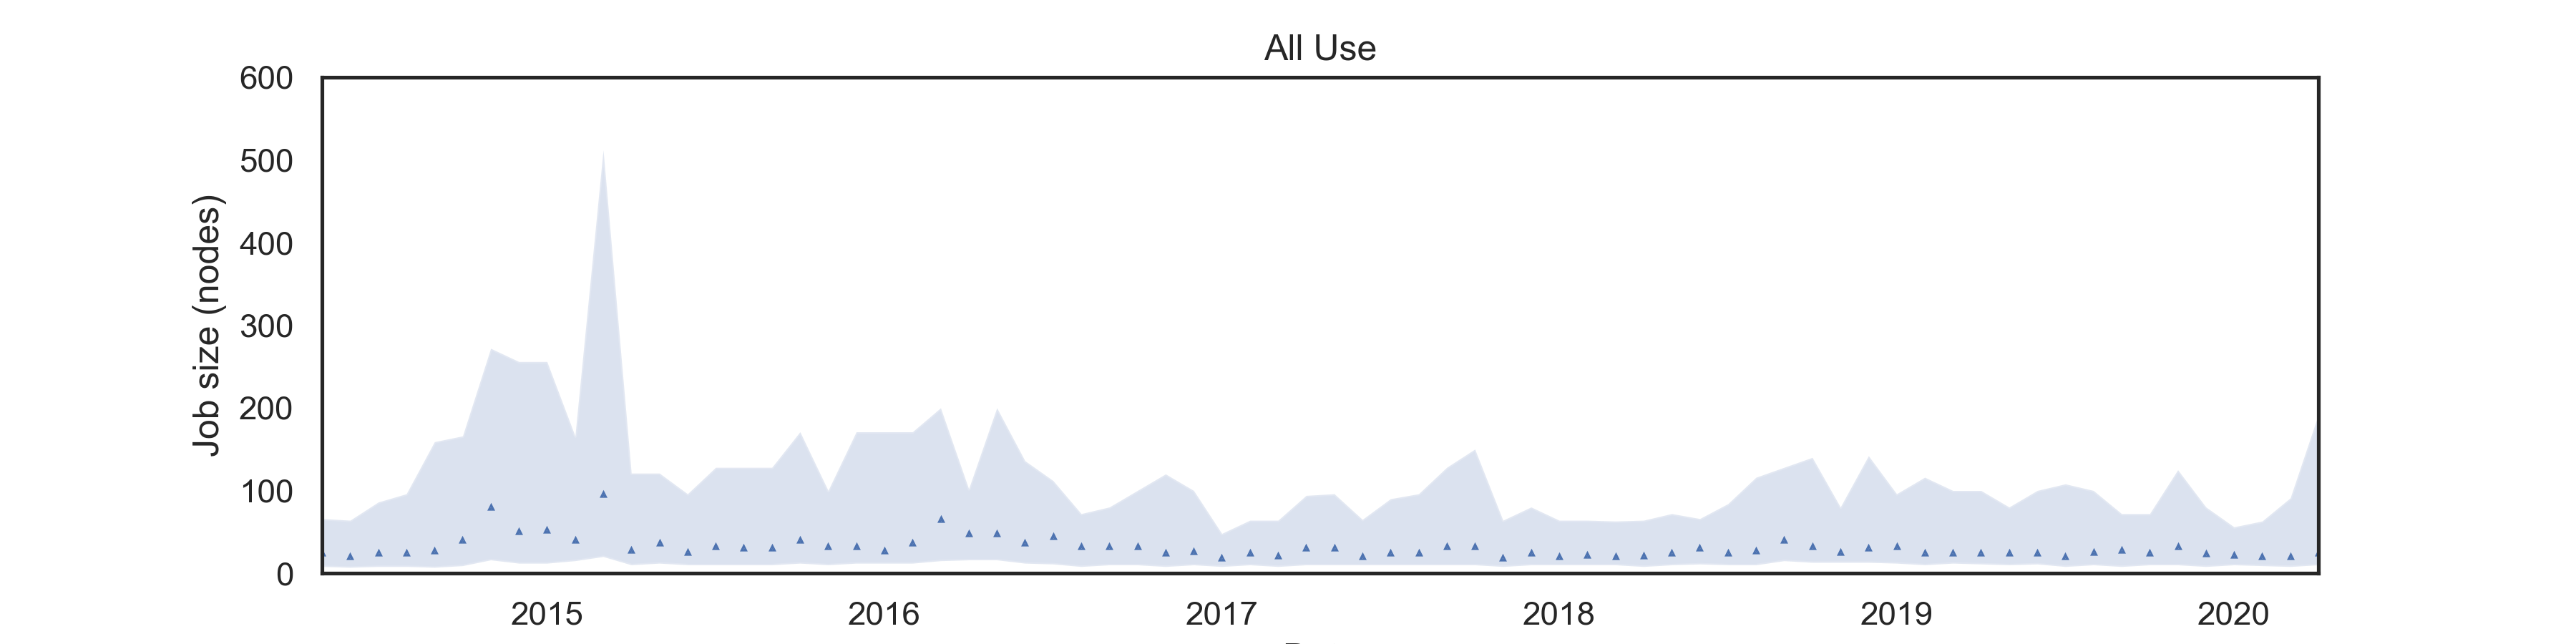
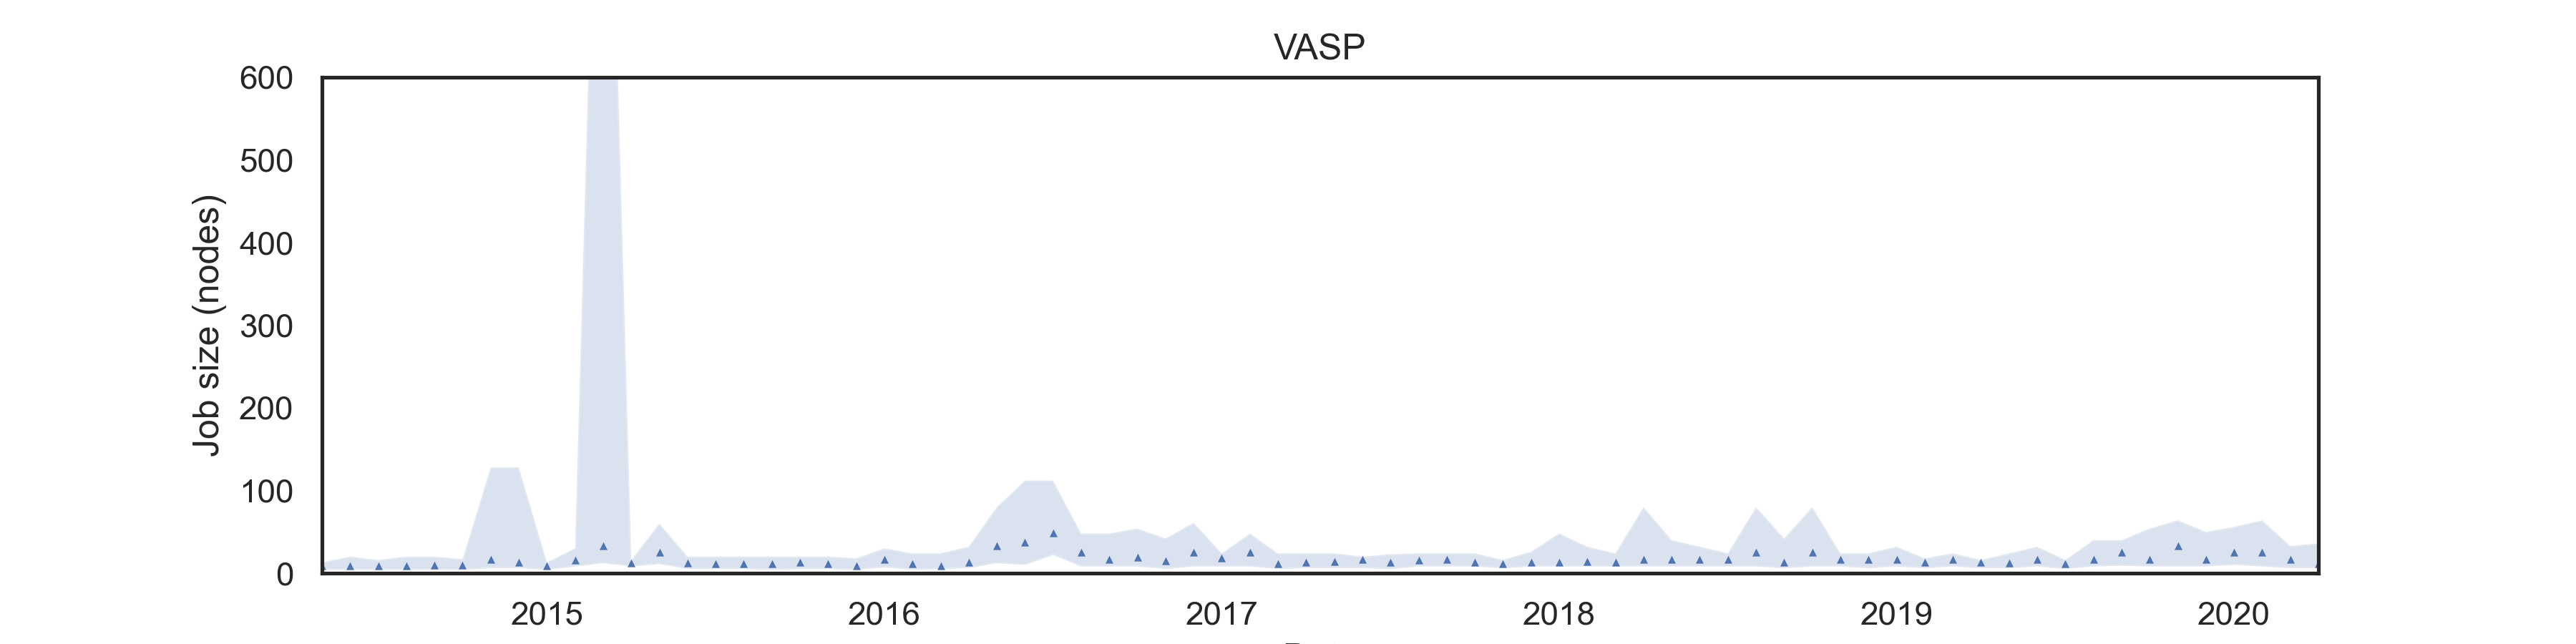
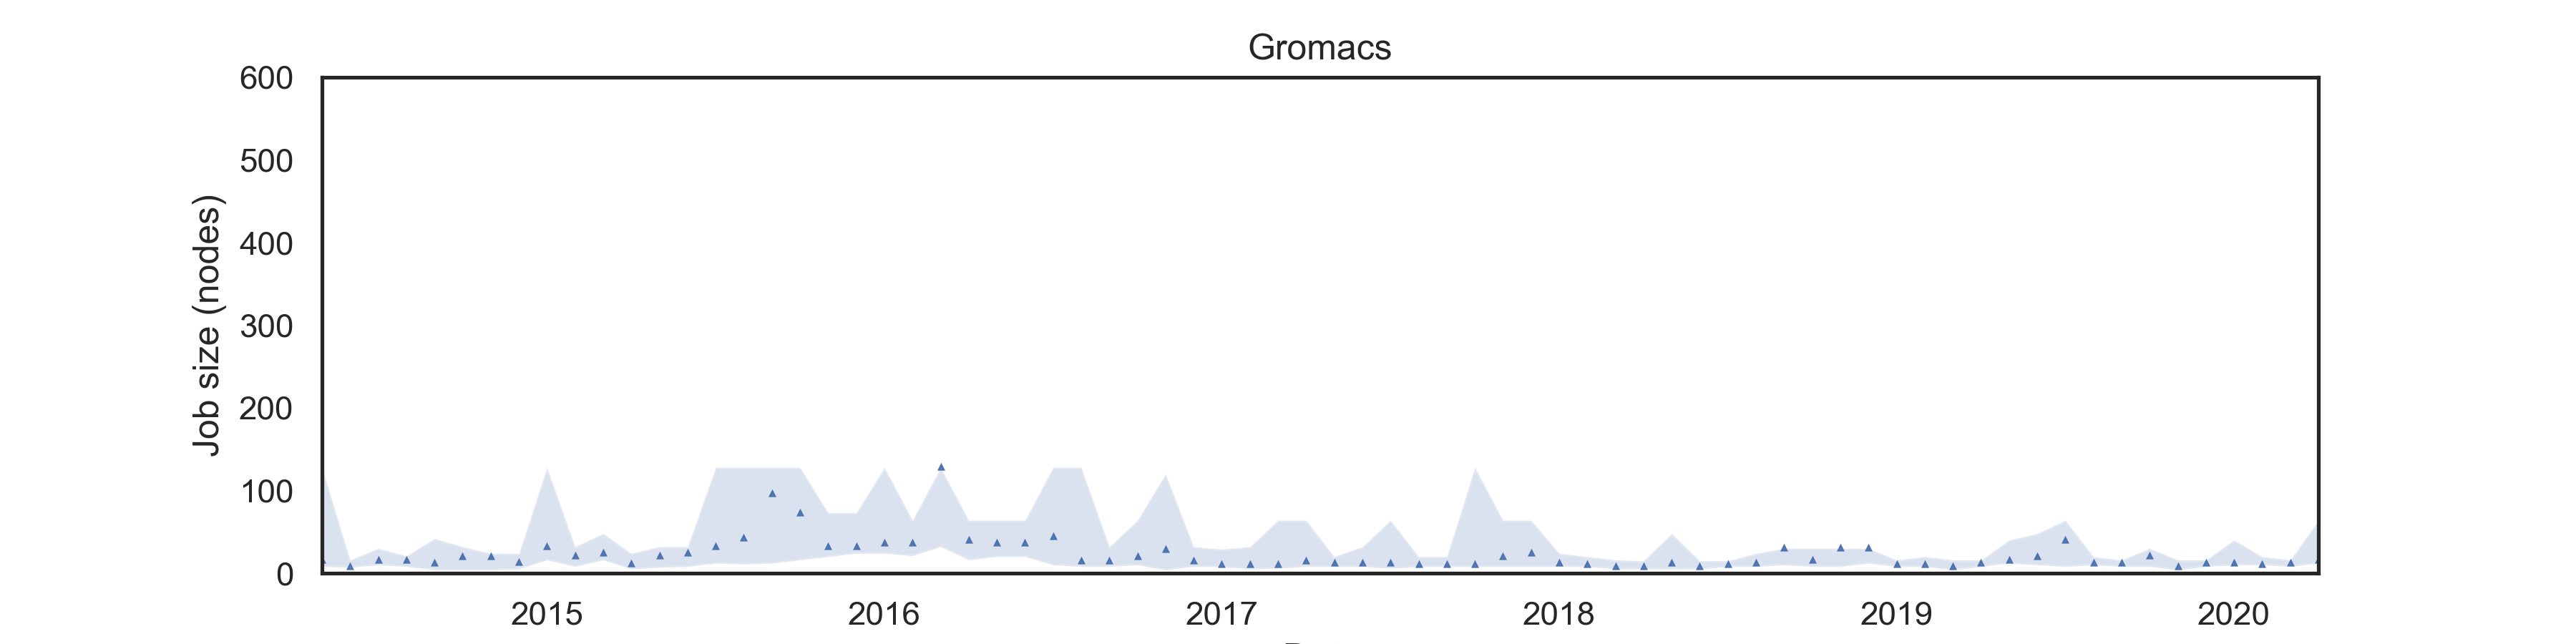
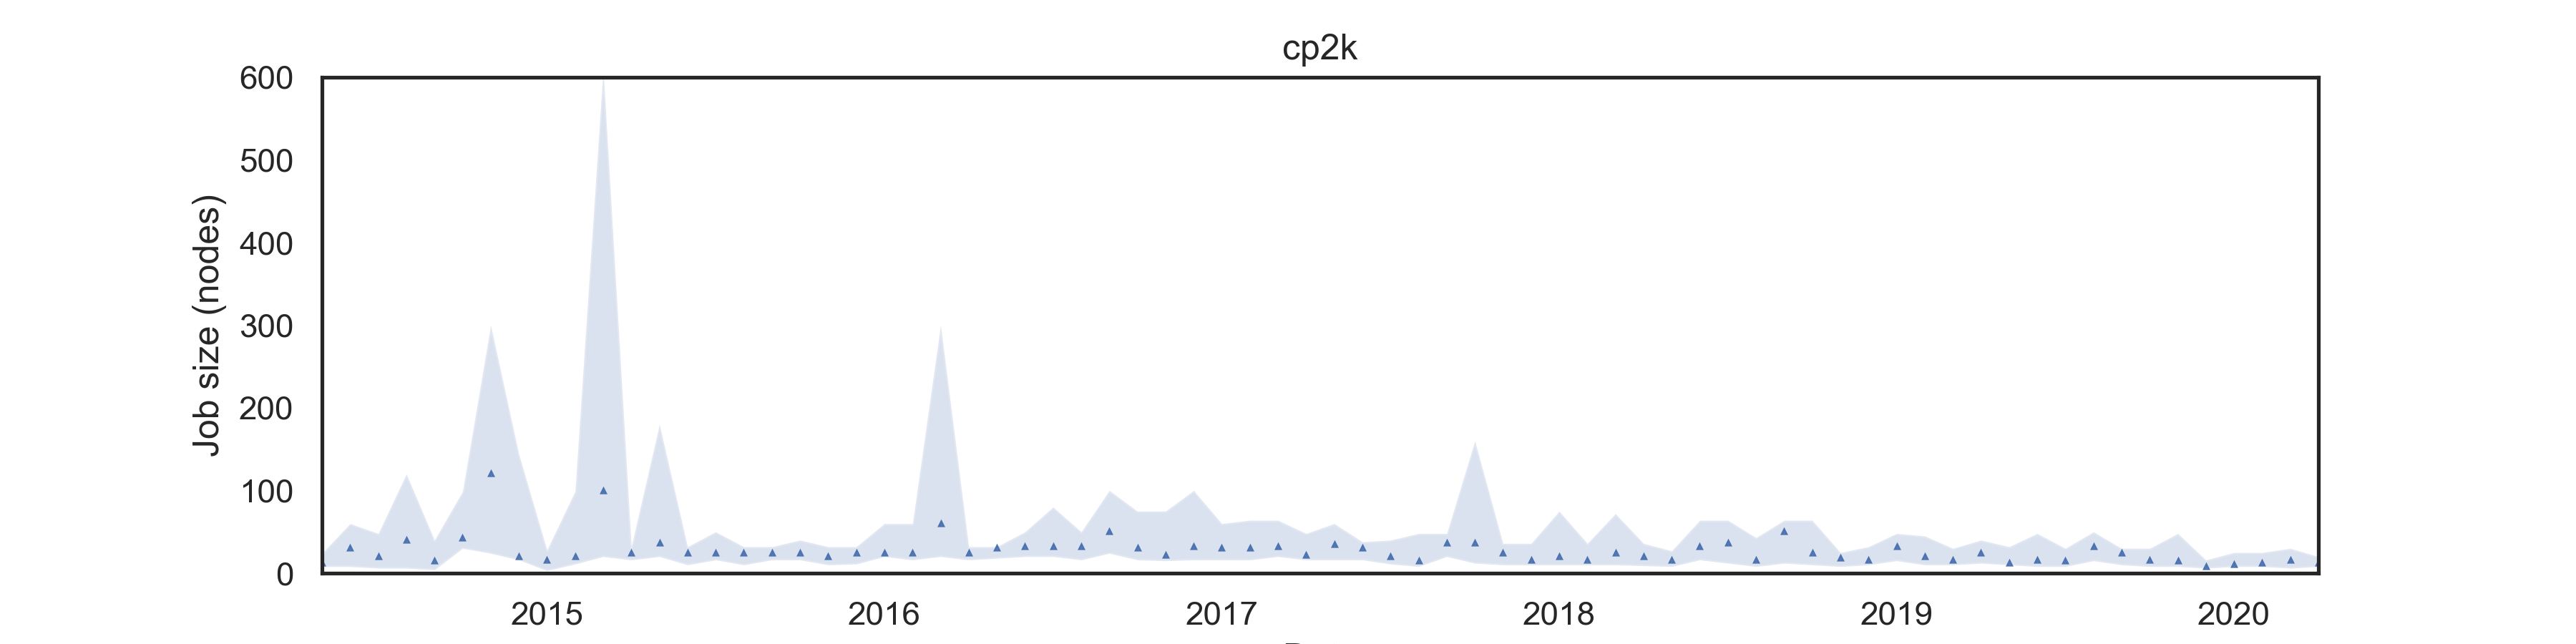
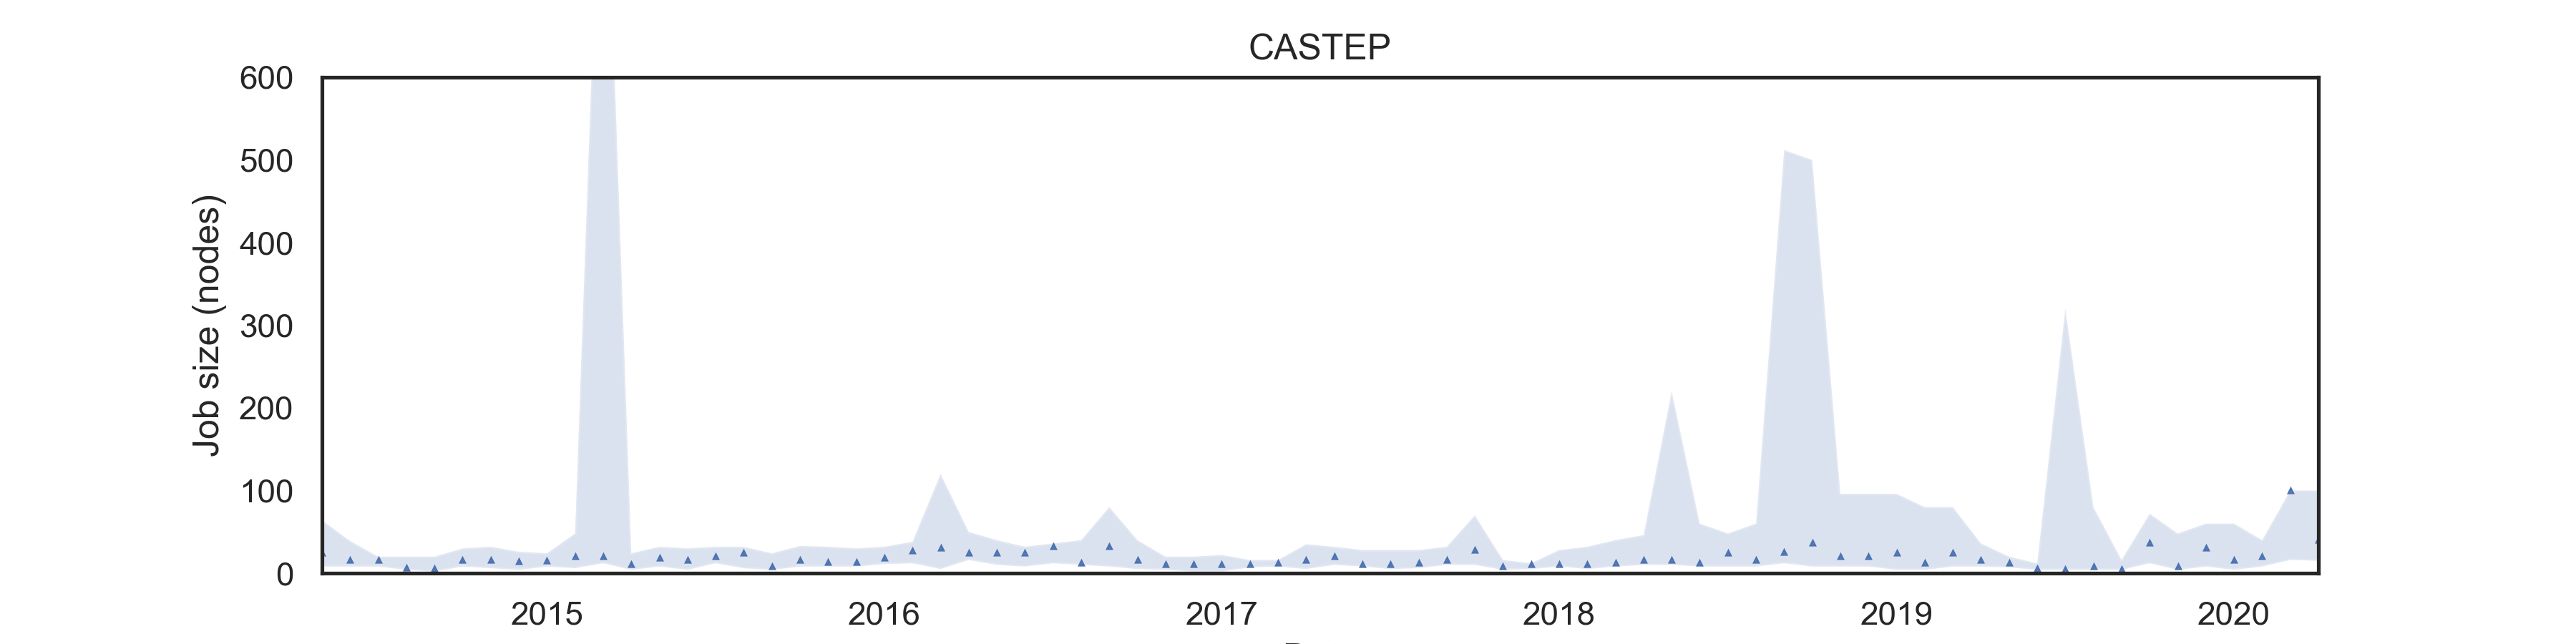
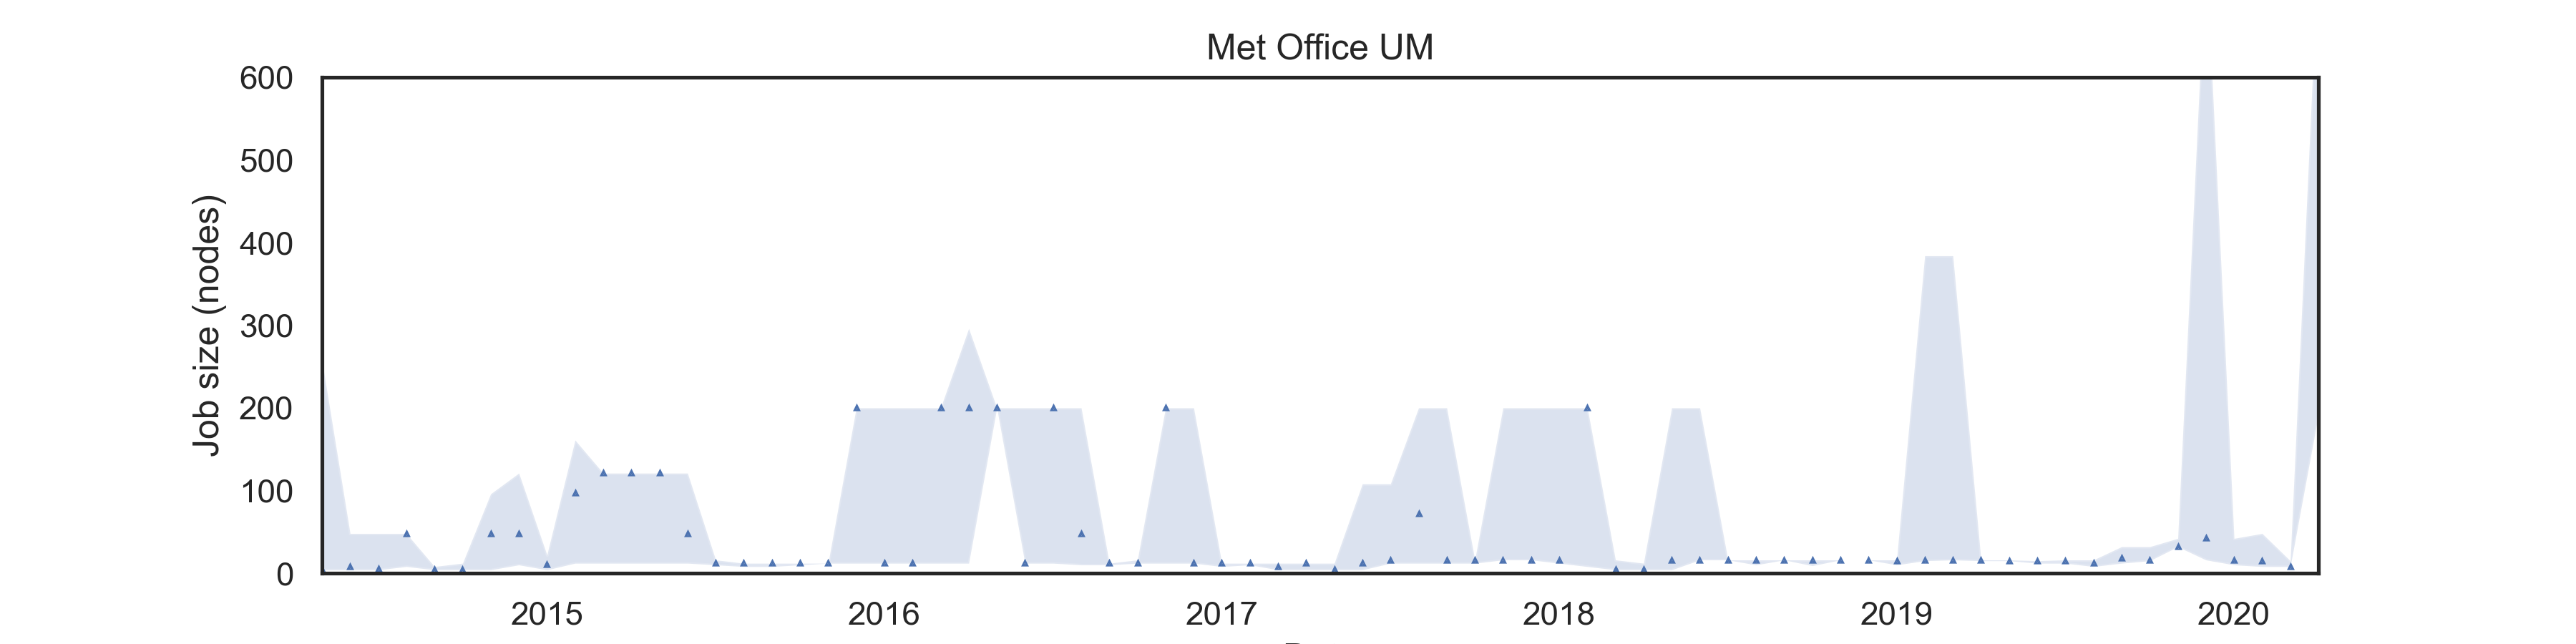
Looking at the overall use, we can see that the IQR generally spans the 1-100 node range with the median job size less than 50 nodes. Most of the top 5 research software applications have job sizes that are smaller than the overall use statistics although the UK Met Office Unified Model use does show use periods where the median job size is up at 200 nodes.
This is just an initial look at the usage data from ARCHER. We have made the monthly research software usage data available via links below for anyone who wants to use it to perform their own analysis. Once we have combined this data with the research software usage data from SAFE into a coherent dataset we will release a copy of the data with a DOI attached to allow for better use and citation going forwards. This will be the subject of a future blog article.