
- Current System Load - CPU, GPU
- Service Alerts
- Maintenance Sessions
- Previous Service Alerts
- System Status Mailings
- FAQ
- Usage statistics
Current System Load - CPU
The plot below shows the status of nodes on the current ARCHER2 Full System service. A description of each of the status types is provided below the plot.

- alloc: Nodes running user jobs
- idle: Nodes available for user jobs
- resv: Nodes in reservation and not available for standard user jobs
- plnd: Nodes are planned to be used for a future jobs. If pending jobs can fit in the space before the future job is due to start they can run on these nodes (often referred to as backfilling).
- down, drain, maint, drng, comp, boot: Nodes unavailable for user jobs
- mix: Nodes in multiple states
Note: the long running reservation visible in the plot corresponds to the short QoS which is used to support small, short jobs with fast turnaround time.
Current System Load - GPU

- alloc: Nodes running user jobs
- idle: Nodes available for user jobs
- resv: Nodes in reservation and not available for standard user jobs
- plnd: Nodes are planned to be used for a future jobs. If pending jobs can fit in the space before the future job is due to start they can run on these nodes (often referred to as backfilling).
- down, drain, maint, drng, comp, boot: Nodes unavailable for user jobs
- mix: Nodes in multiple states
Service Alerts
The ARCHER2 documentation also covers some Known Issues which users may encounter when using the system.
| Status | Type | Start | End | Scope | User Impact | Reason |
|---|---|---|---|---|---|---|
| Planned | Service Alert | 2026-07-02 08:00 | 2026-07-31 18:00 | Compute nodes | Possibility of intermittently longer queue times and reduced node availability | We are taking action to improve the resilience of our cooling infrastructure in hot weather. This will mean fewer episodes of reduced compute capacity in future, but while the work is ongoing it is possible that we may need to take nodes out of service at short notice, which will increase queue times. We apologise for any inconvenience. |
| Ongoing | Service Alert | 2026-06-16 15:00 | File systems | We are seeing some slow responses from the filesystems. | The HPE team are investigating as a high priority. We will provide further information as it becomes available. |
Maintenance Sessions
This section lists recent and upcoming maintenance sessions. A full list of past maintenance sessions is available.
No scheduled or recent maintenance sessions
Previous Service Alerts
This section lists the five most recent resolved service alerts from the past 30 days. A full list of historical resolved service alerts is available.
| Status | Type | Start | End | Scope | User Impact | Reason |
|---|---|---|---|---|---|---|
| Resolved | Service Alert | 2026-07-20 08:30 | 2026-07-21 18:00 | Connectivity to service |
Update 2026-07-20 13:30: Login access restored, further possibility of interruptions to access for further 1.5 days. Unable to remotely access the service for ~0.5 days with risk of issues or interruptions for up to two days. Scheduled work will continue to run throughout, though there may be issues with workflows that require access external to the service. |
Upgrade of ACF firewalls and core network |
| Resolved | Service Alert | 2026-07-14 07:00 | 2026-07-14 08:00 | Connectivity to service | Unable to remotely access the service for ~1hr. Scheduled work will continue to run throughout, though there may be issues with workflows that require access external to the service. | Essential upgrade work to main router at the ACF |
| Resolved | Service Alert | 2026-07-10 17:40 | 2026-07-14 14:00 | PUMA | Following the ARCHER2 logins return to service, PUMA remains unavailable. | PUMA unavailable |
| Resolved | Service Alert | 2026-07-09 17:00 | 2026-07-10 17:40 | Login access | Users will not be able to connect to the login nodes or access data. Running and queued jobs will continue to run. | Login access suspended |
| Resolved | Service Alert | 2026-07-08 10:00 | 2026-07-13 10:00 | Compute nodes | Increased queue times and reduced node availability. Low priority jobs may be cancelled if they coincide with temperature spikes. | A number of compute nodes will be removed from service to ensure cooling is adequate as higher temperatures are forecast in the Edinburgh area. The short queue will be maintained as available whenever possible. We apologise for the inconvenience caused by longer queue times. |
System Status mailings
If you would like to receive email notifications about system issues and outages, please subscribe to the System Status Notifications mailing list via SAFE
FAQ
Usage statistics
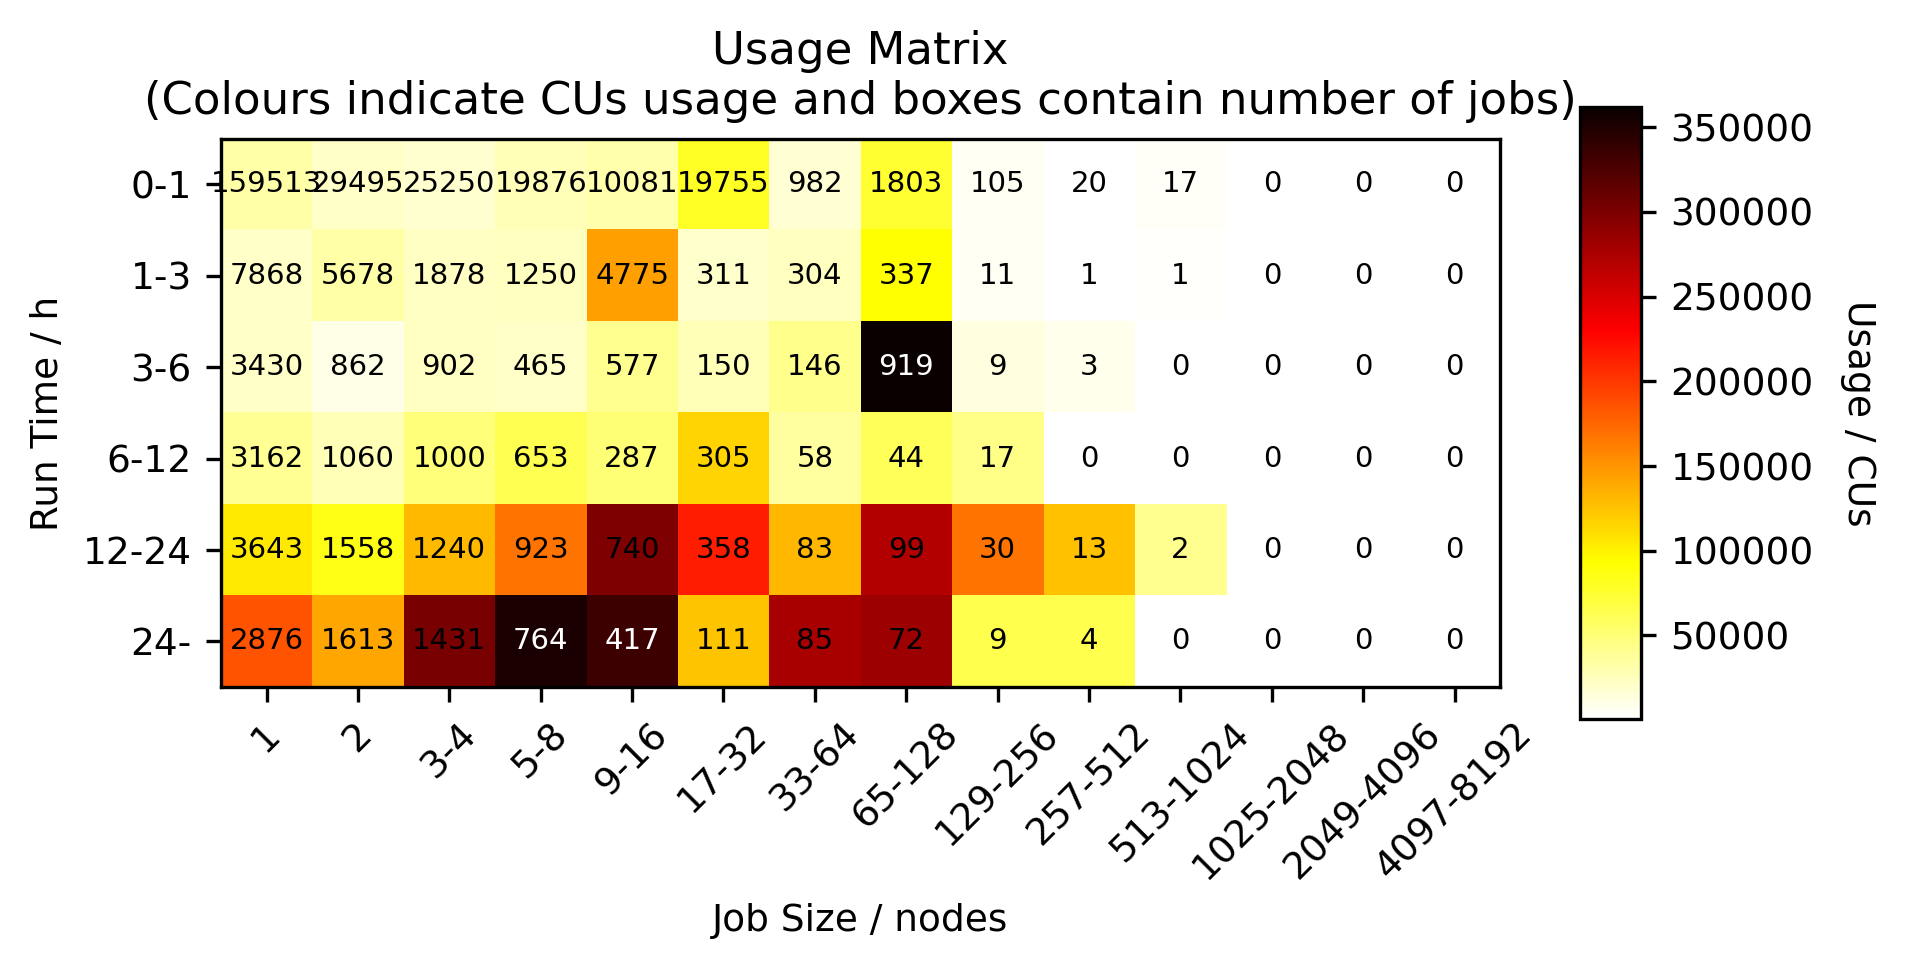
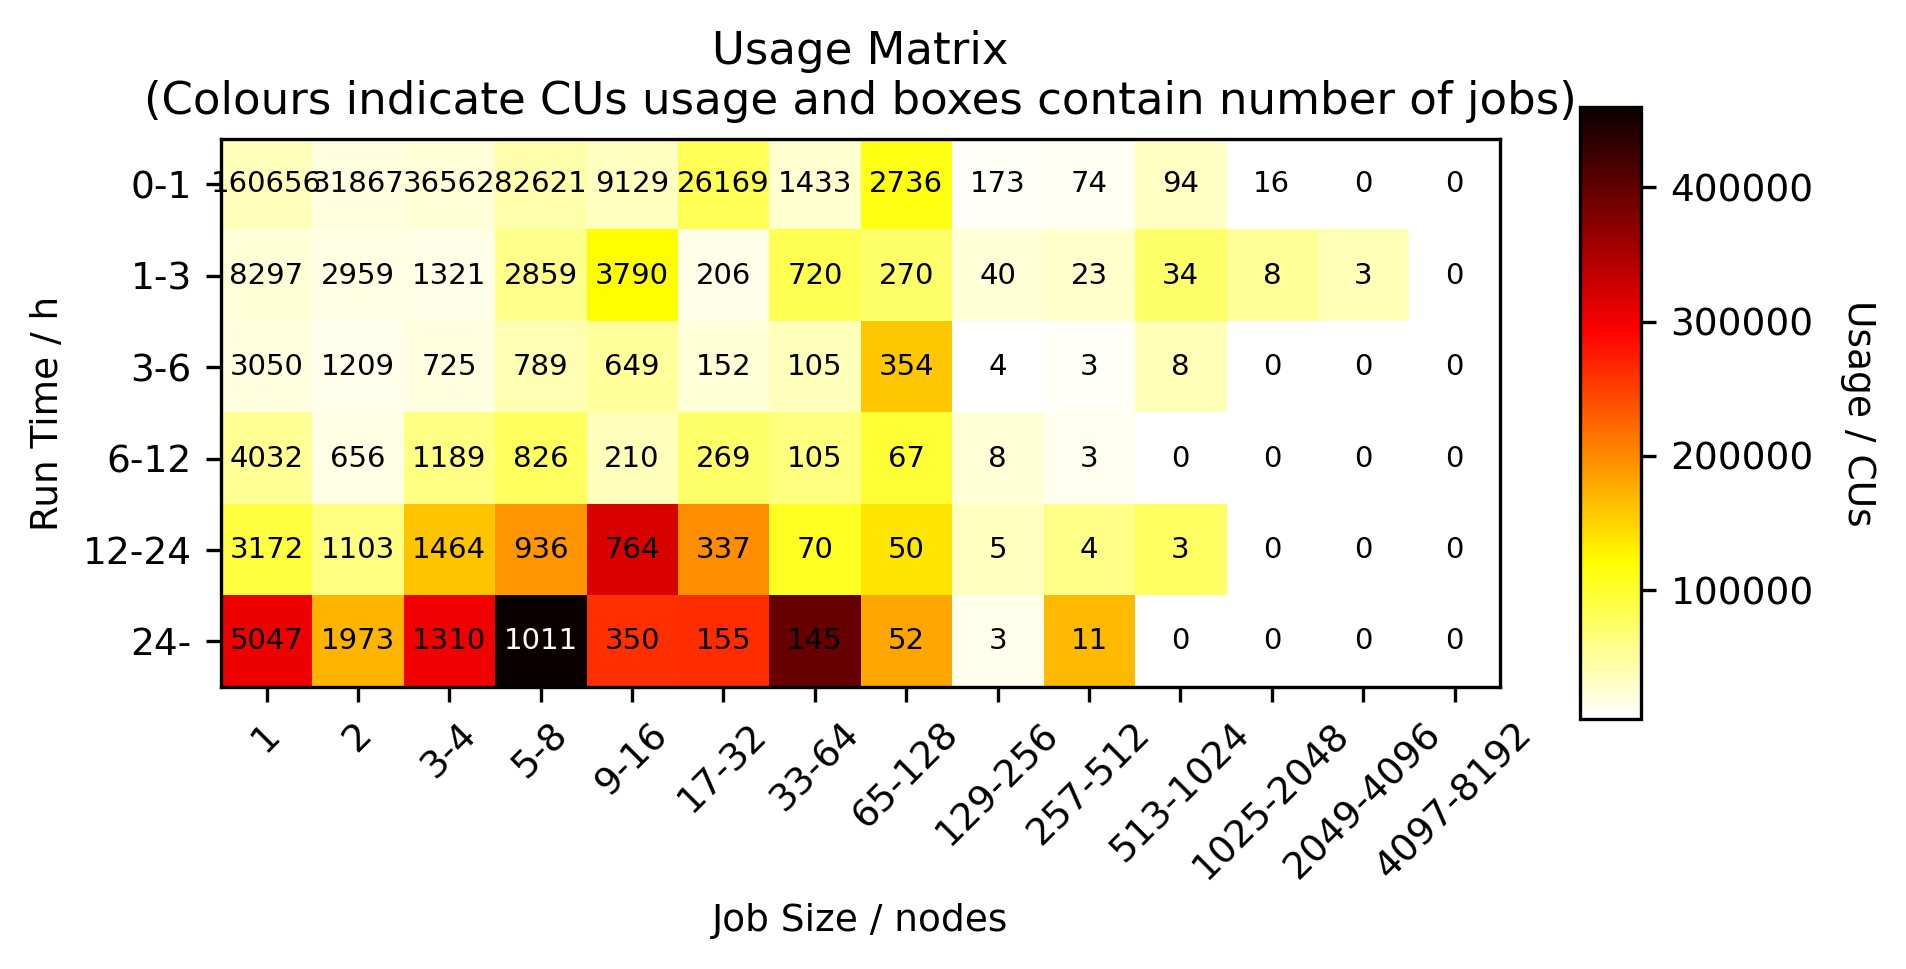
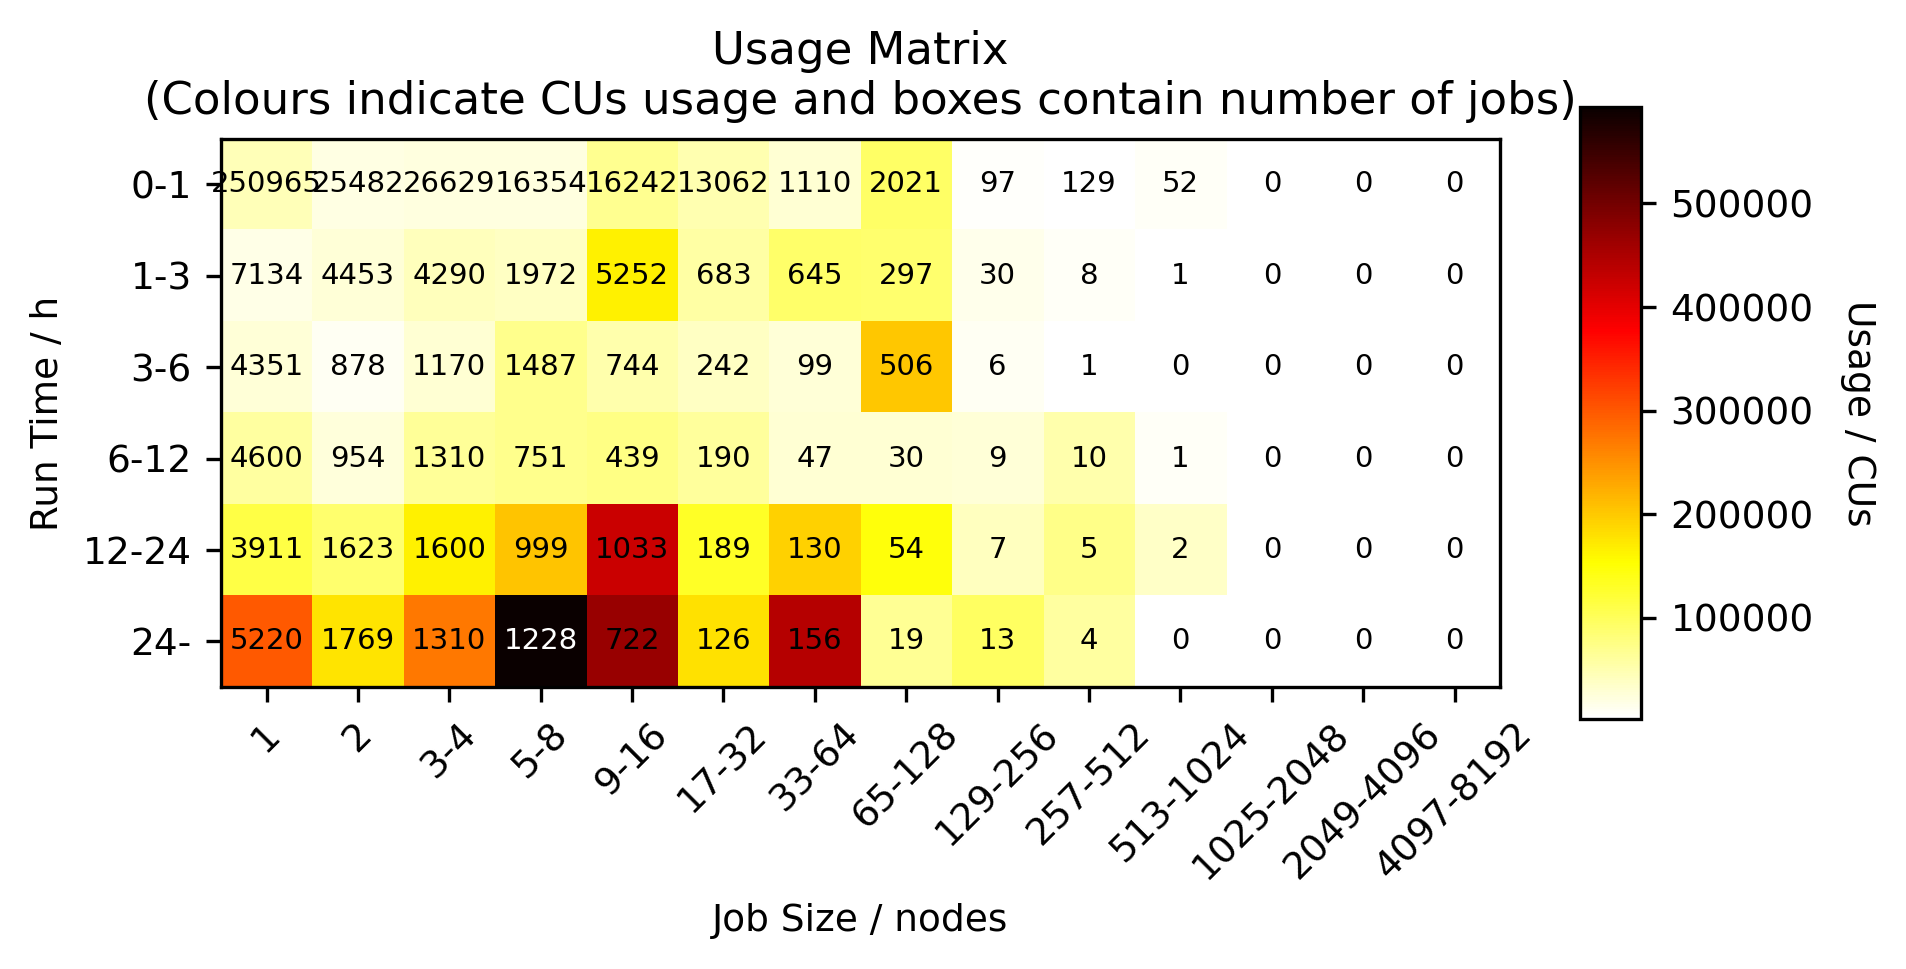
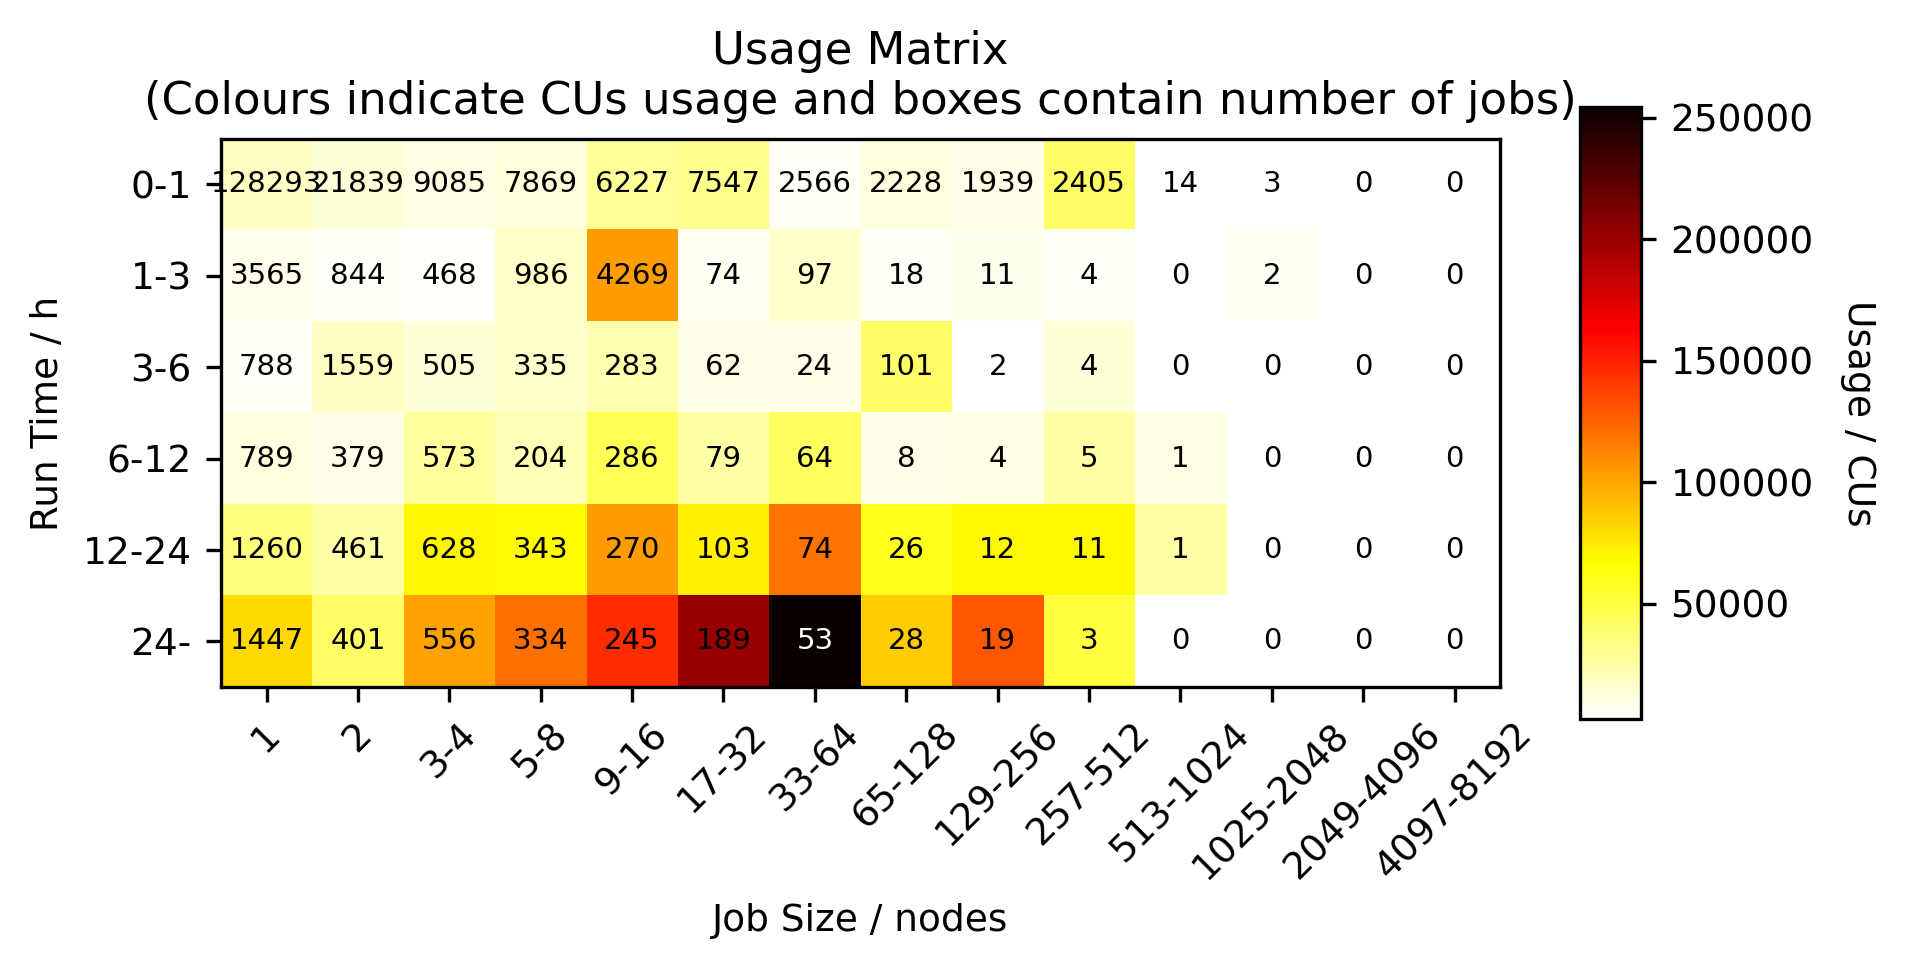
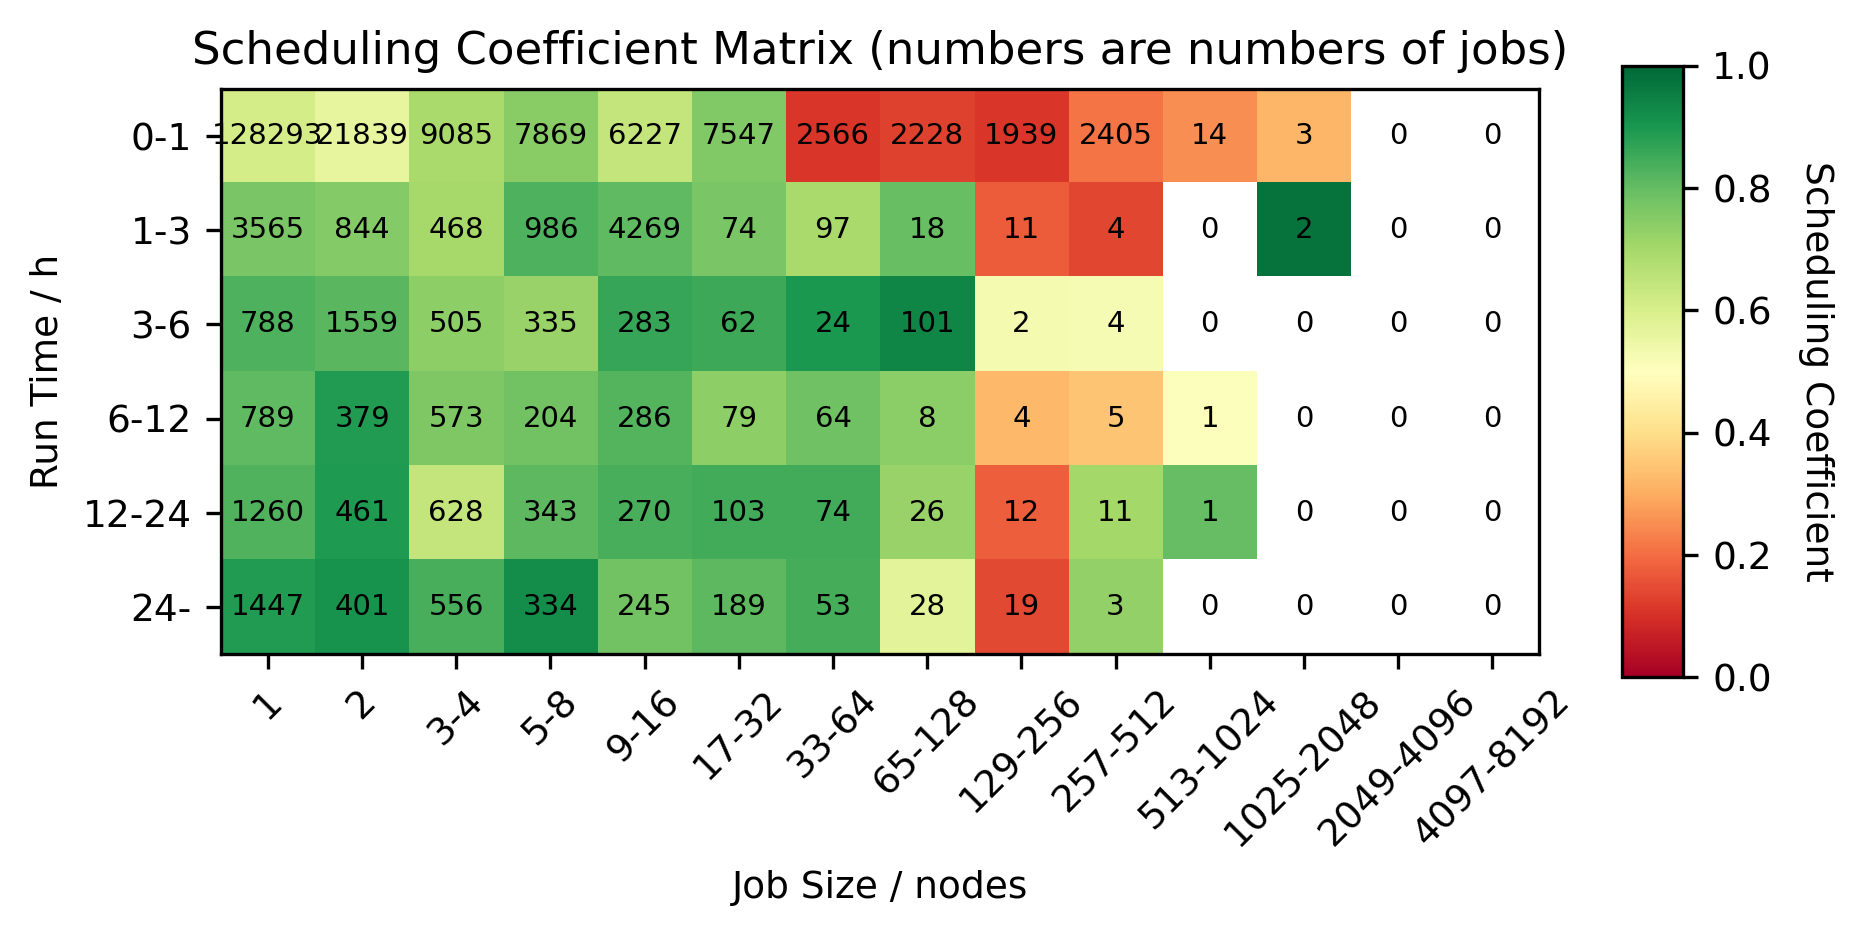
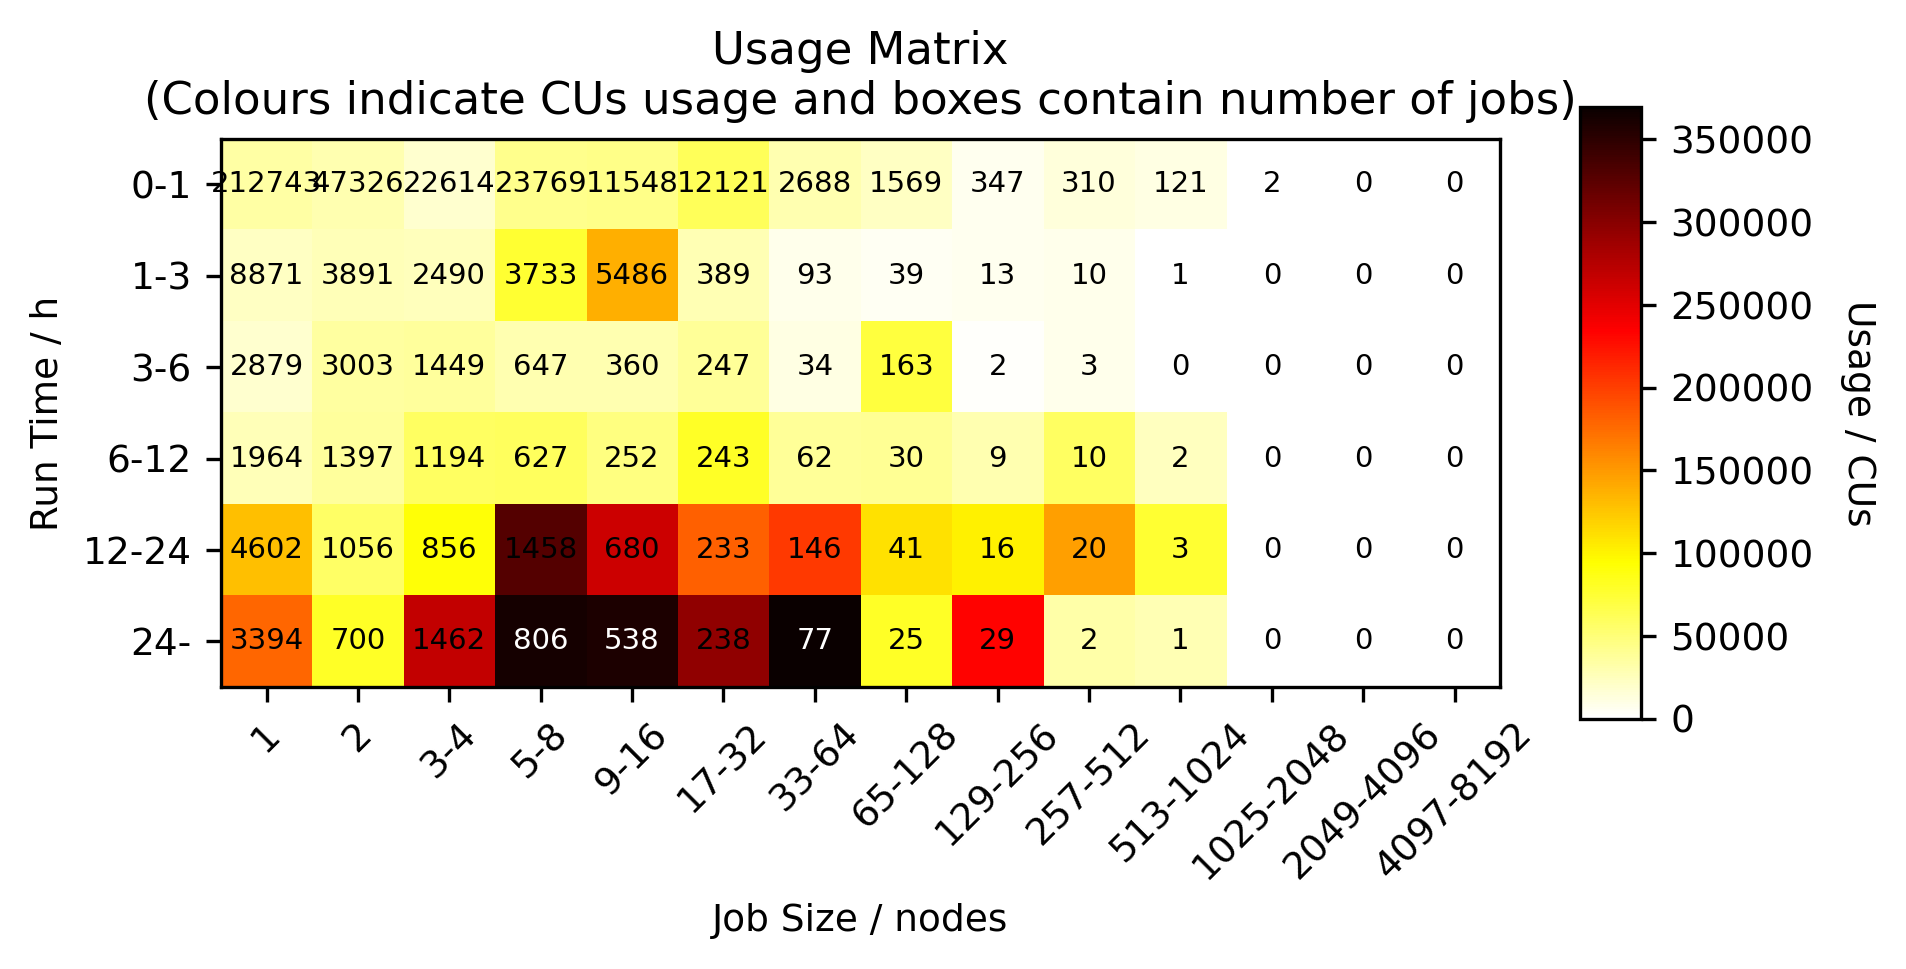
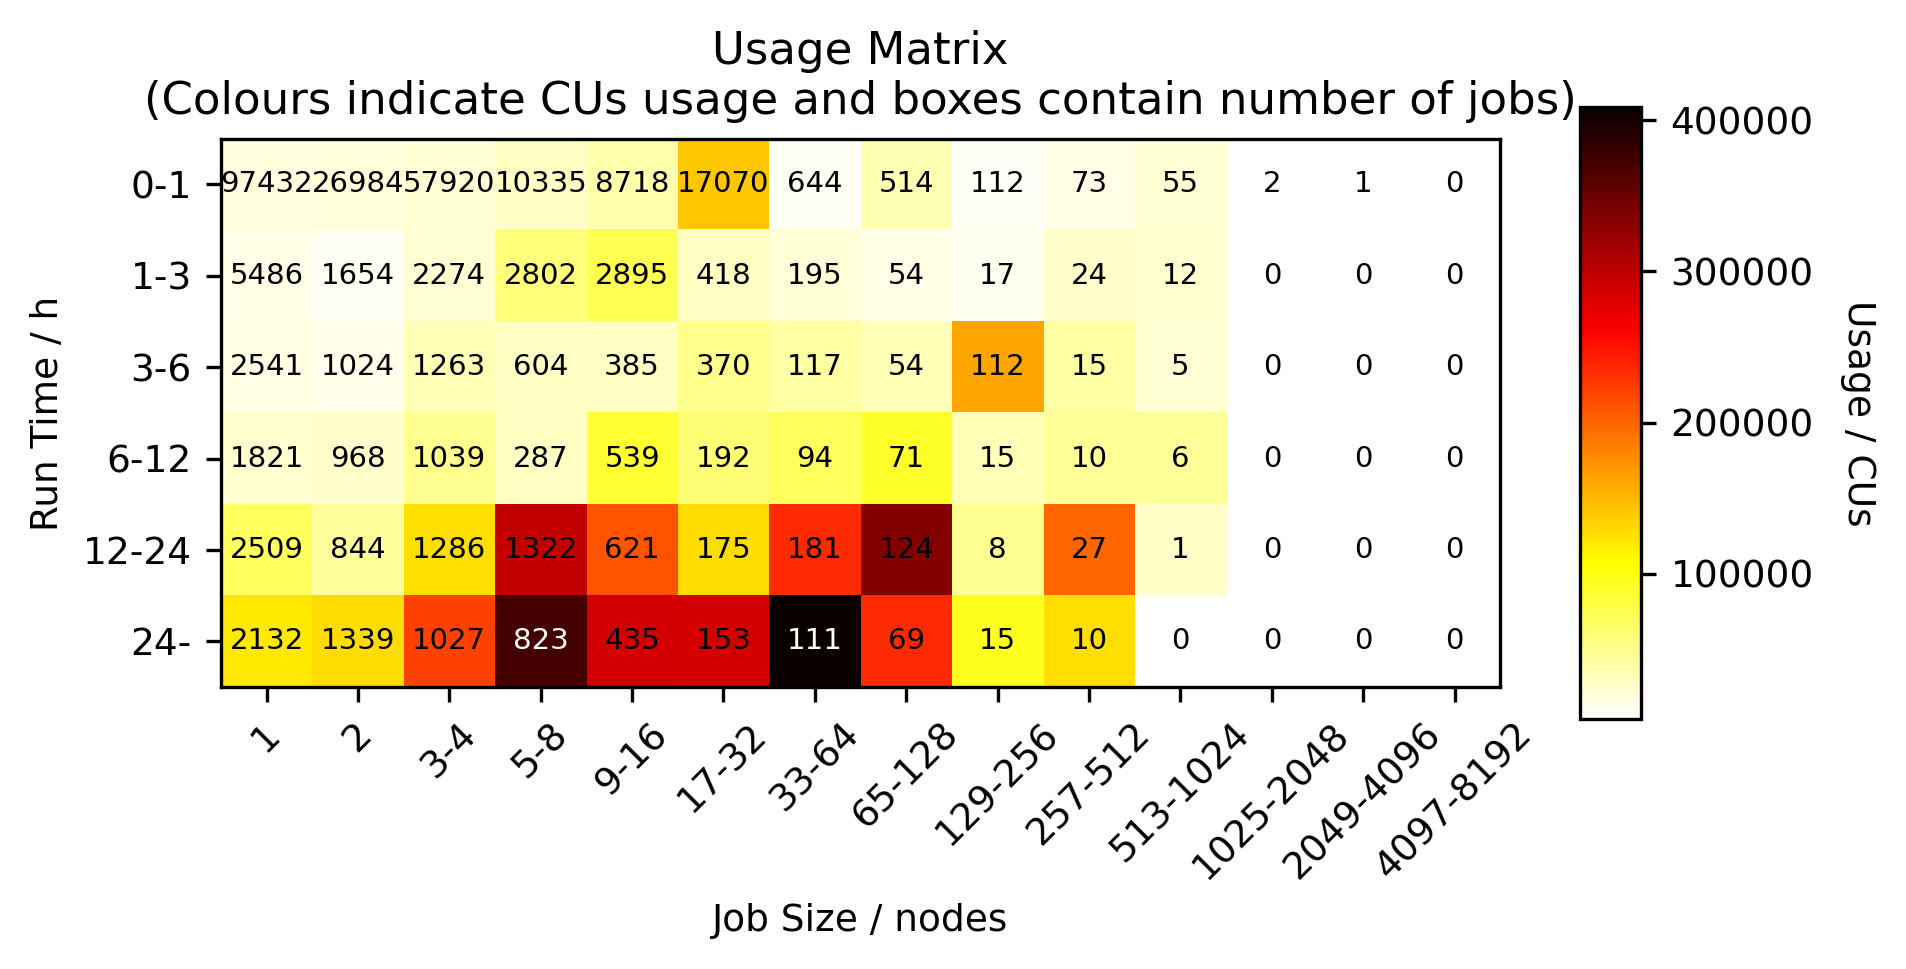
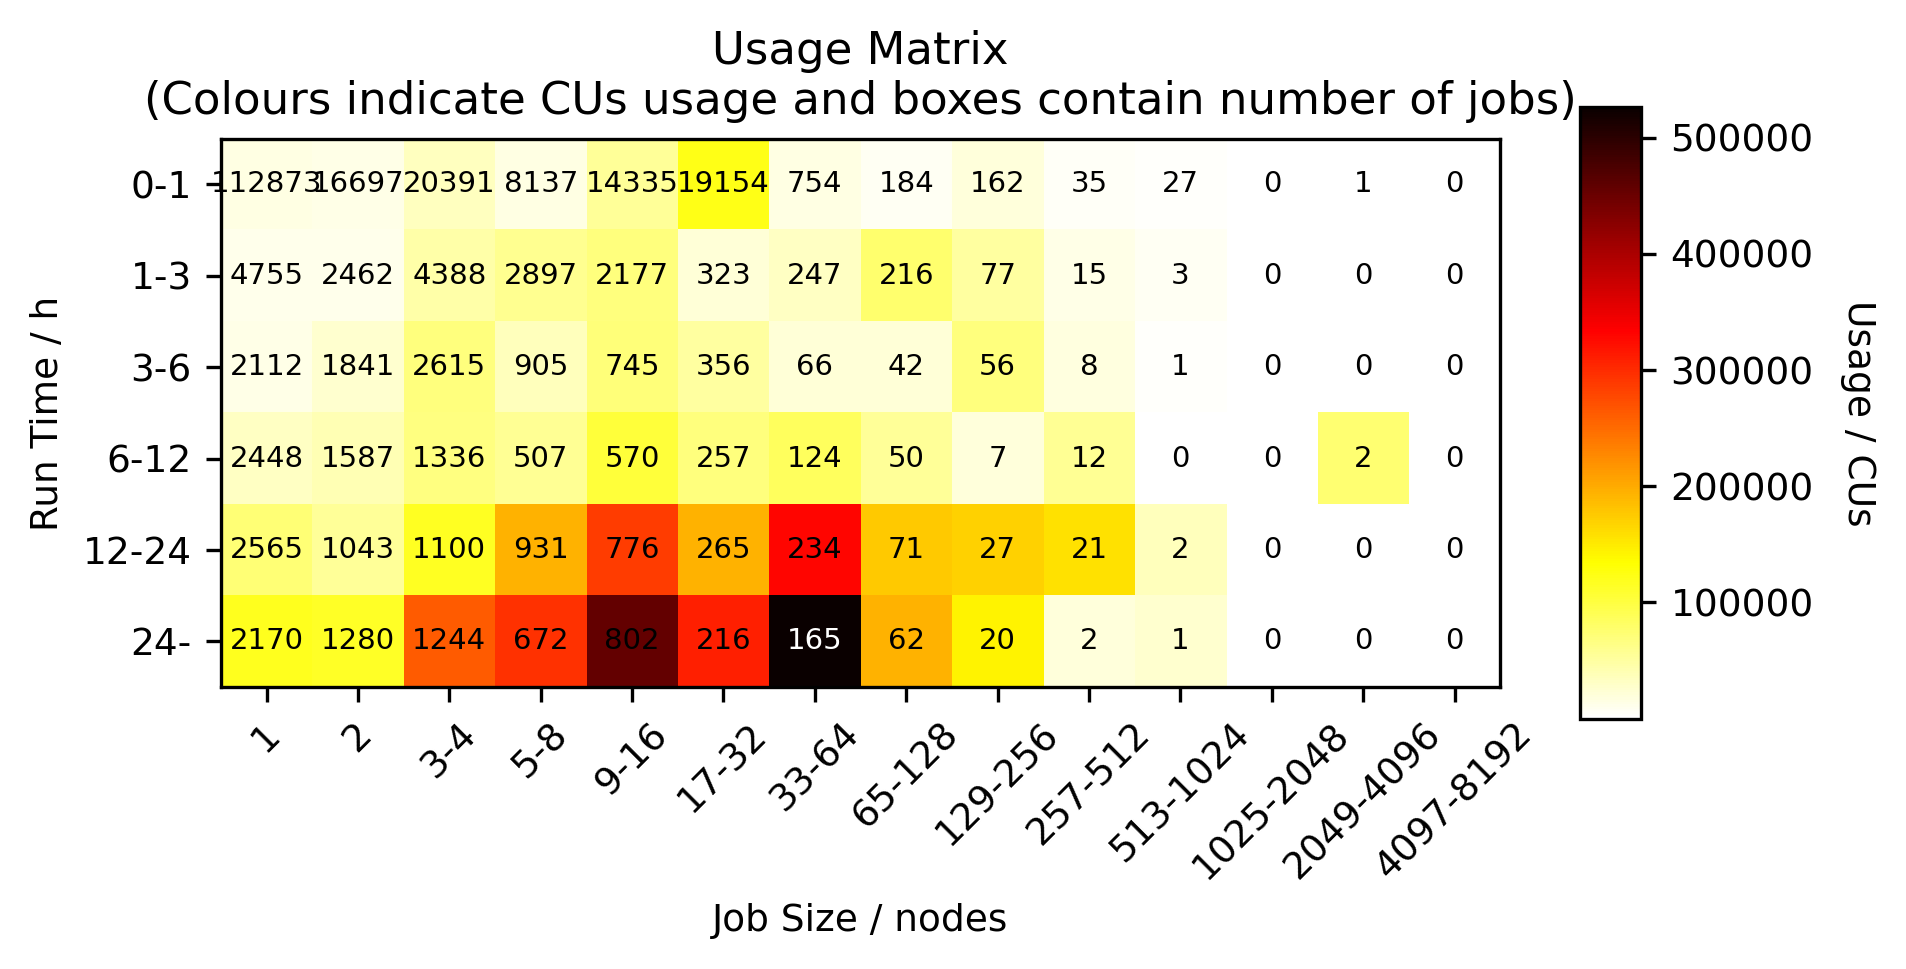
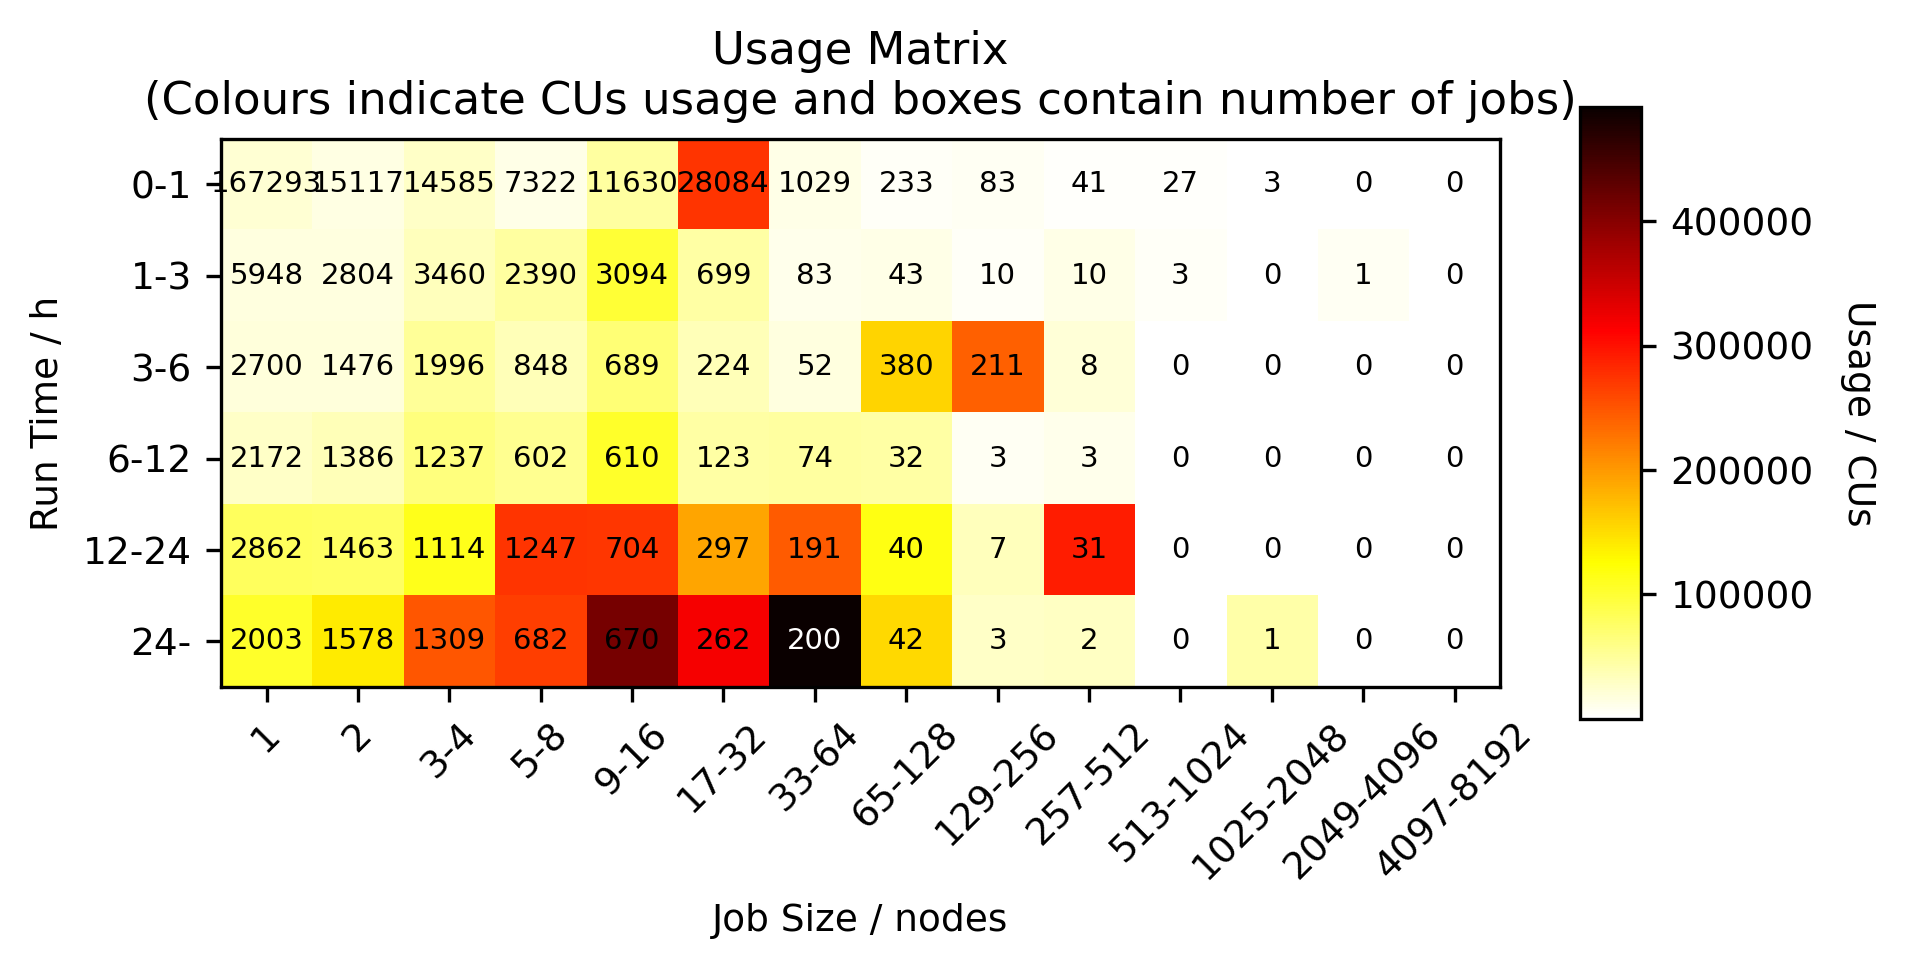
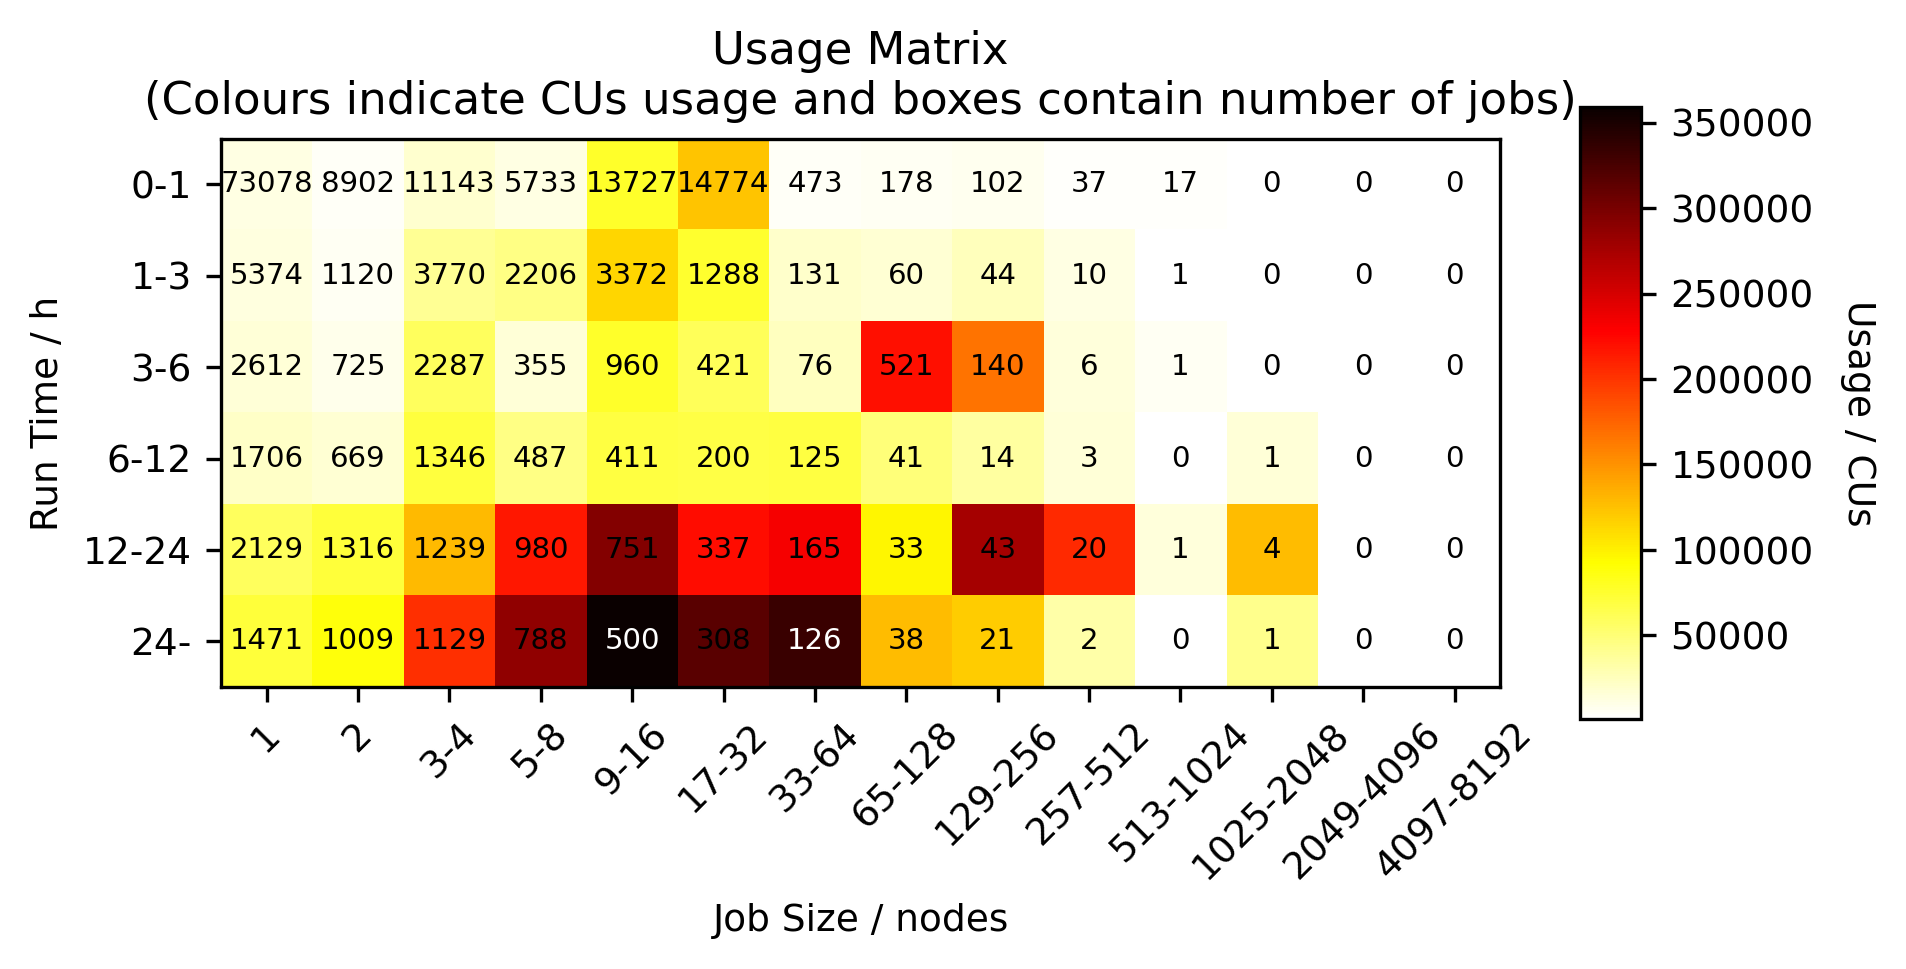
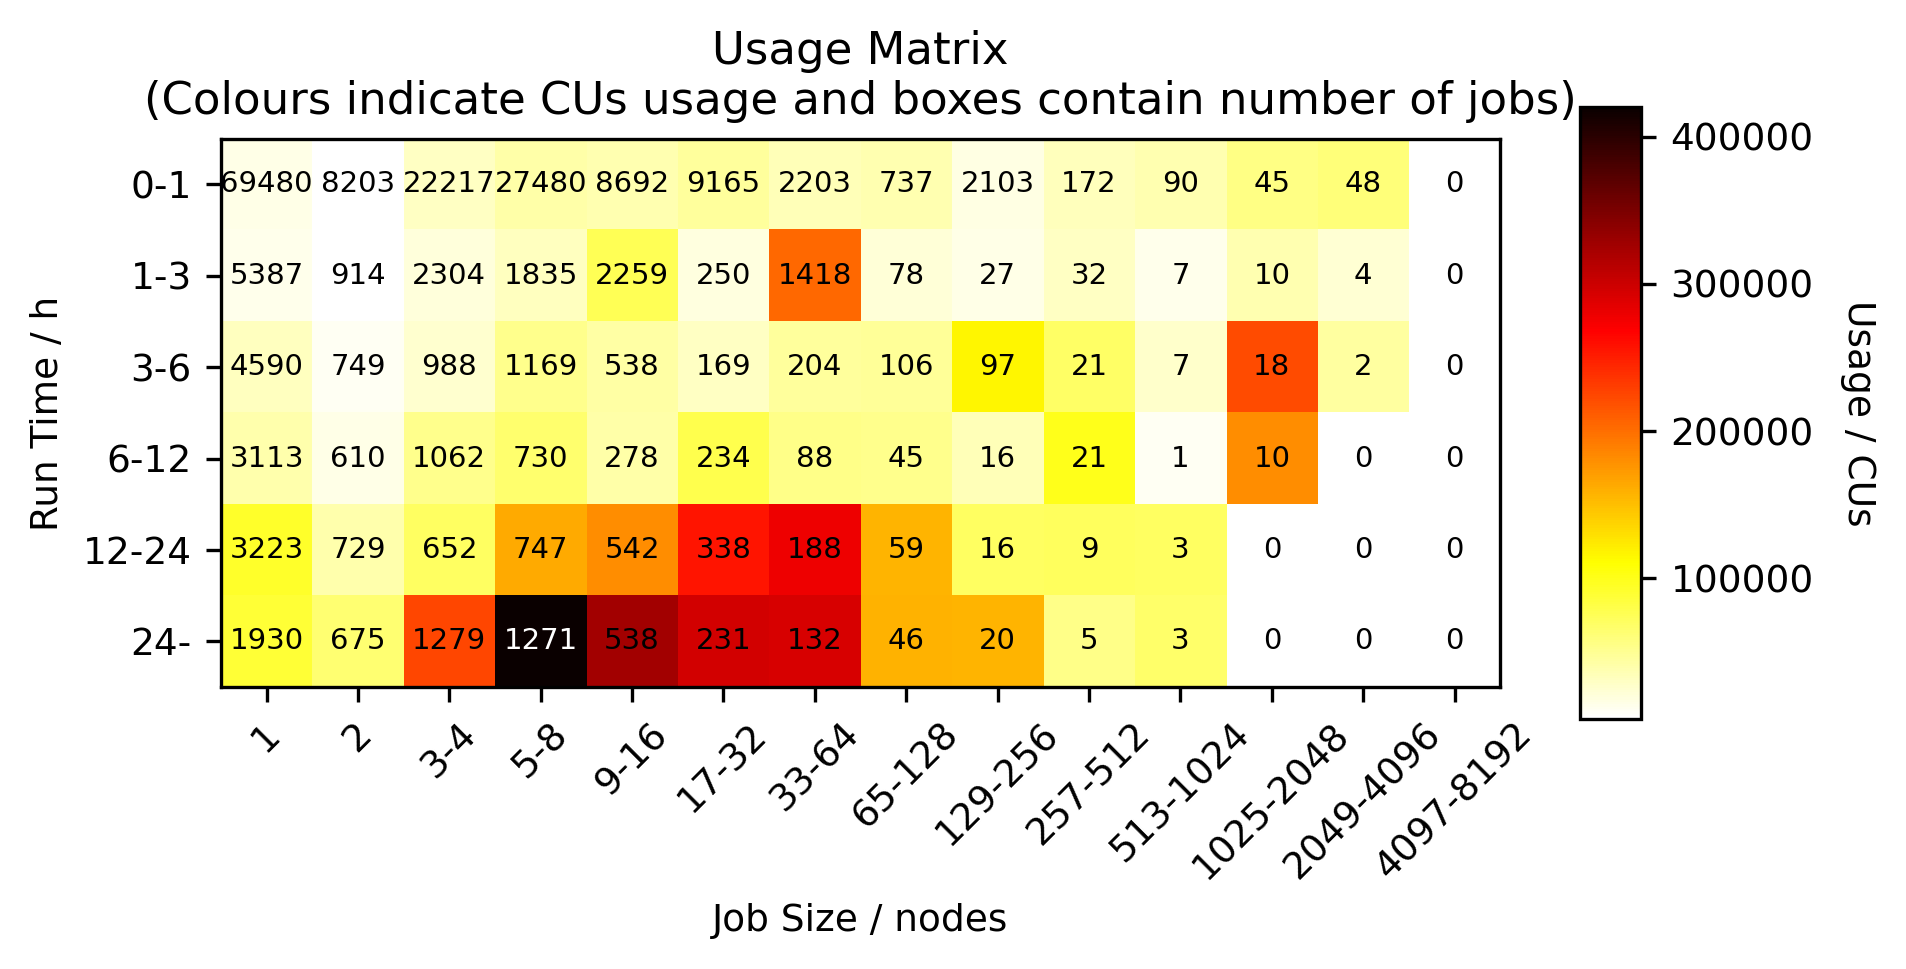
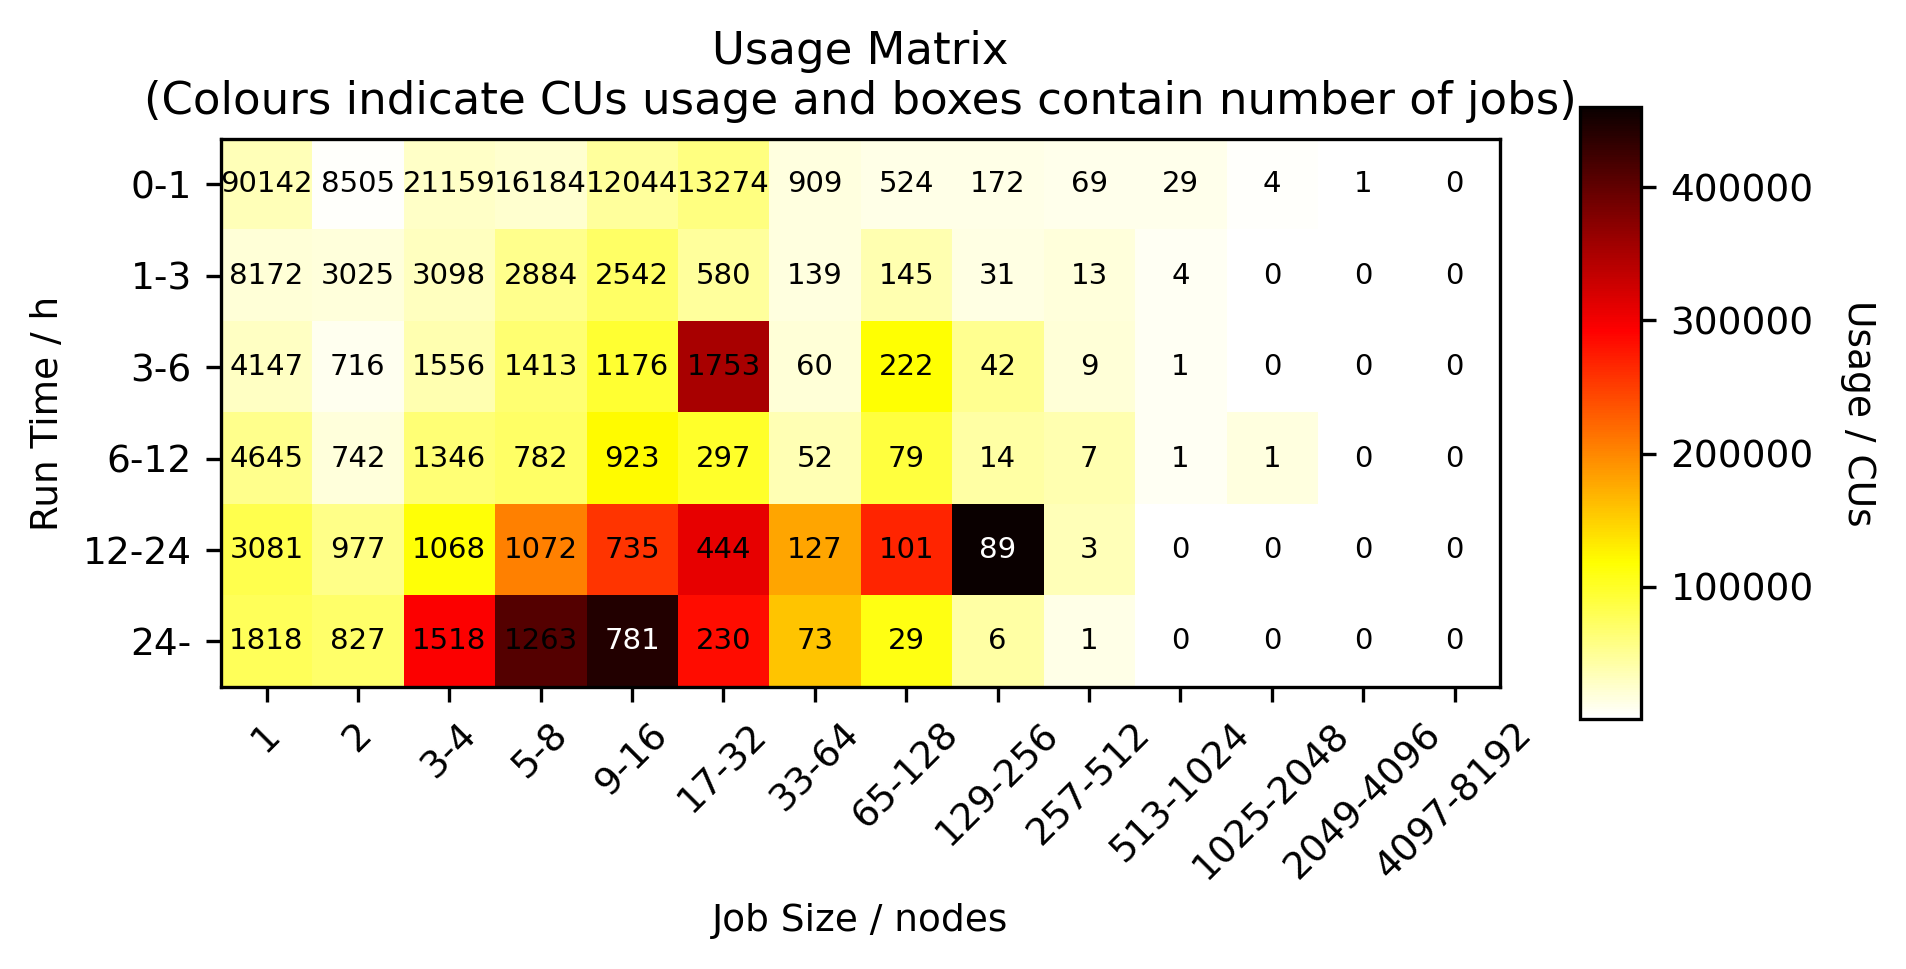
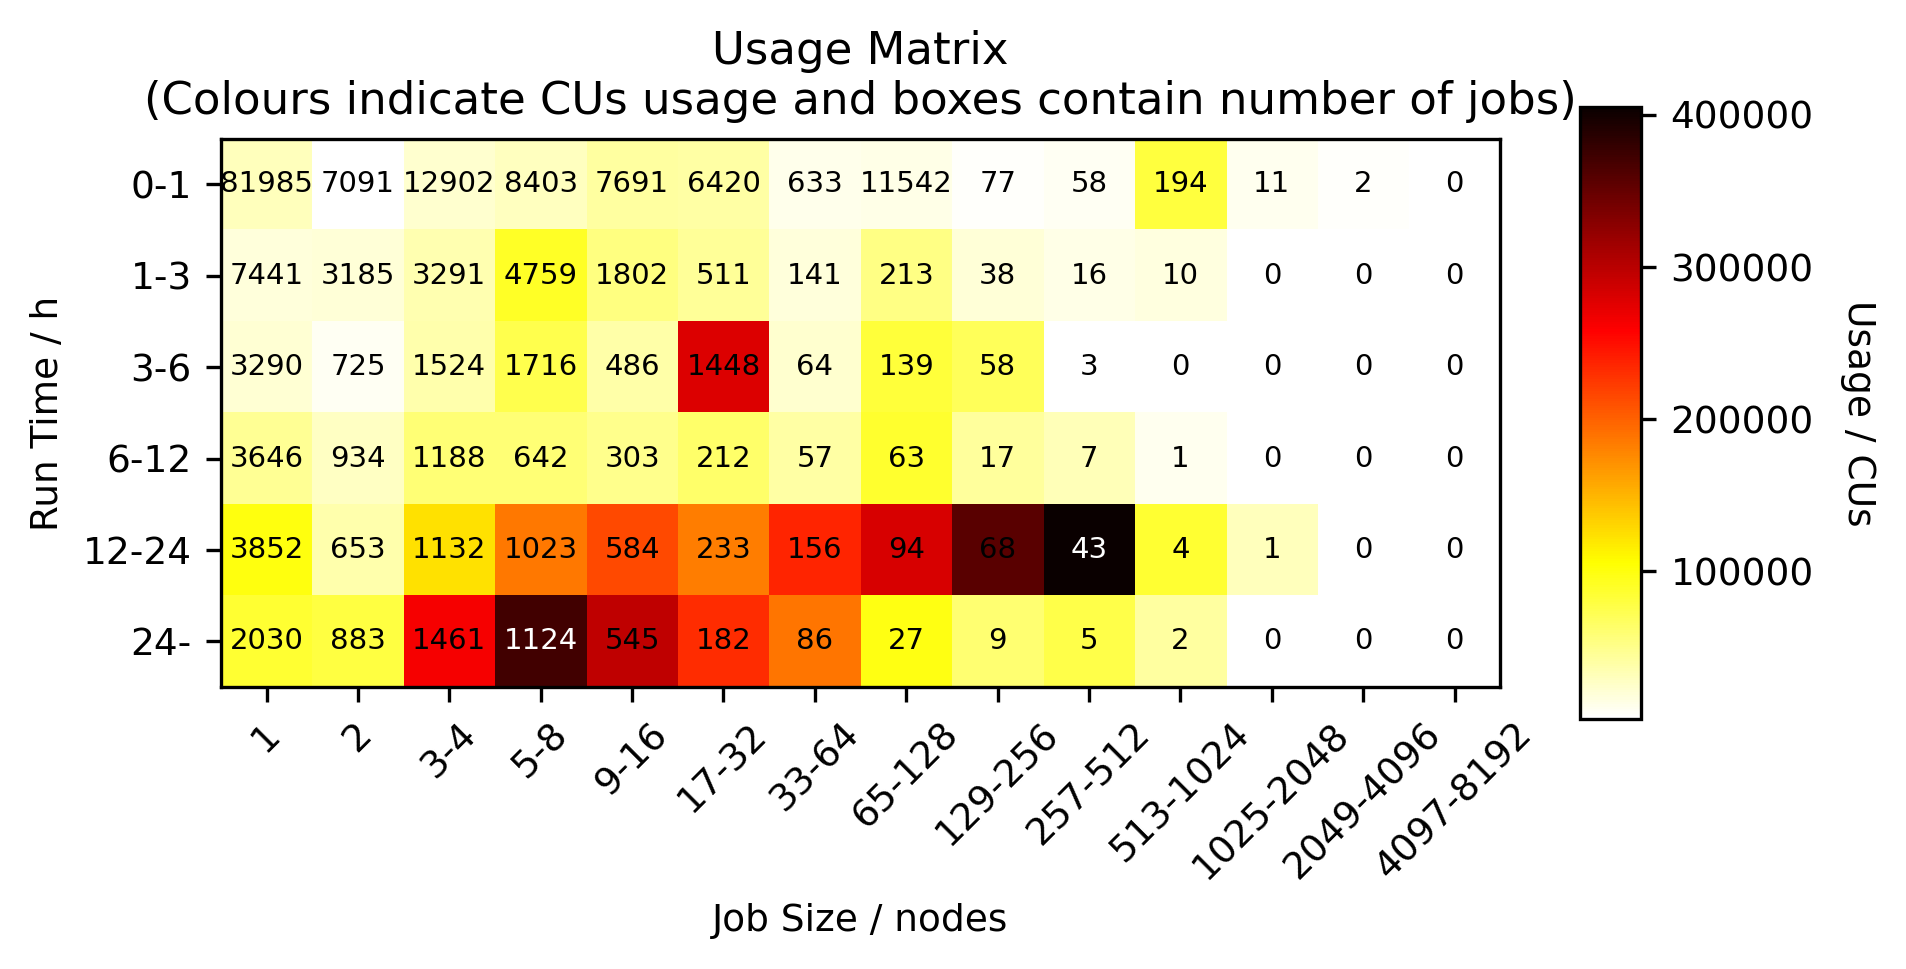
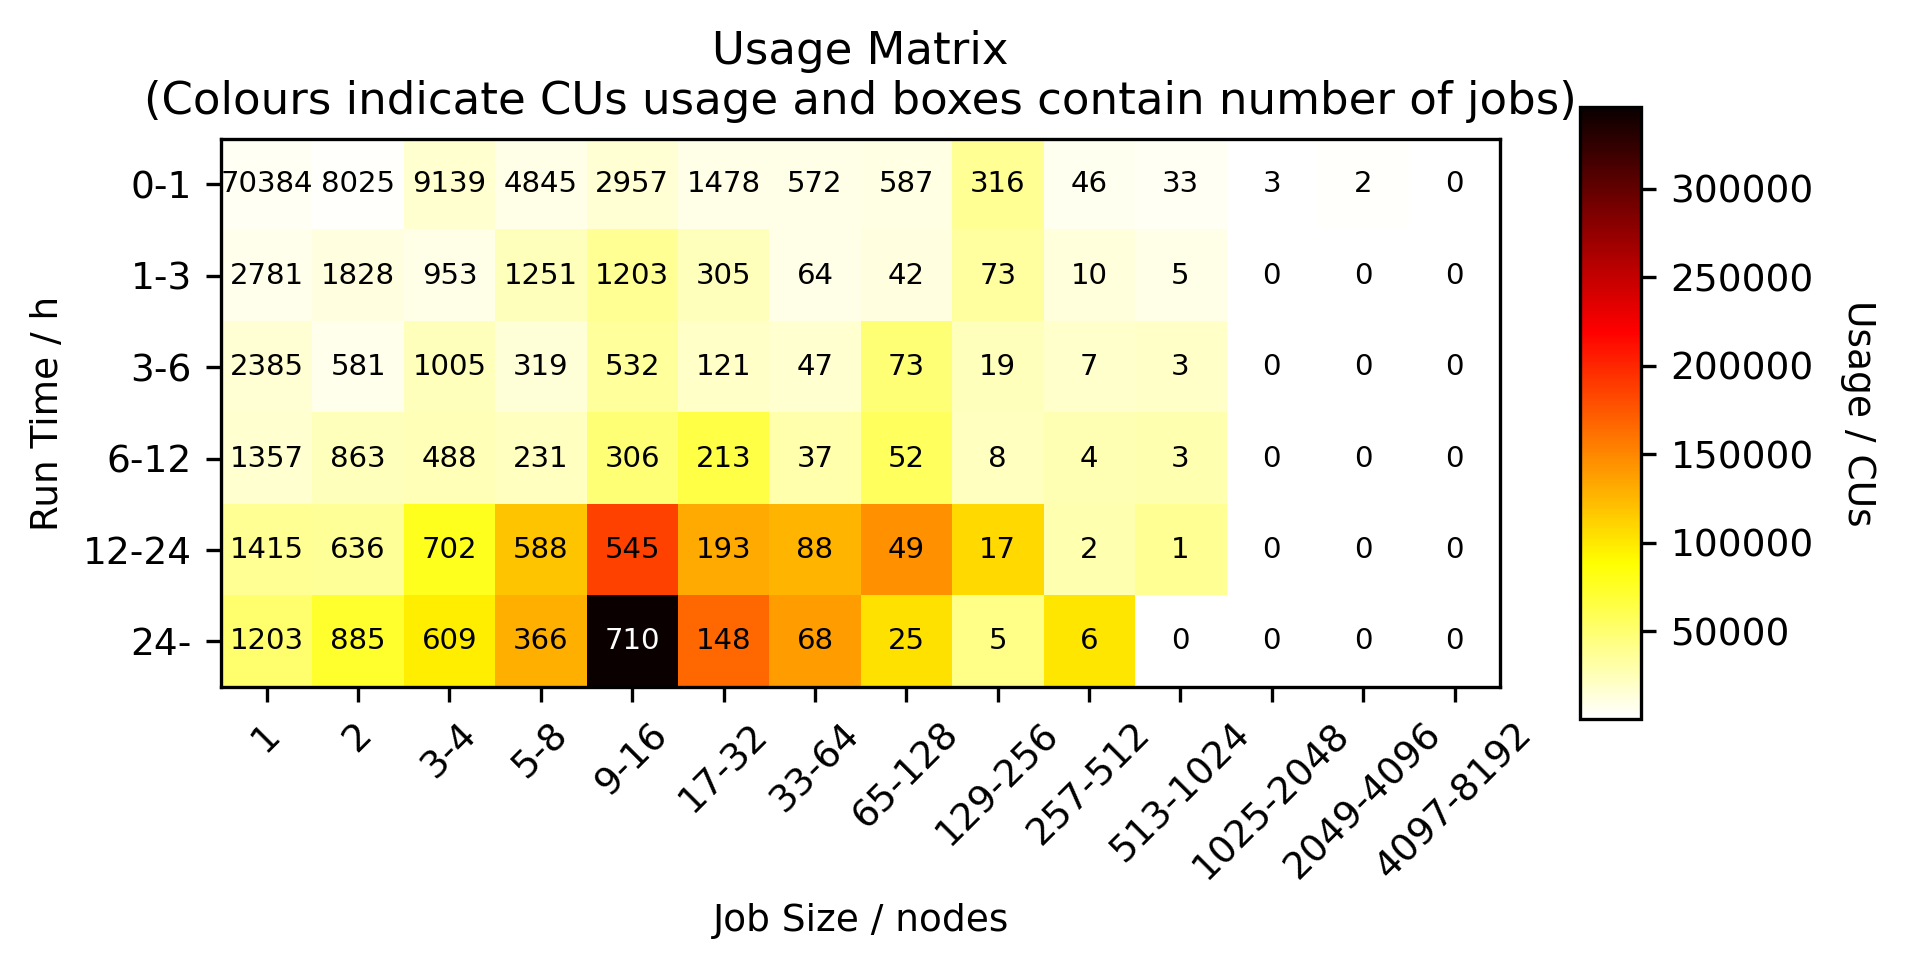
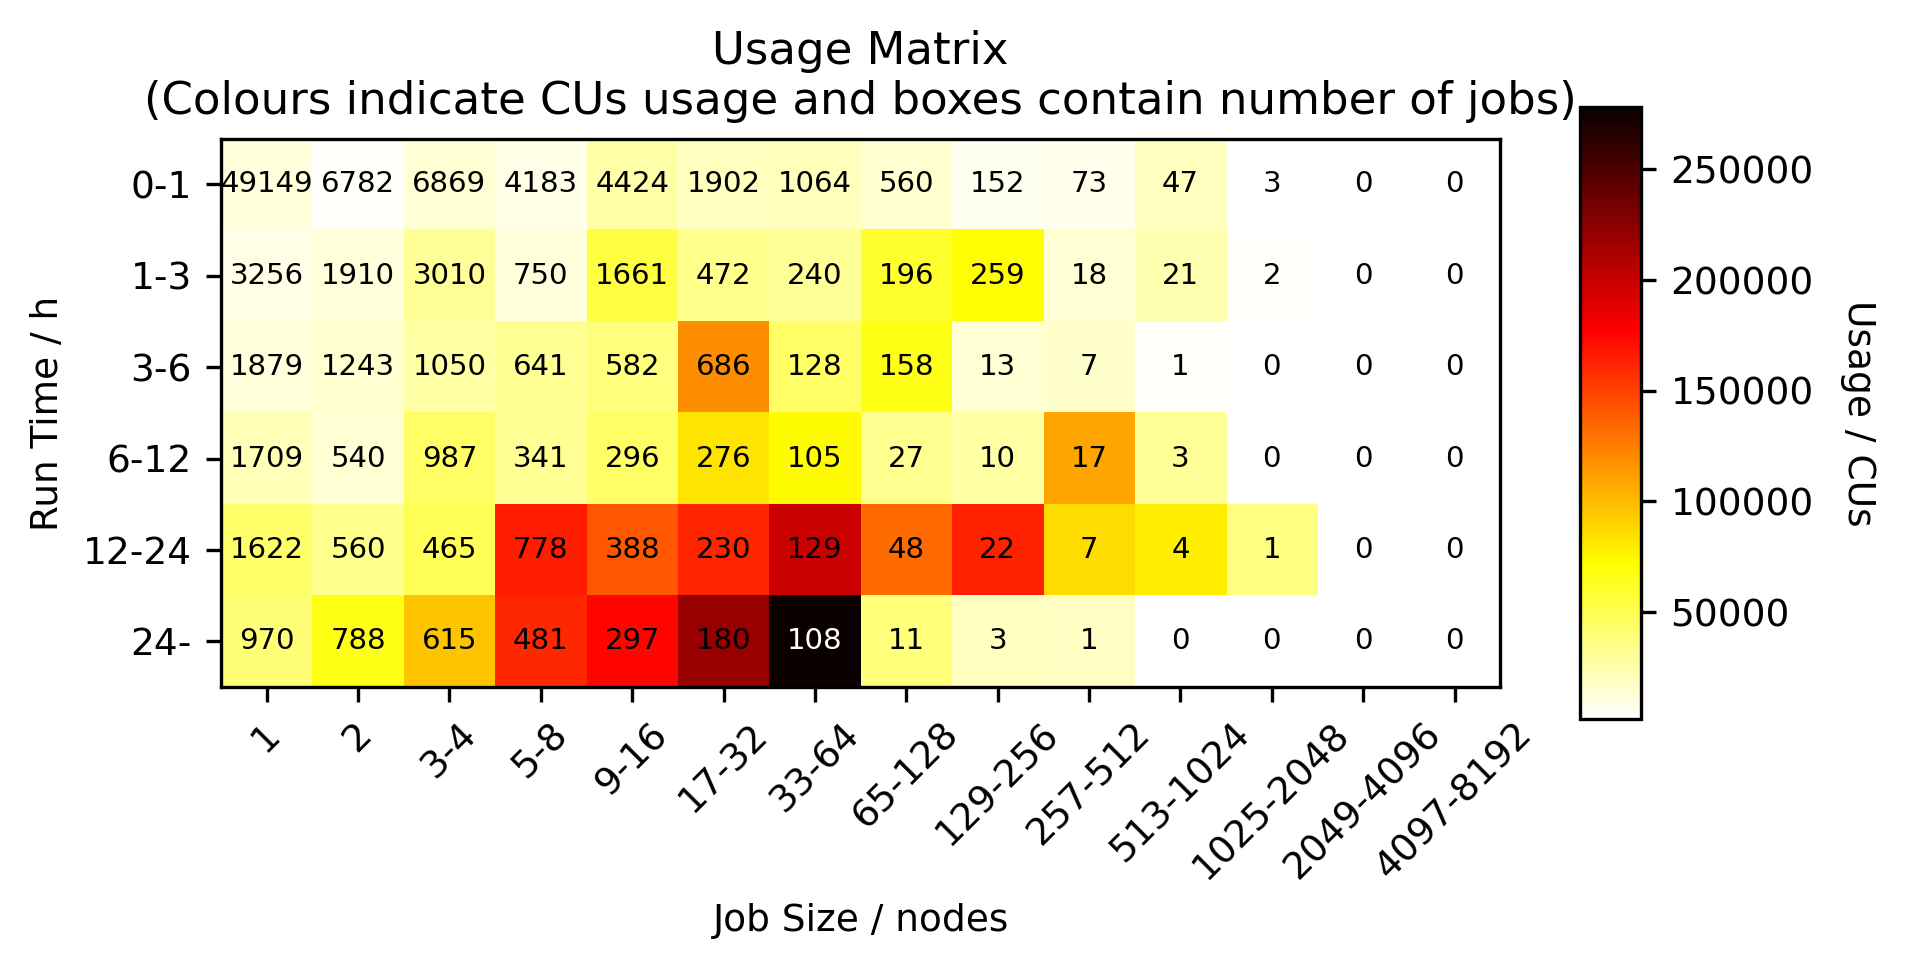
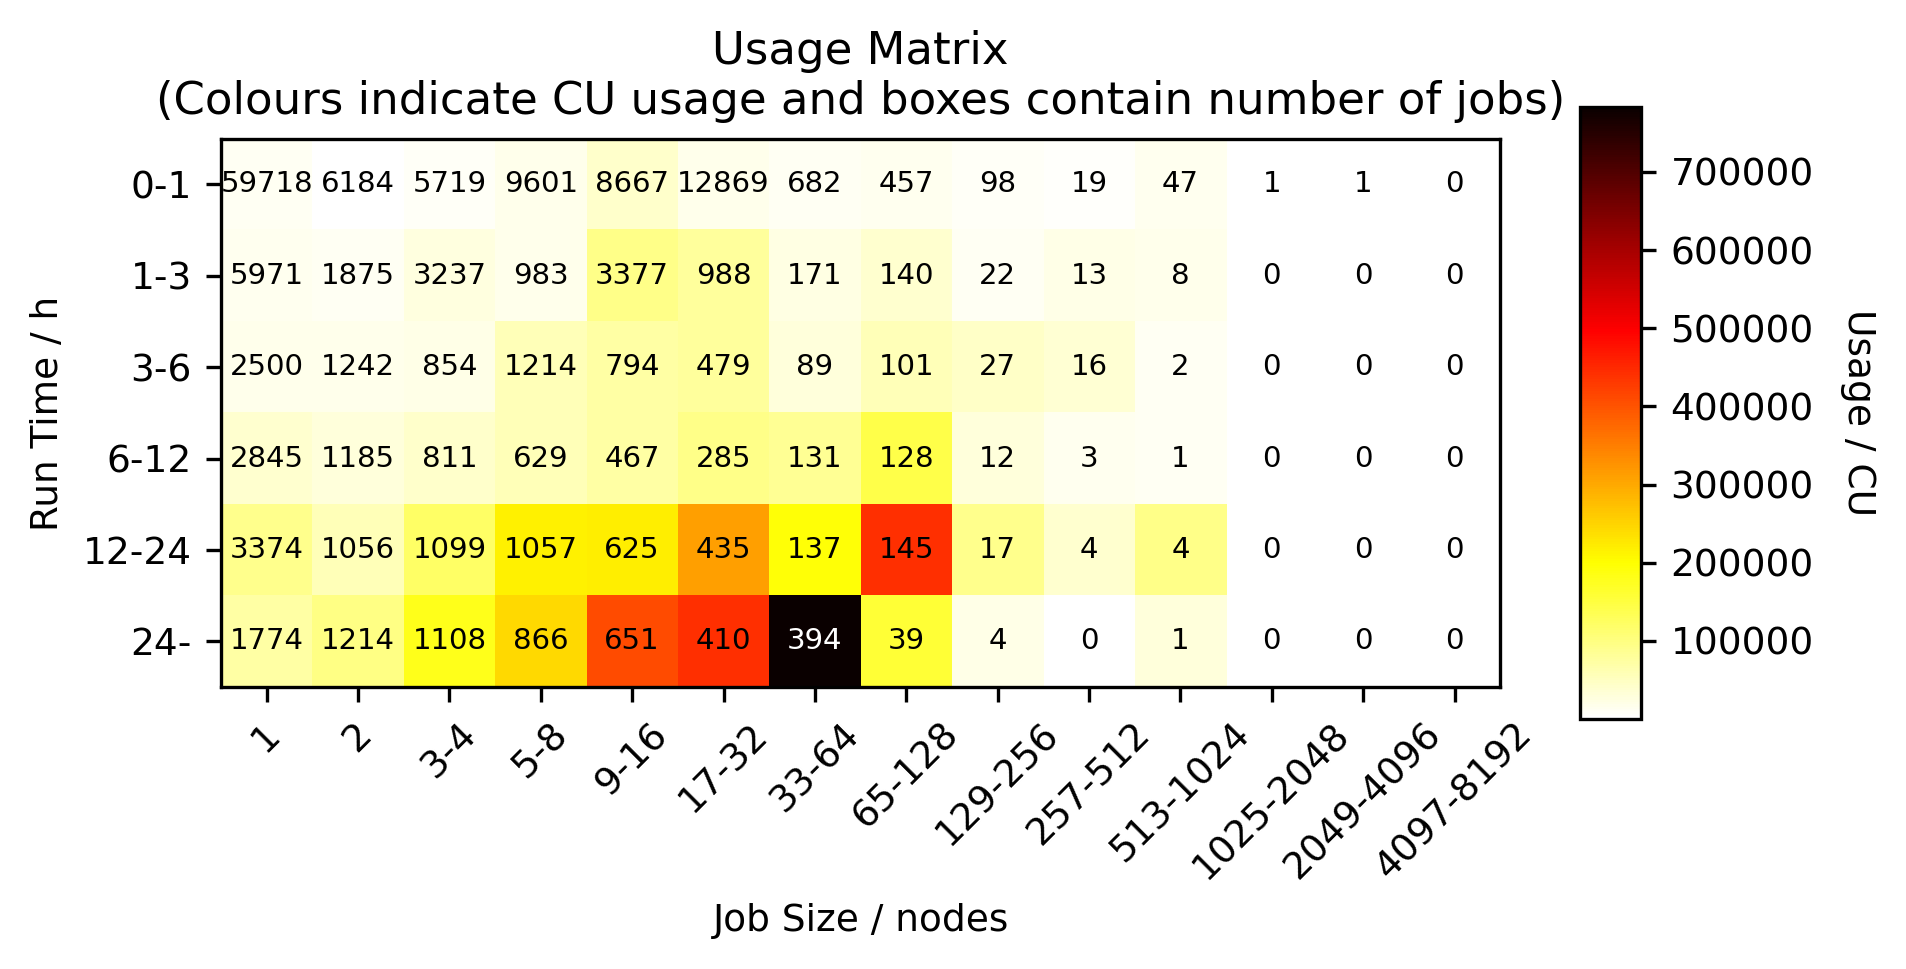
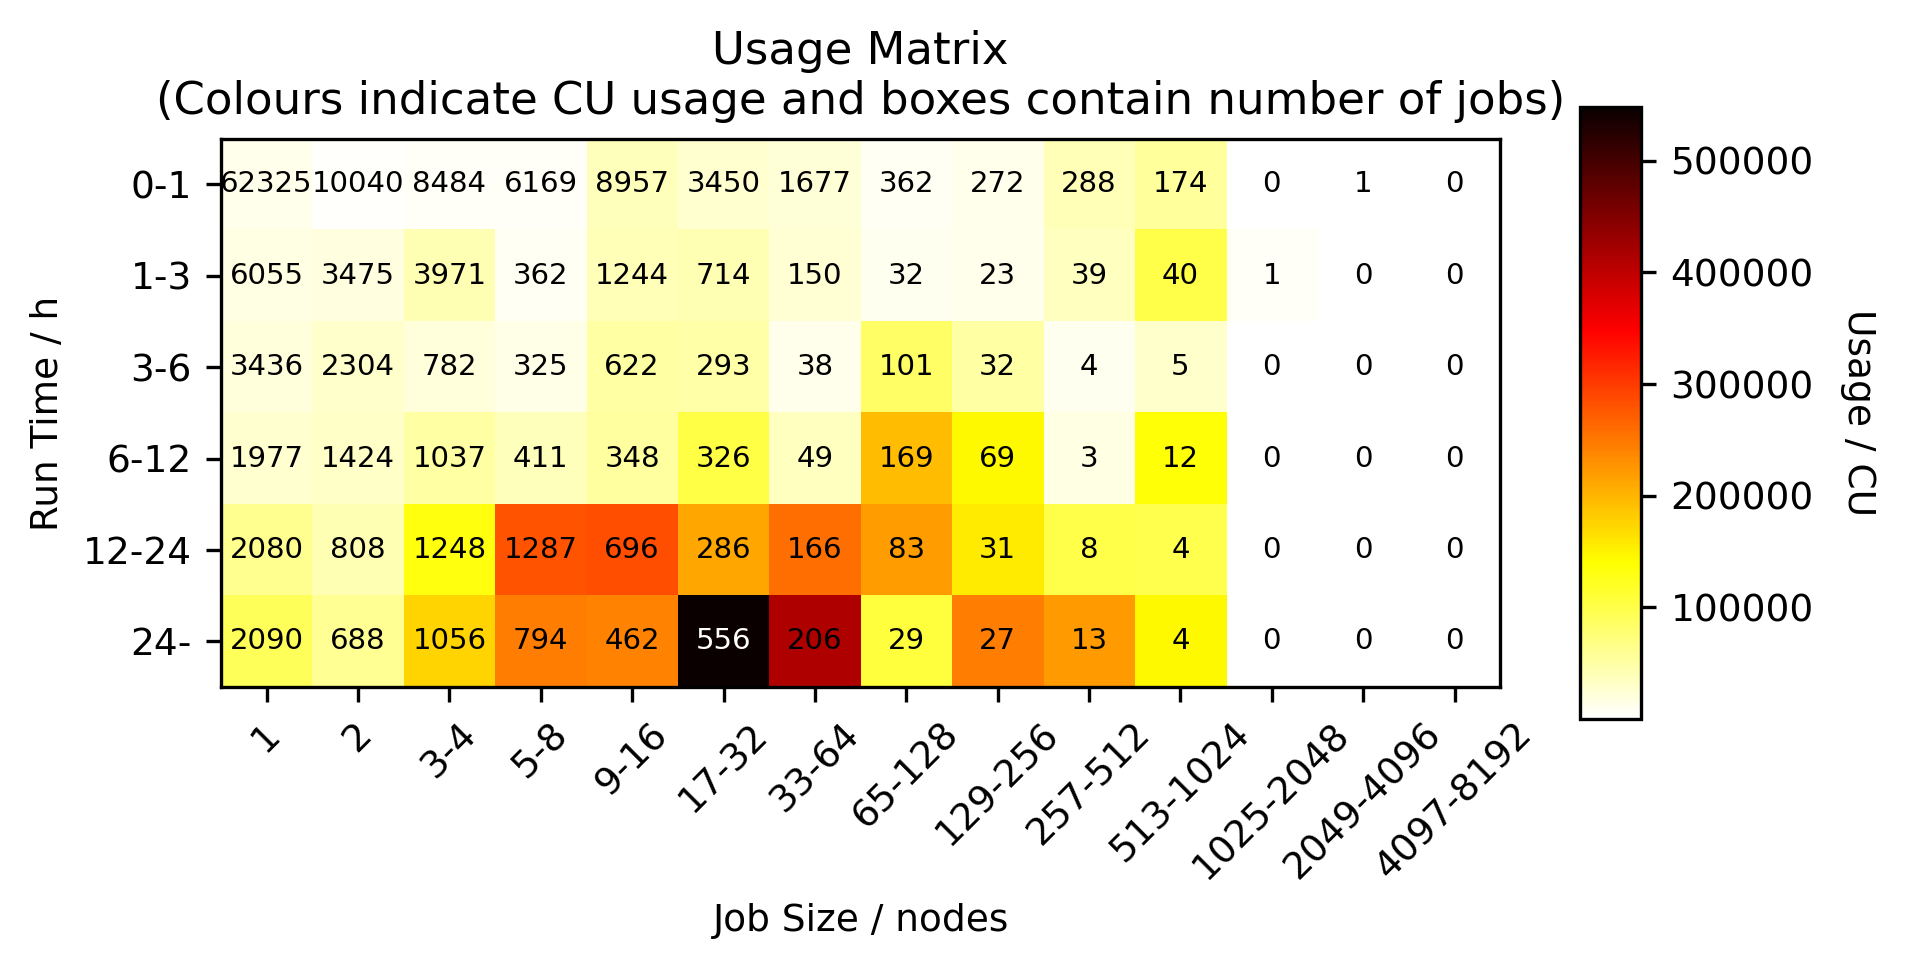
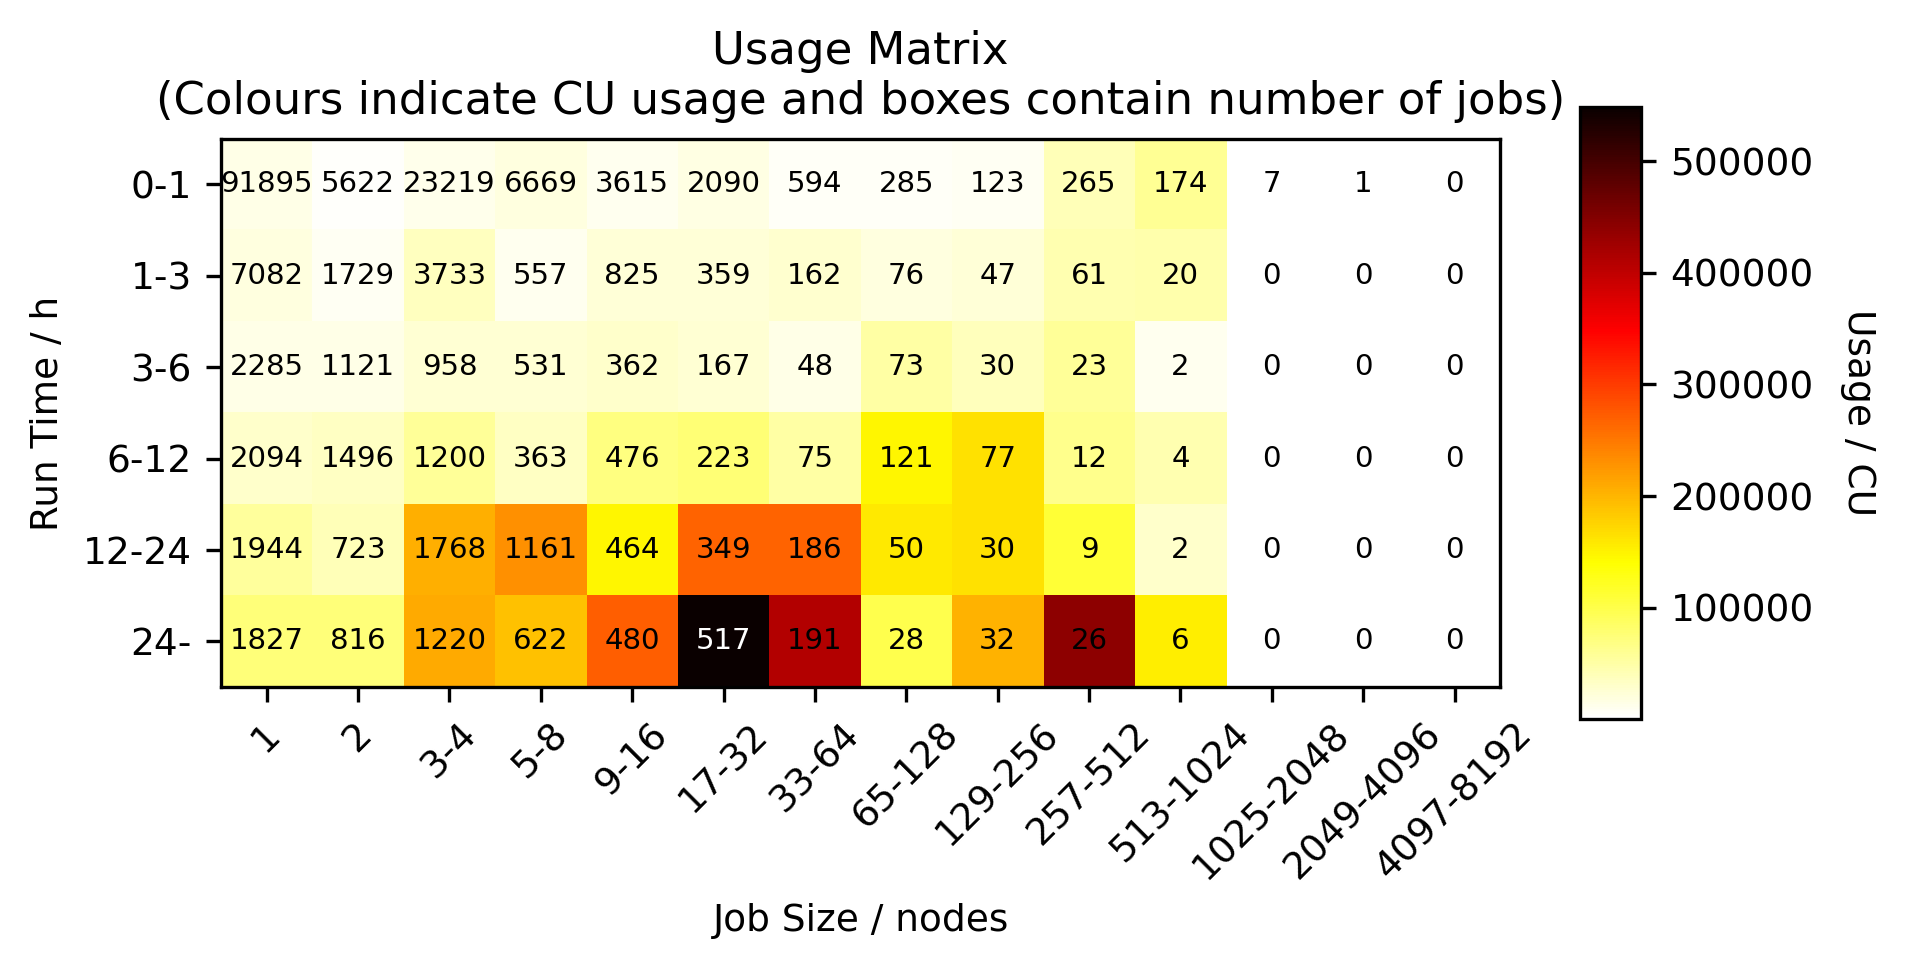
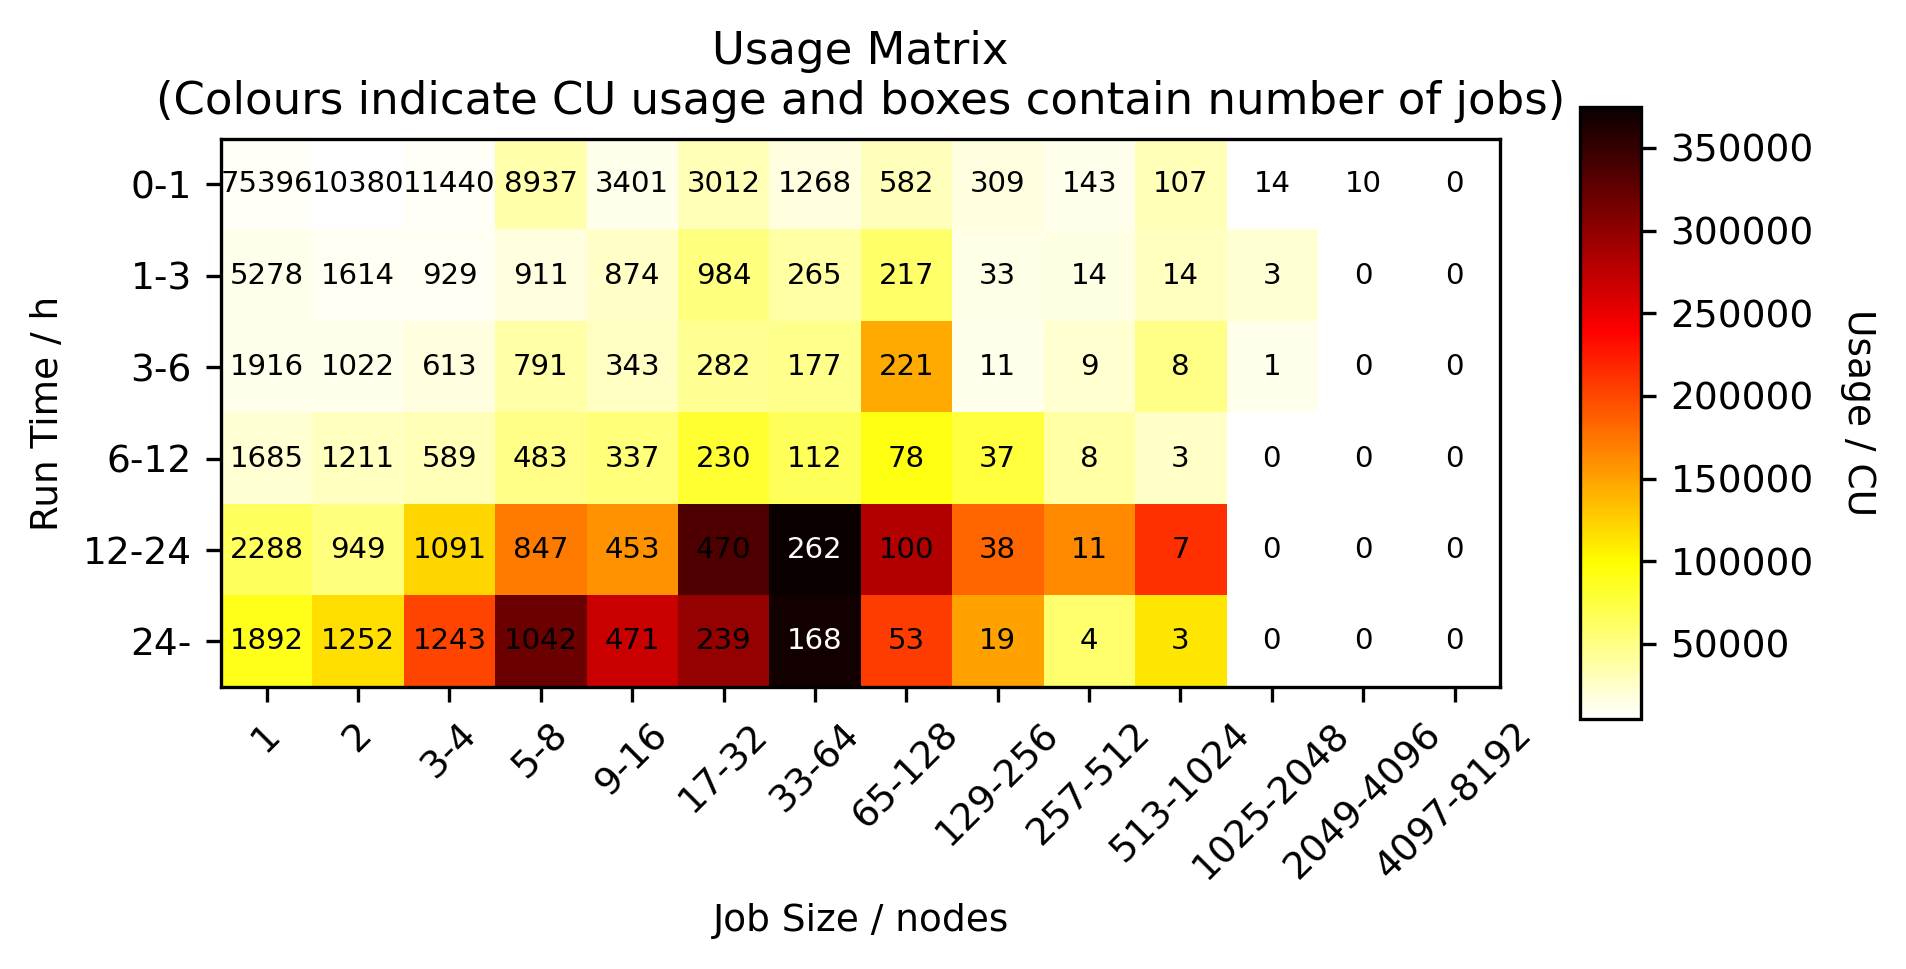
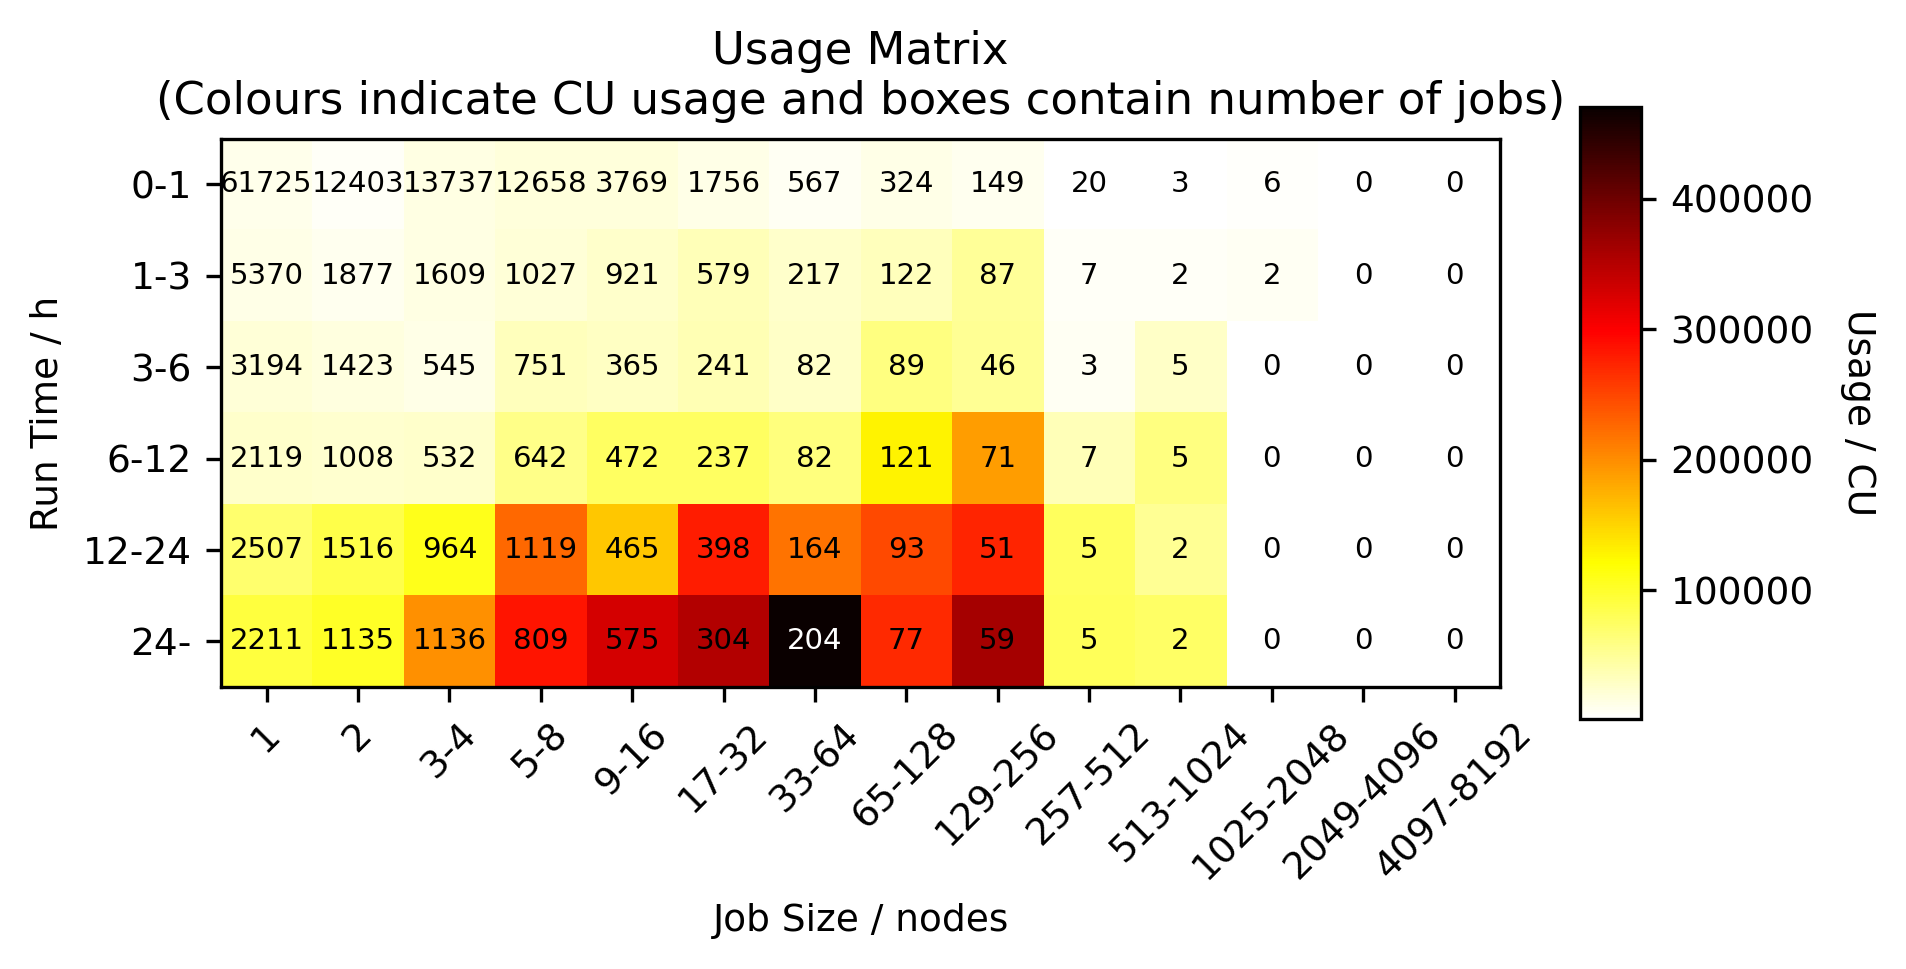
This section contains data on ARCHER2 usage for Jun 2026. Access to historical usage data is available at the end of the section.
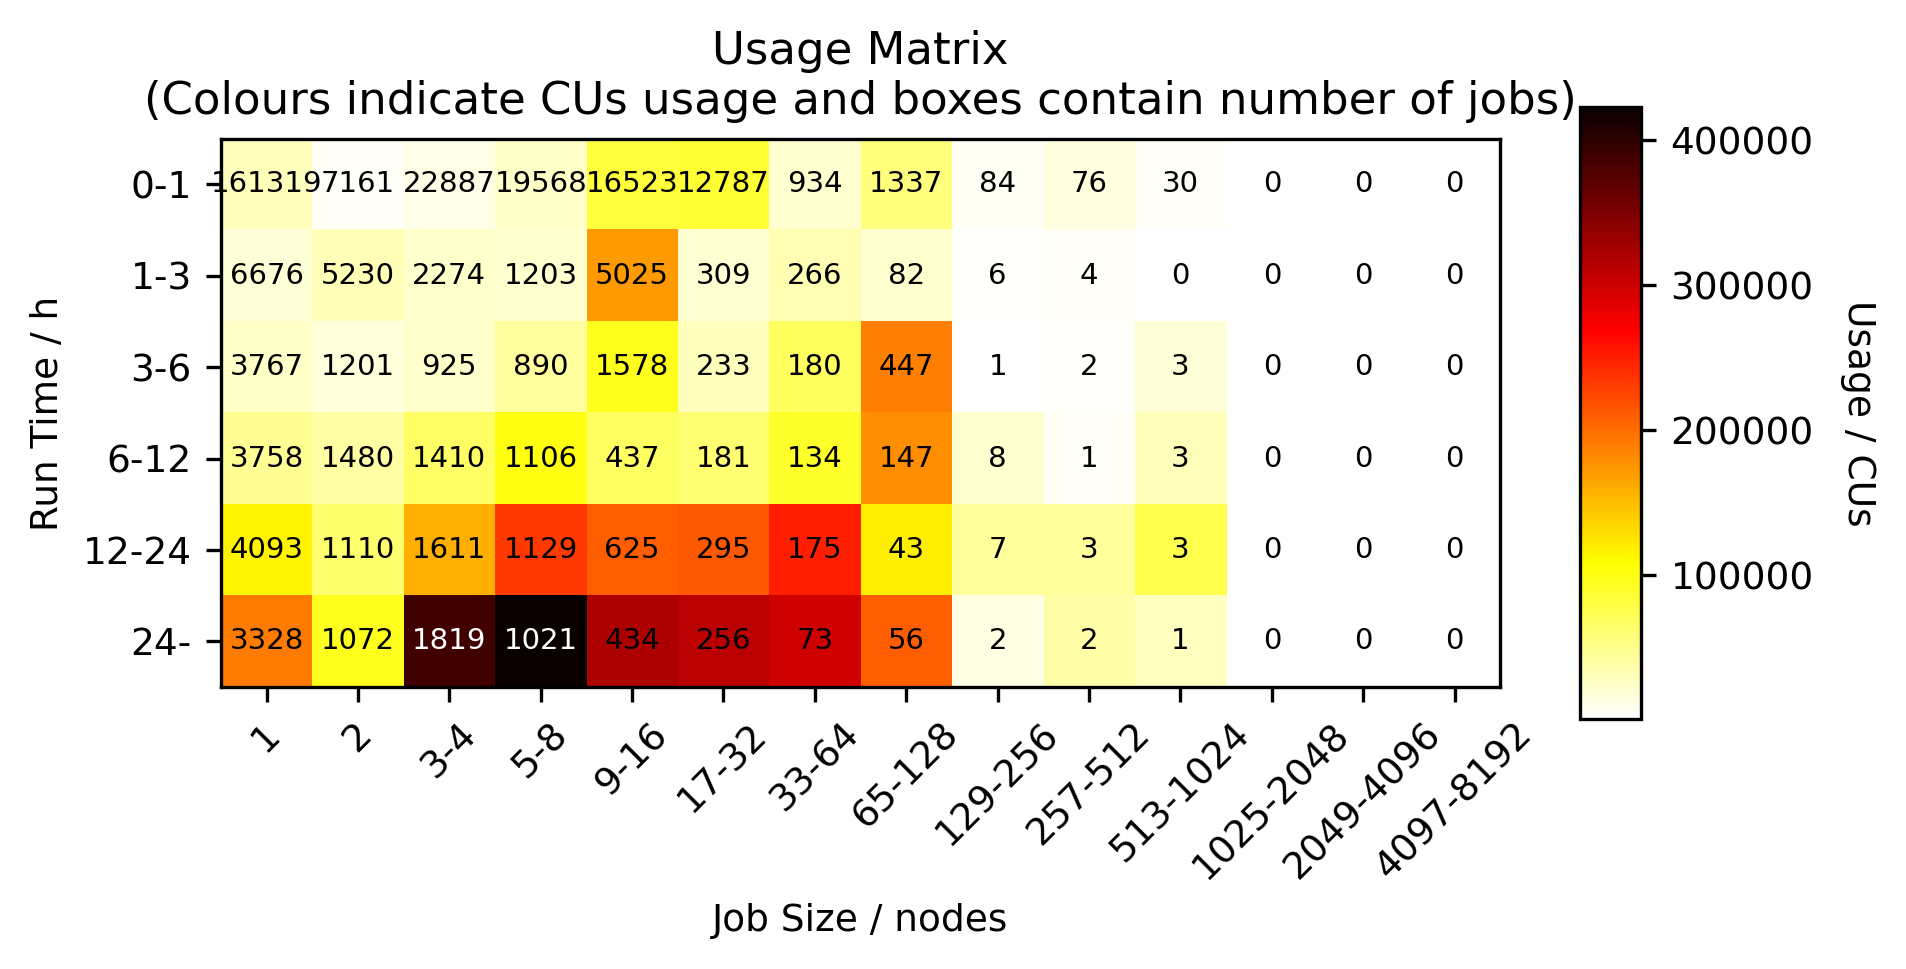
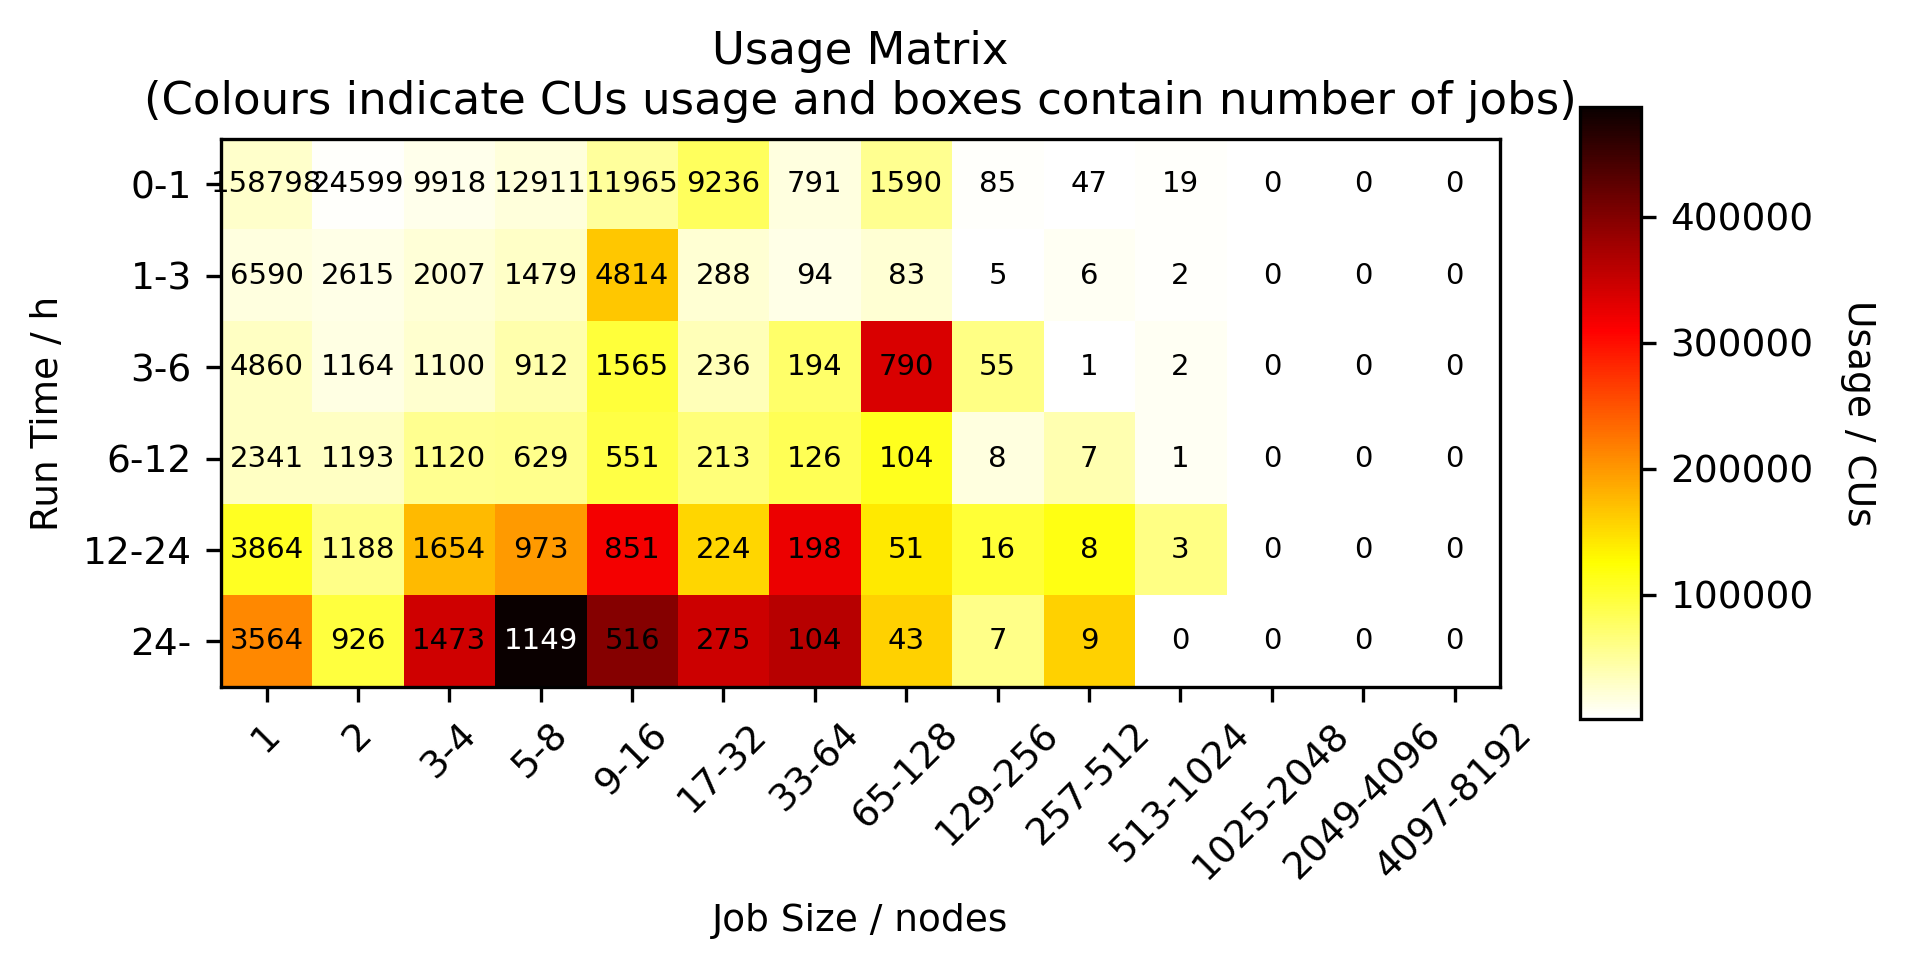
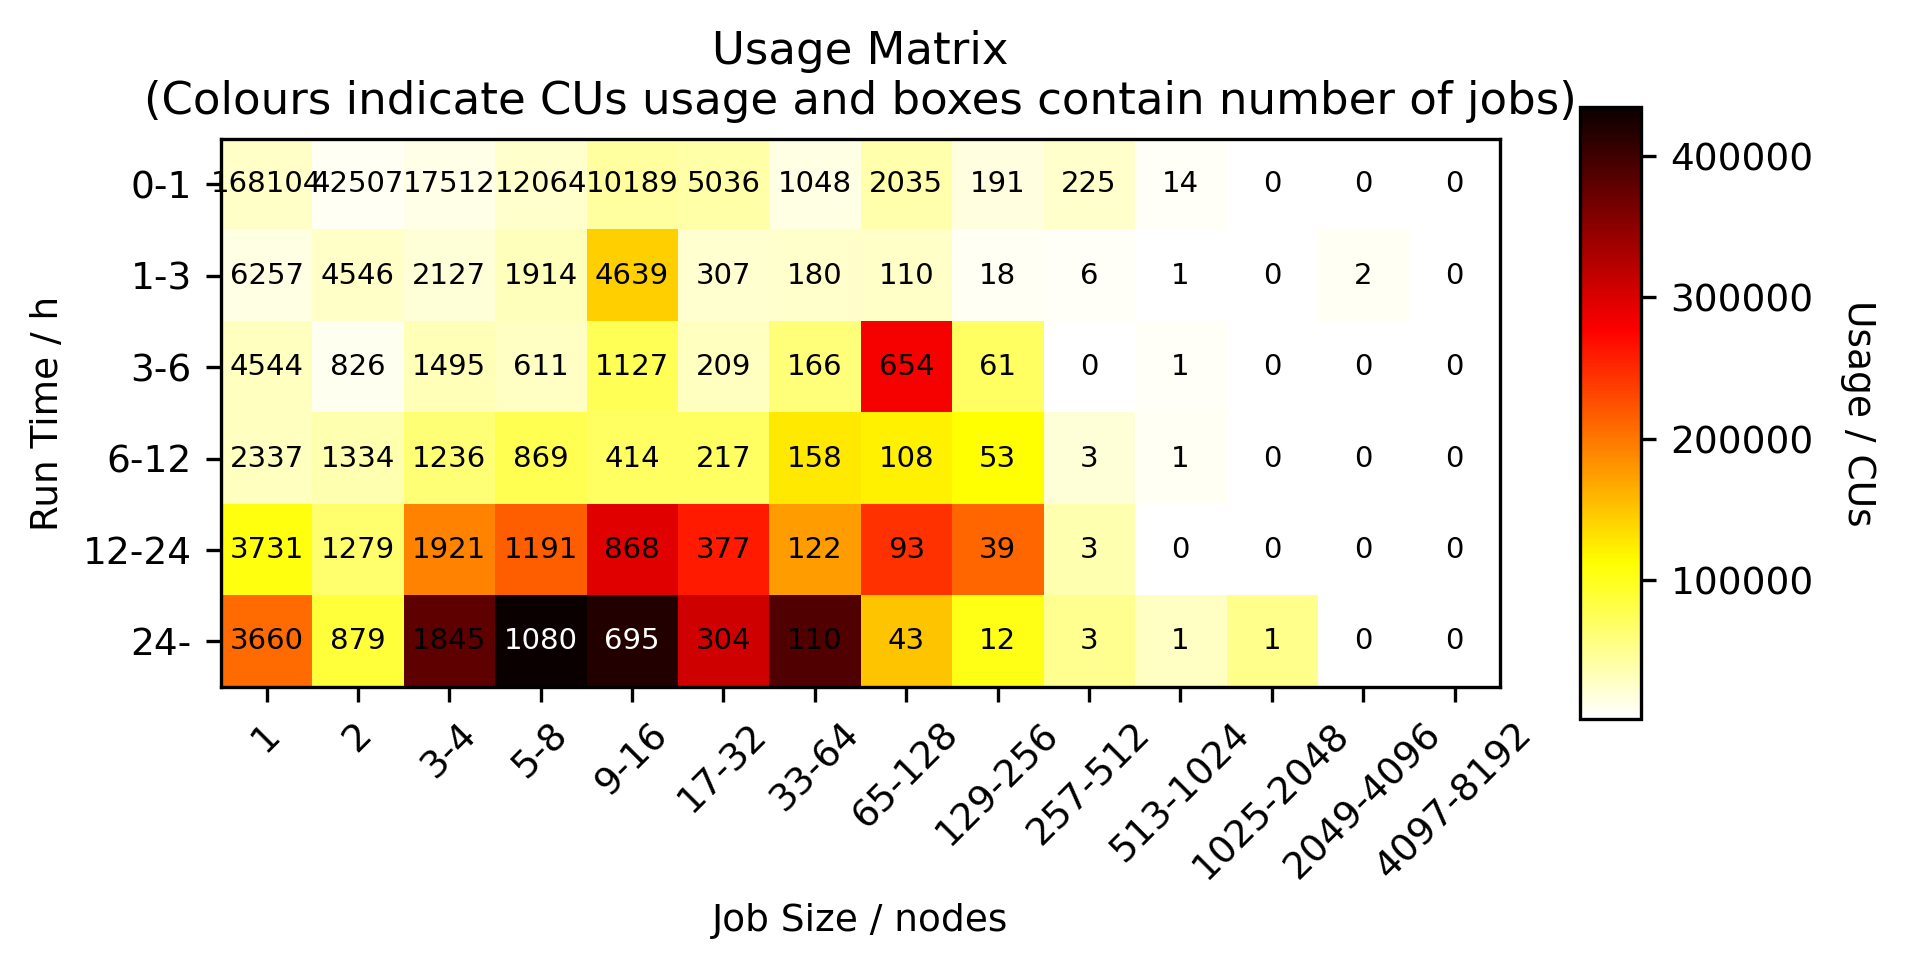
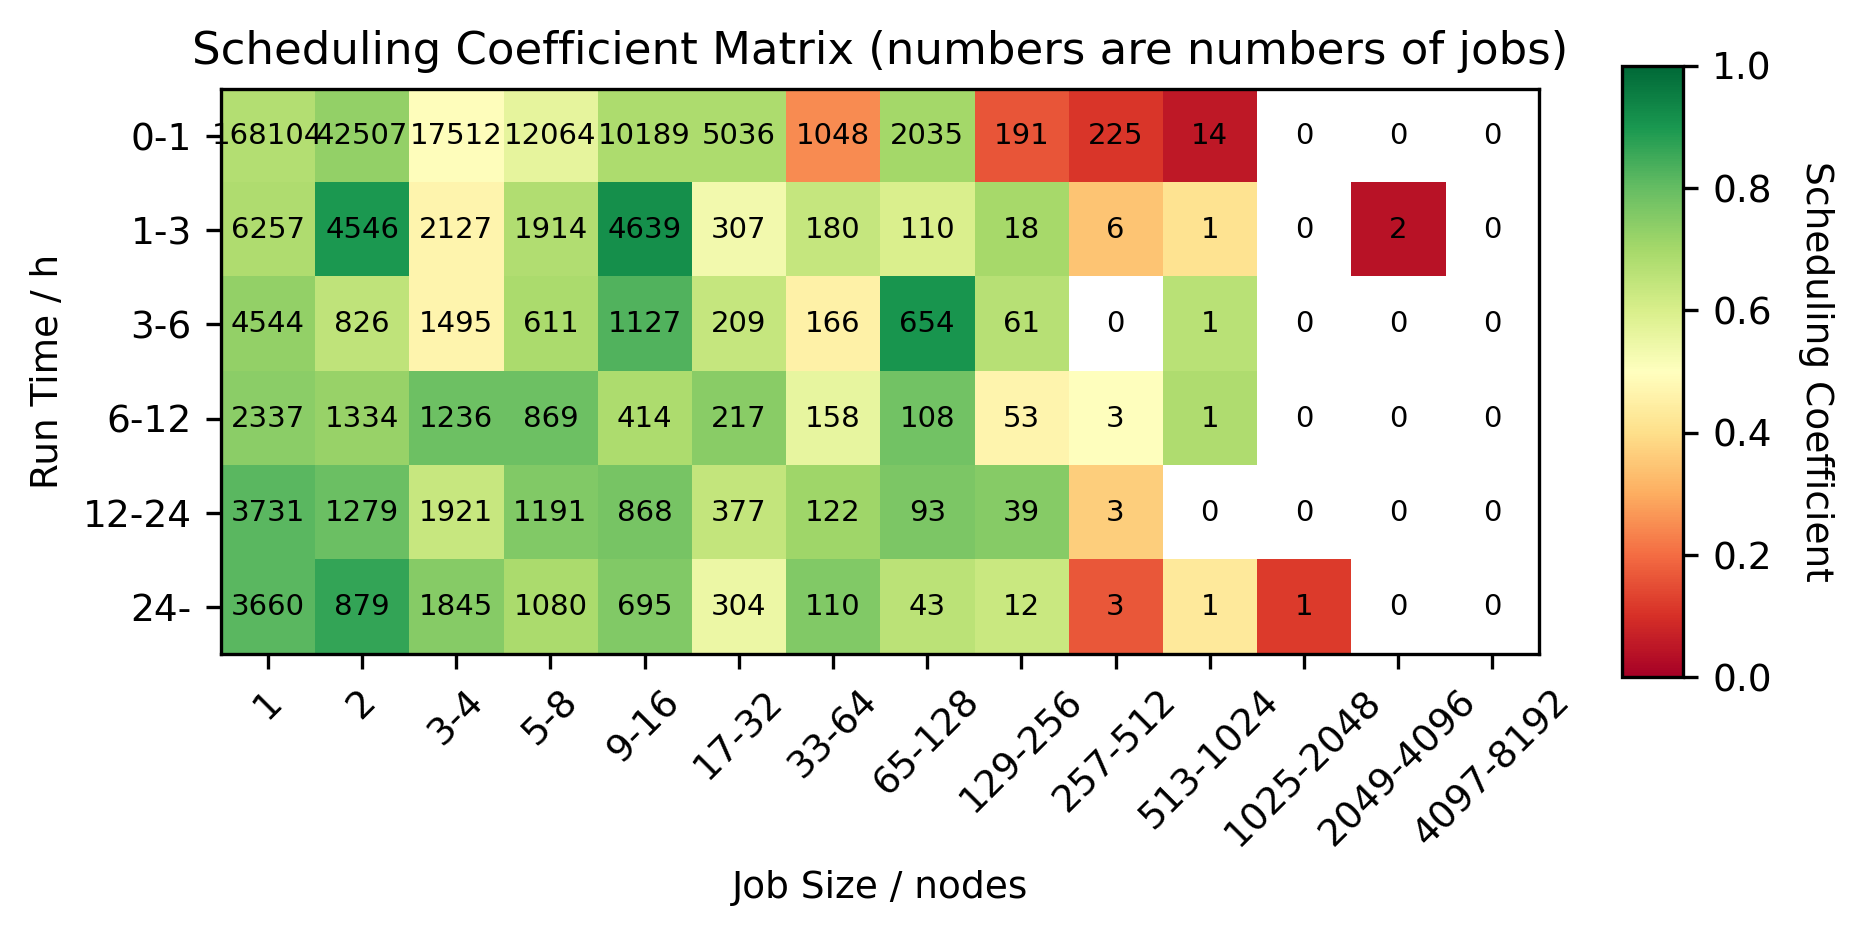
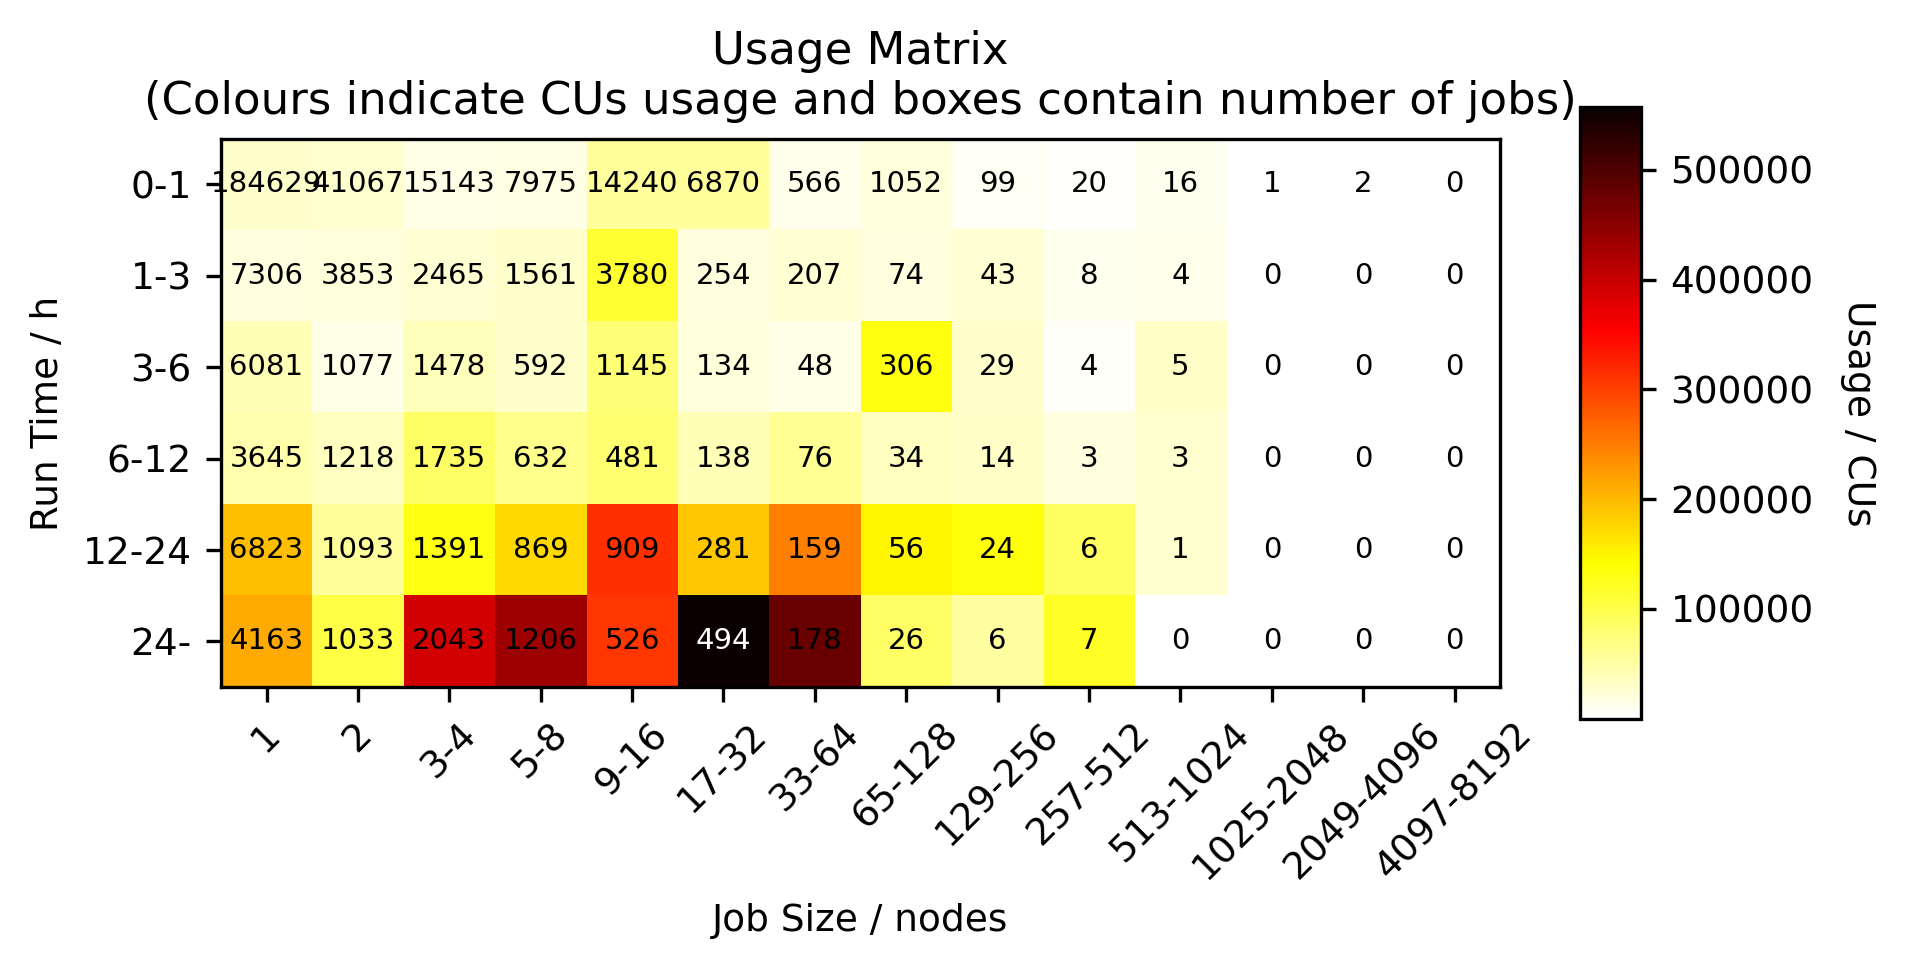
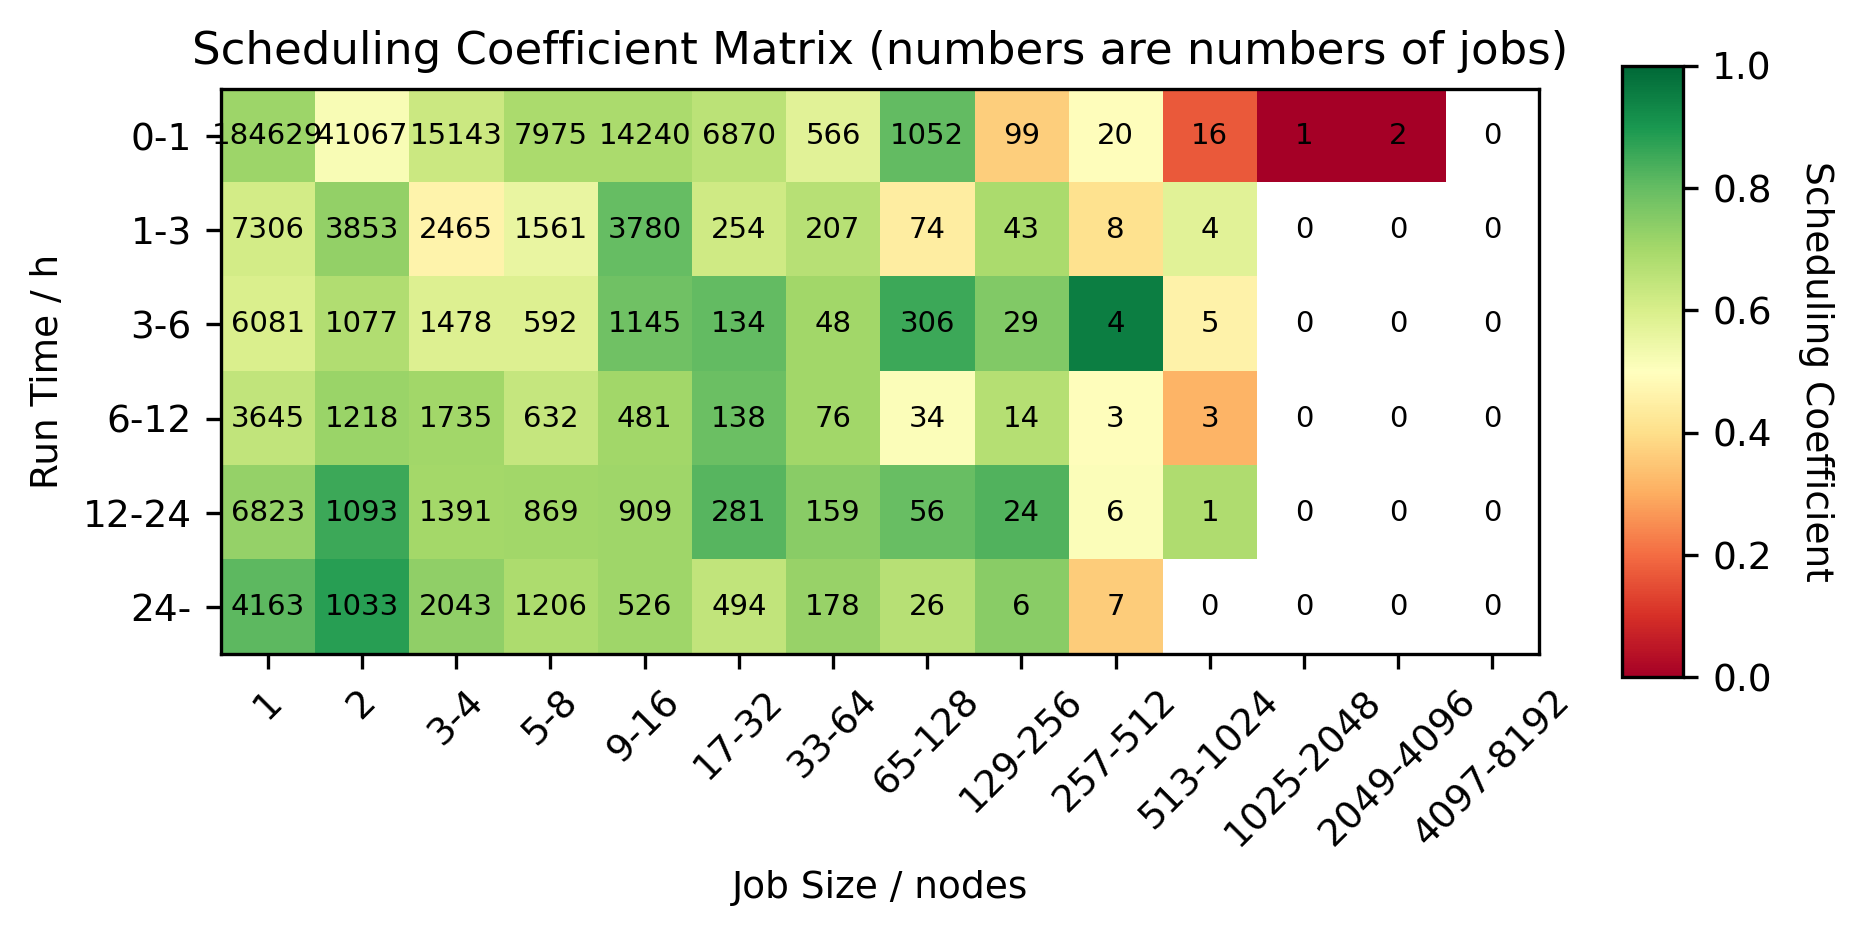
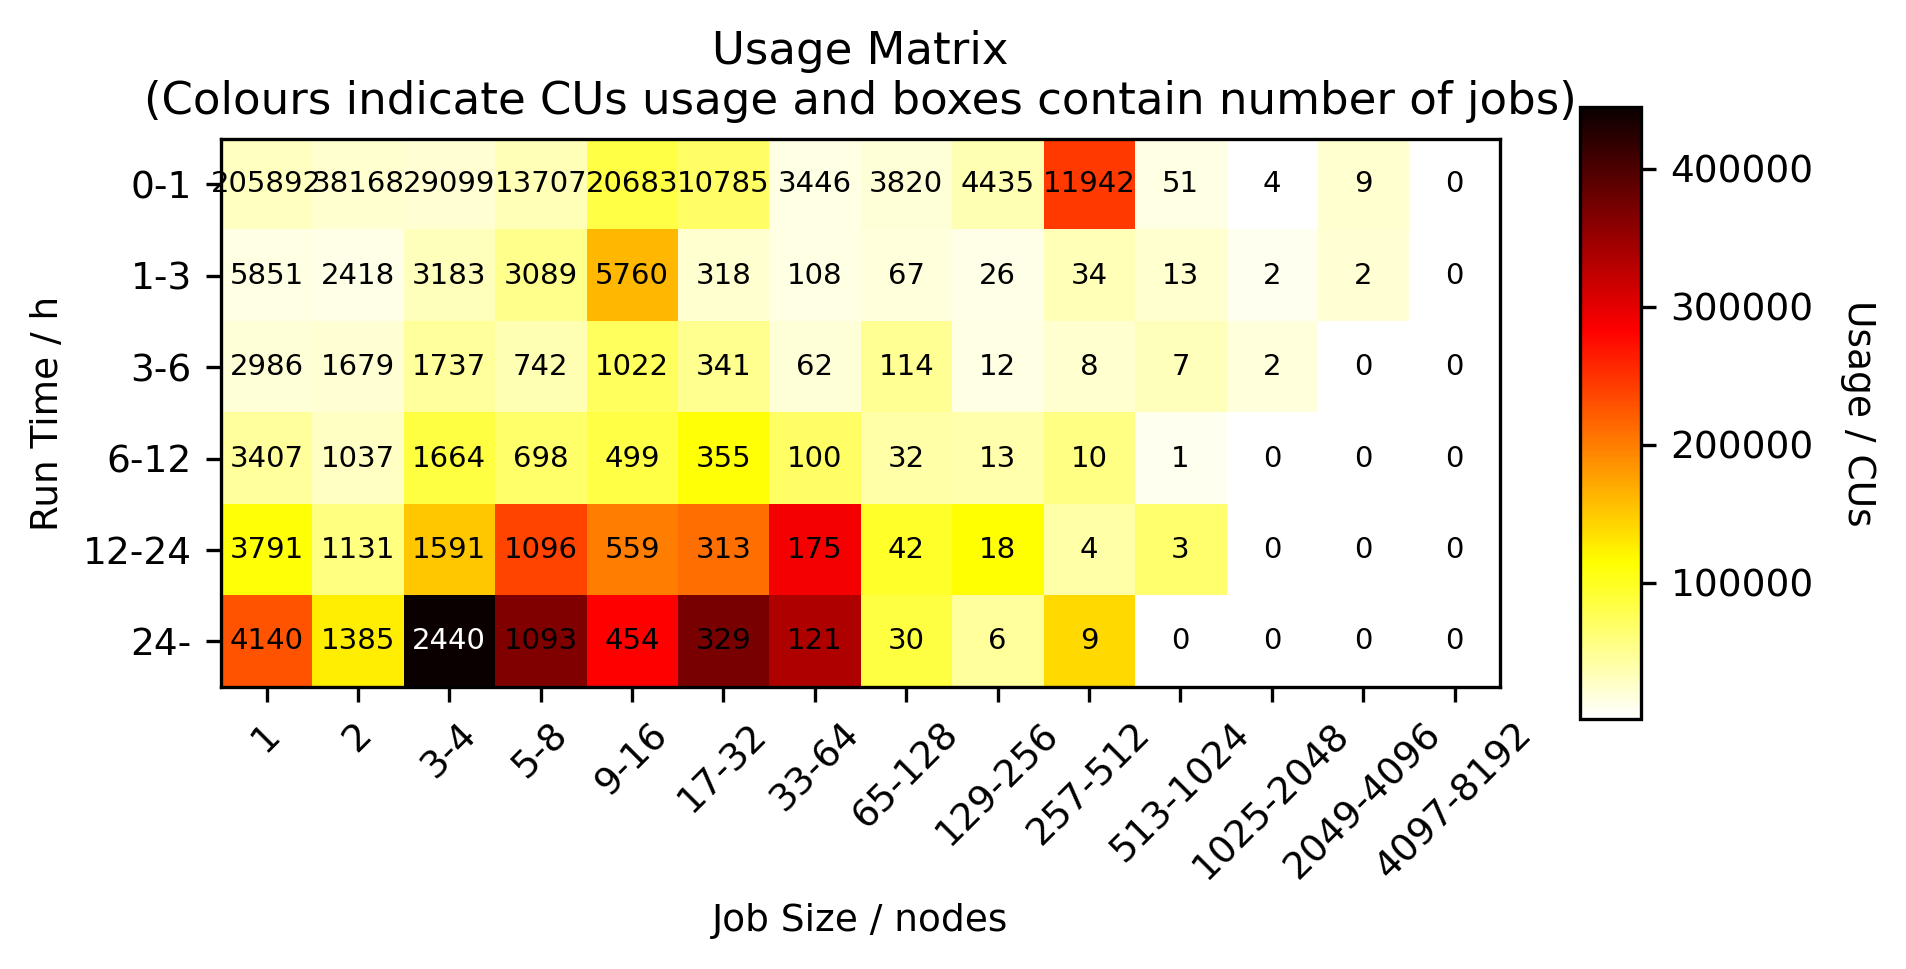
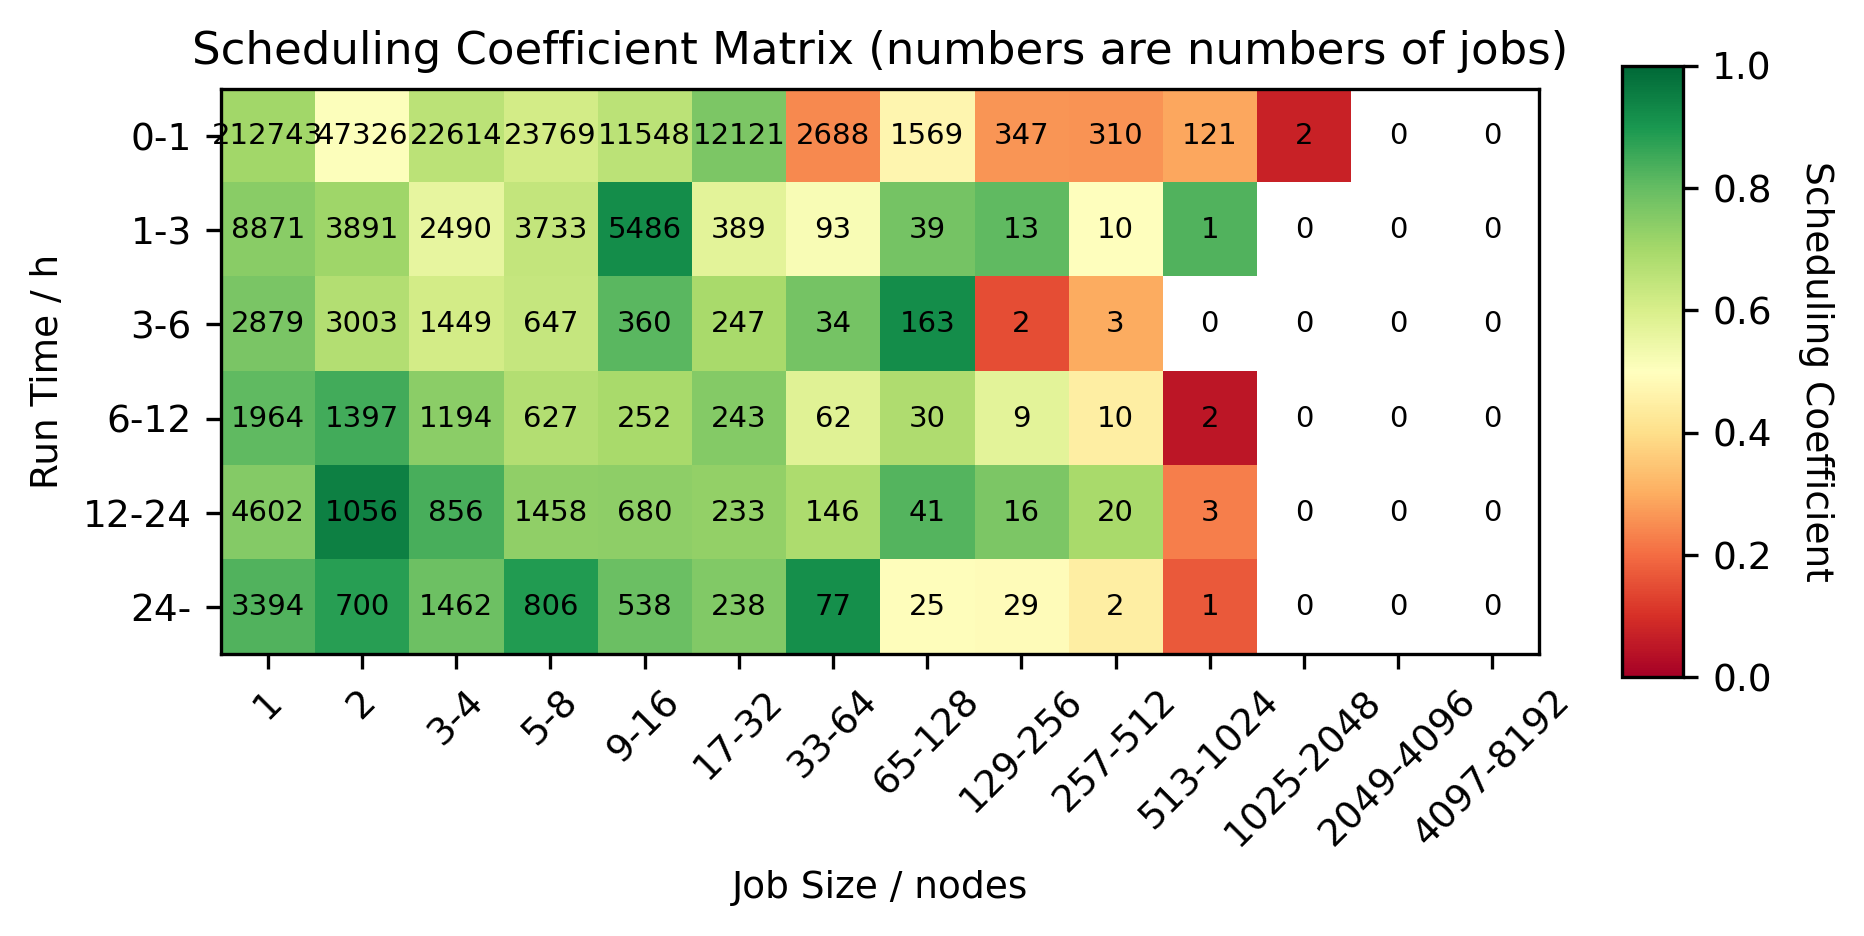
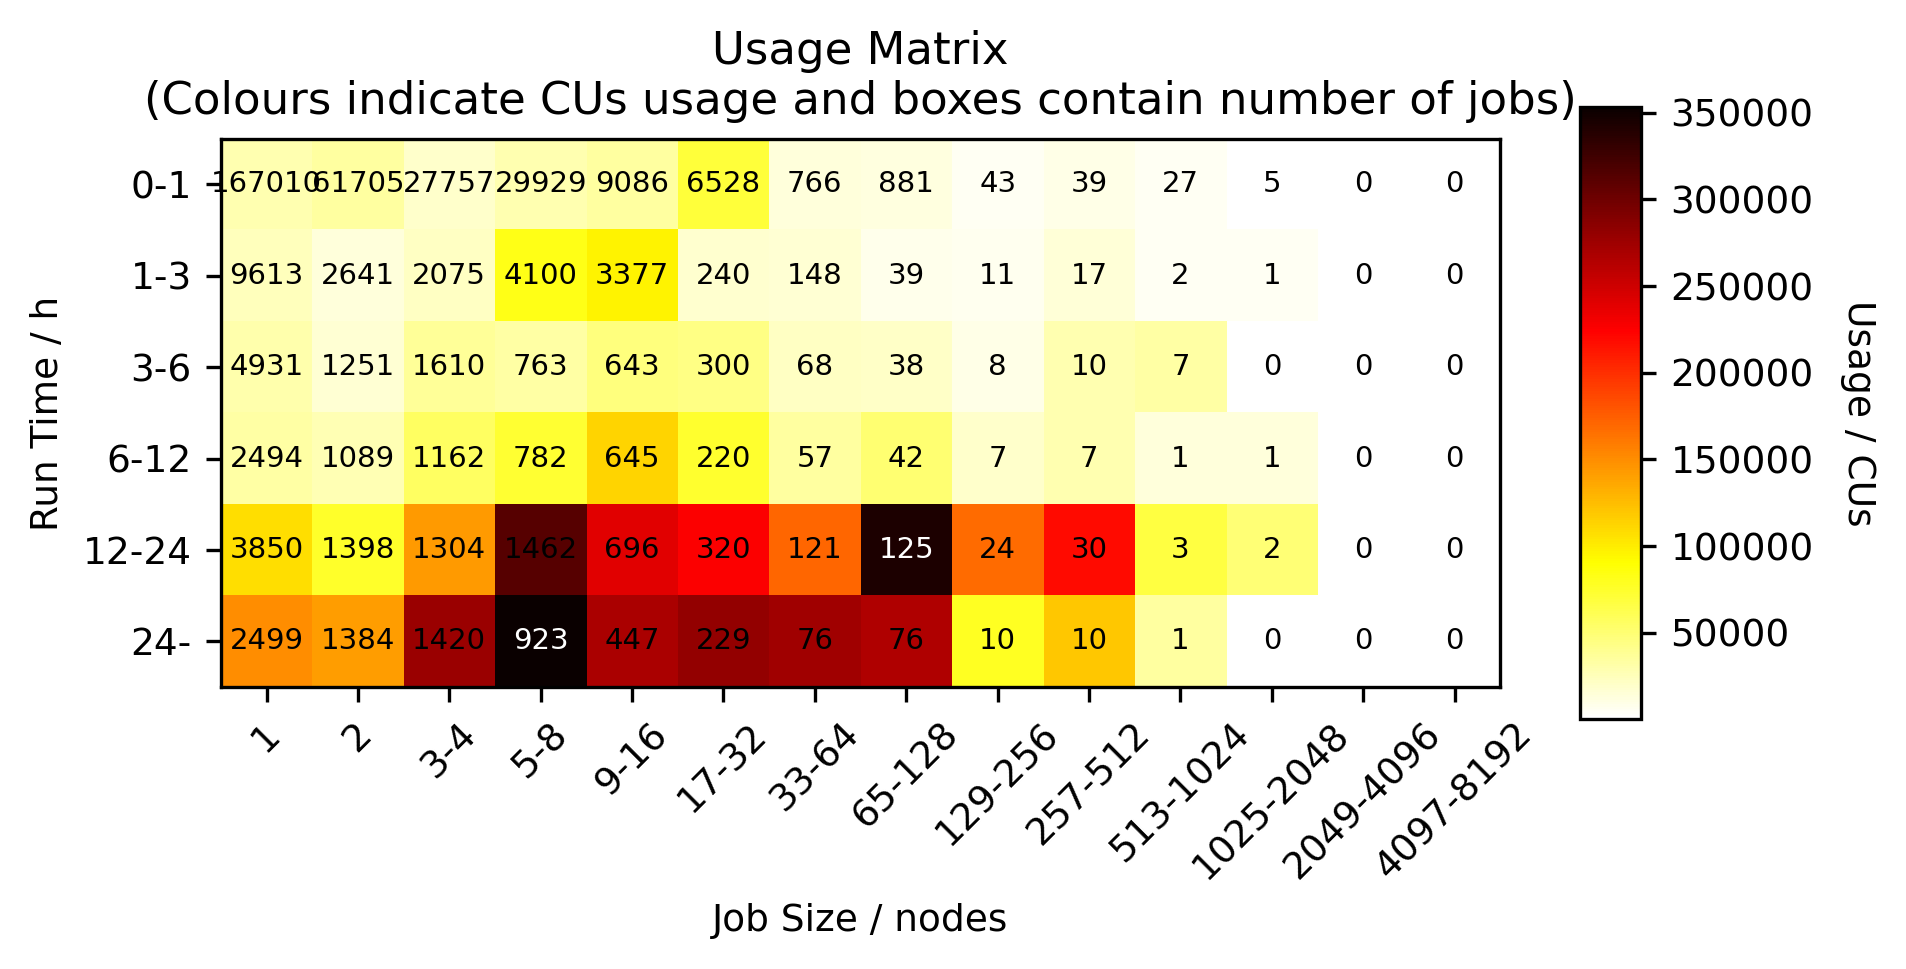
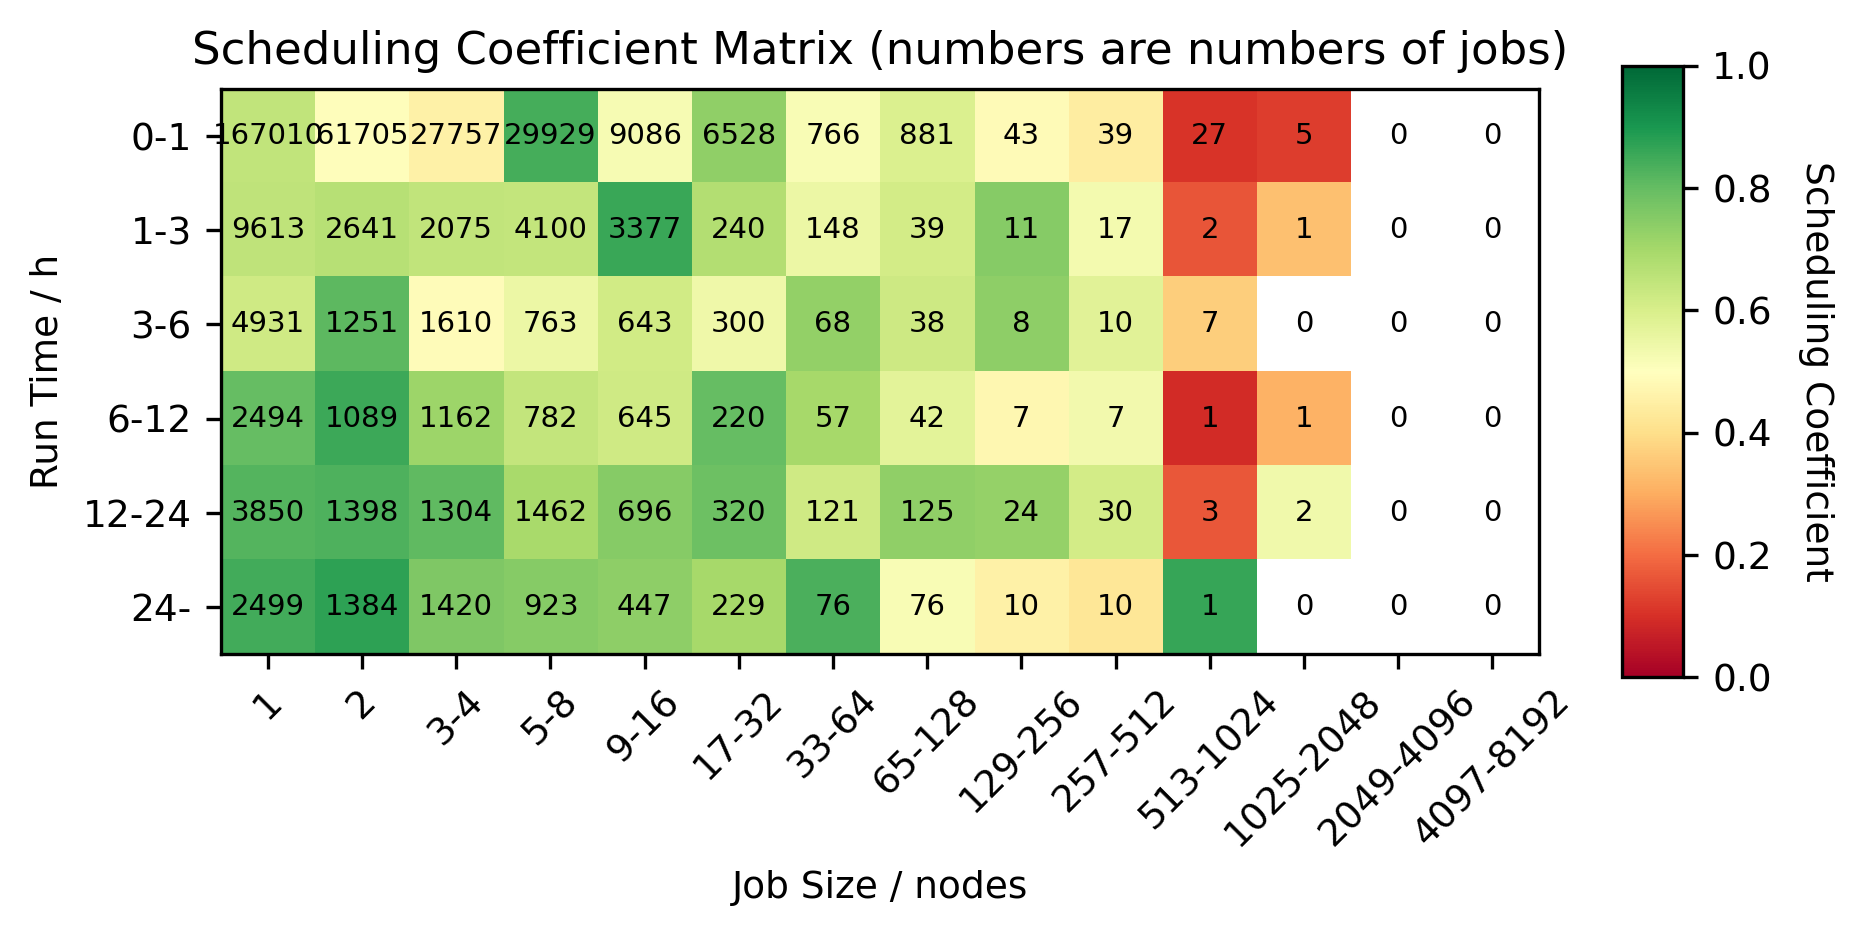
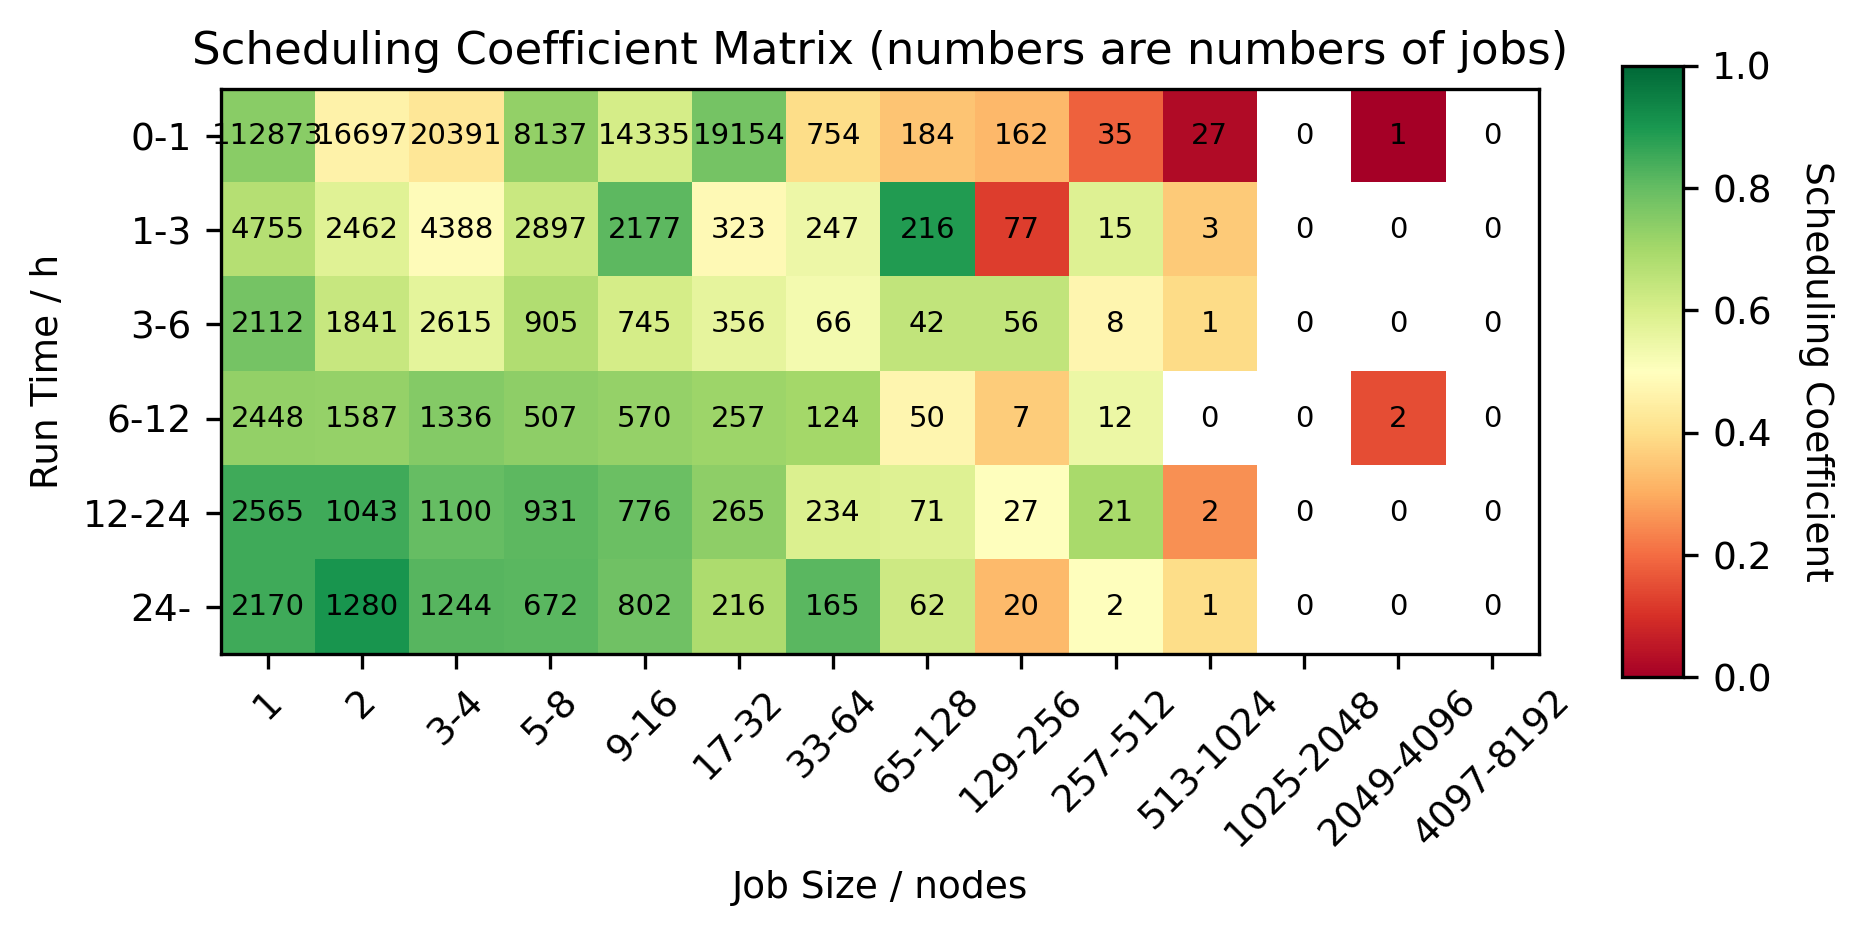
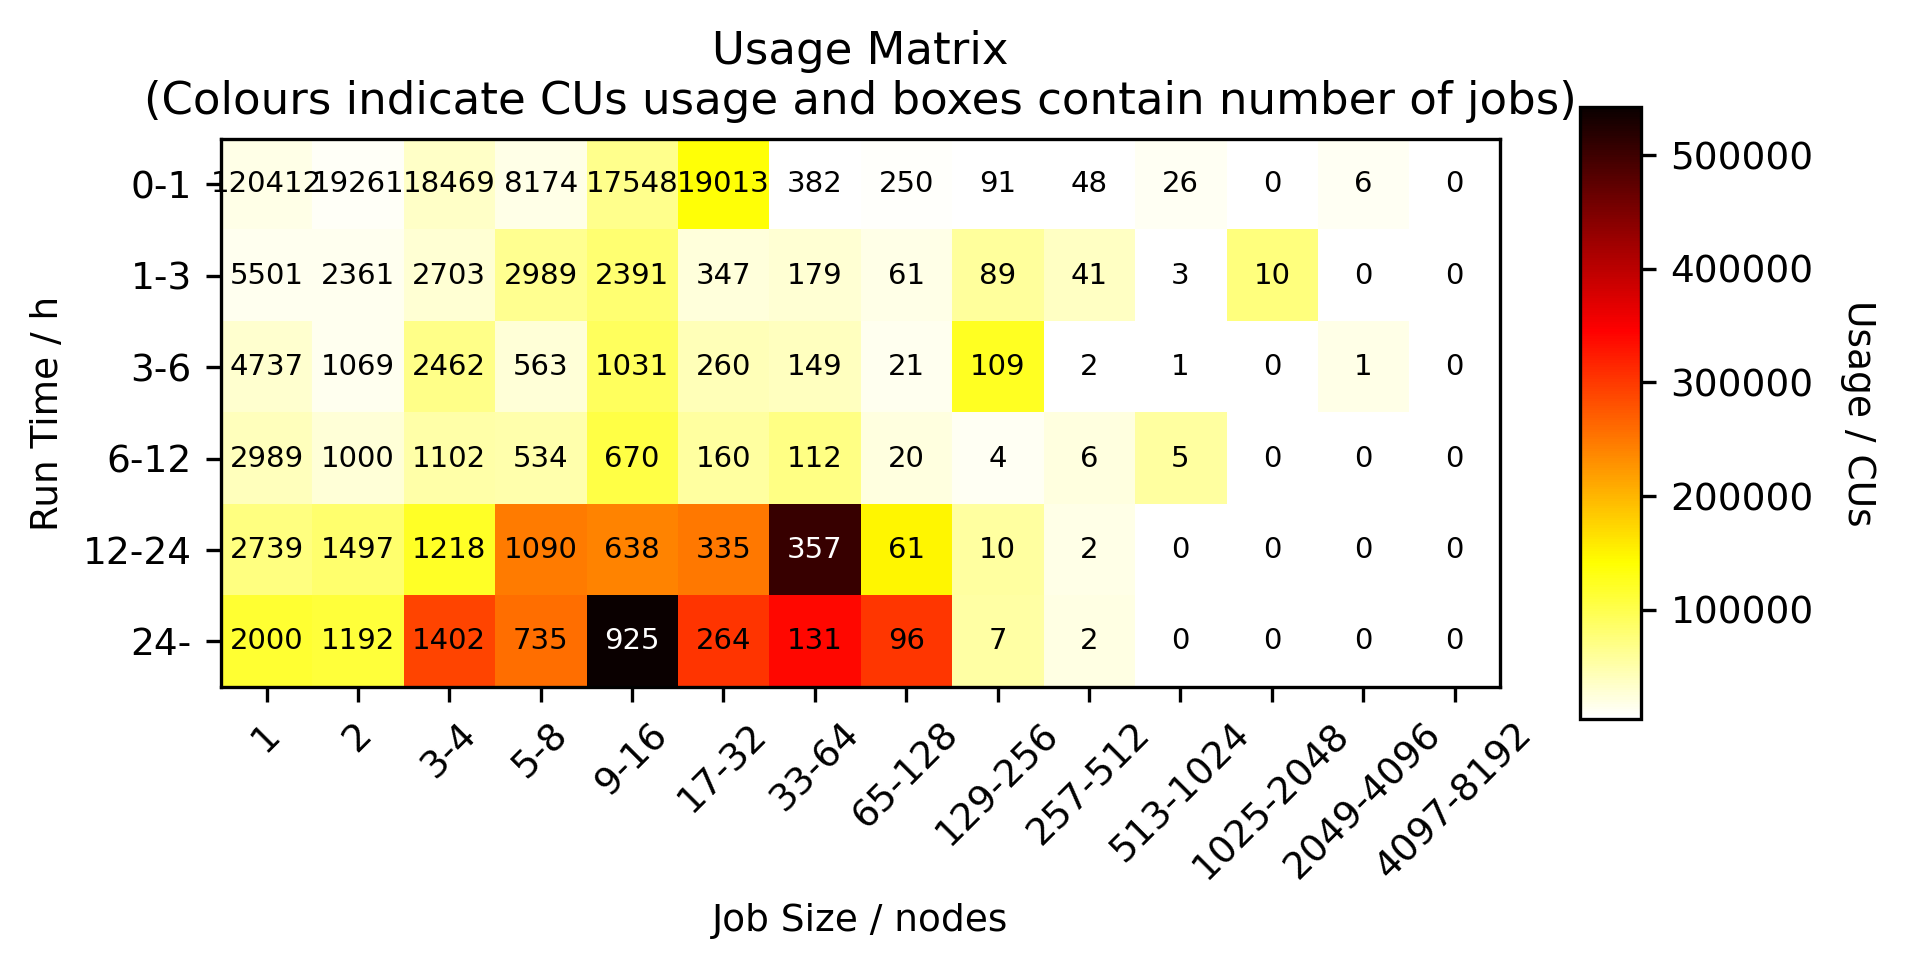
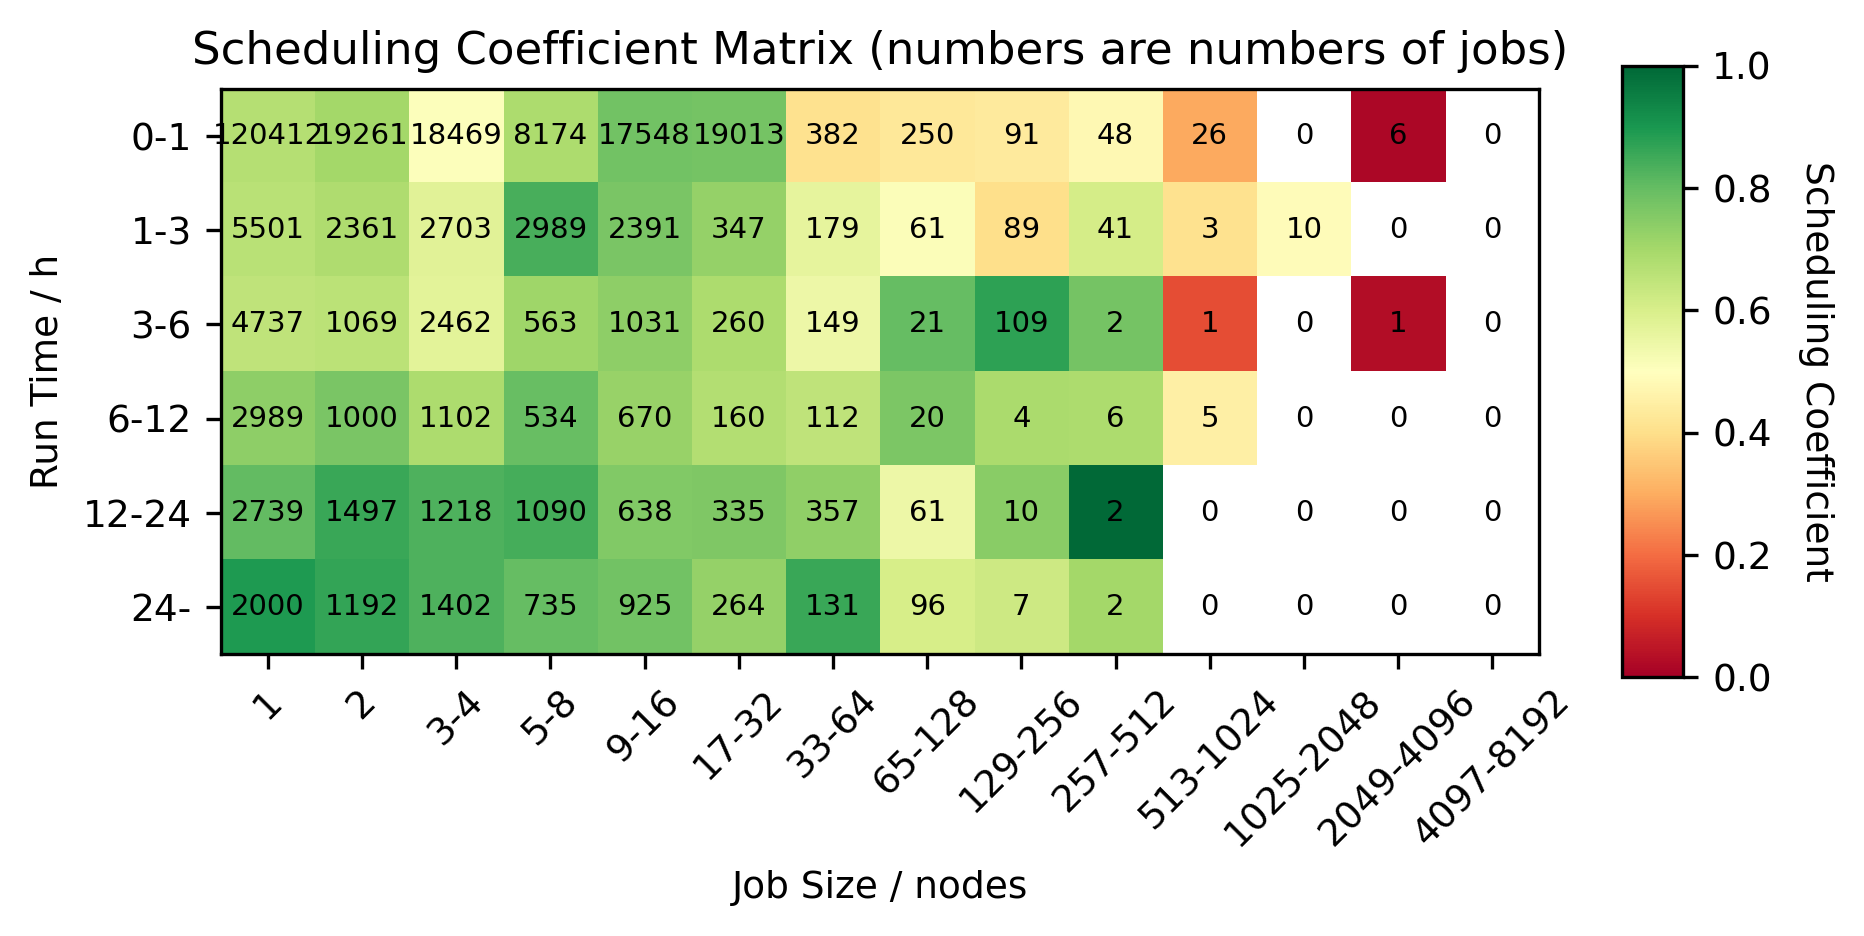
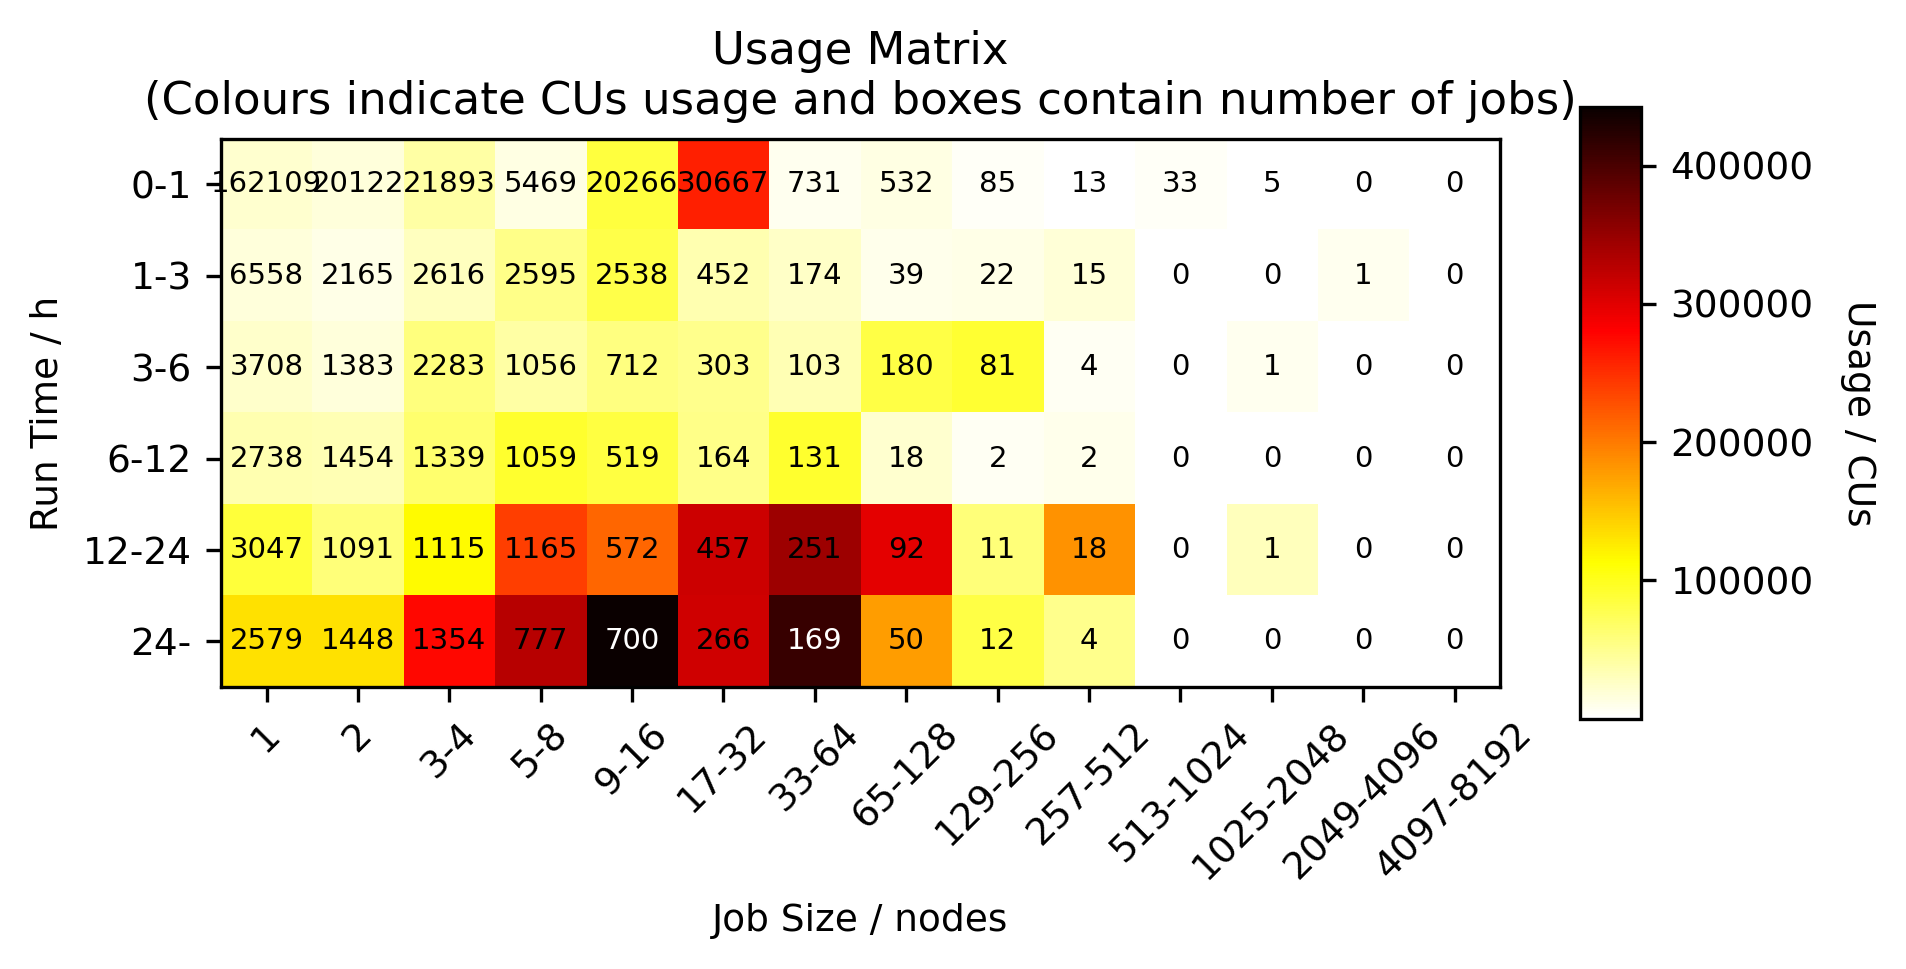
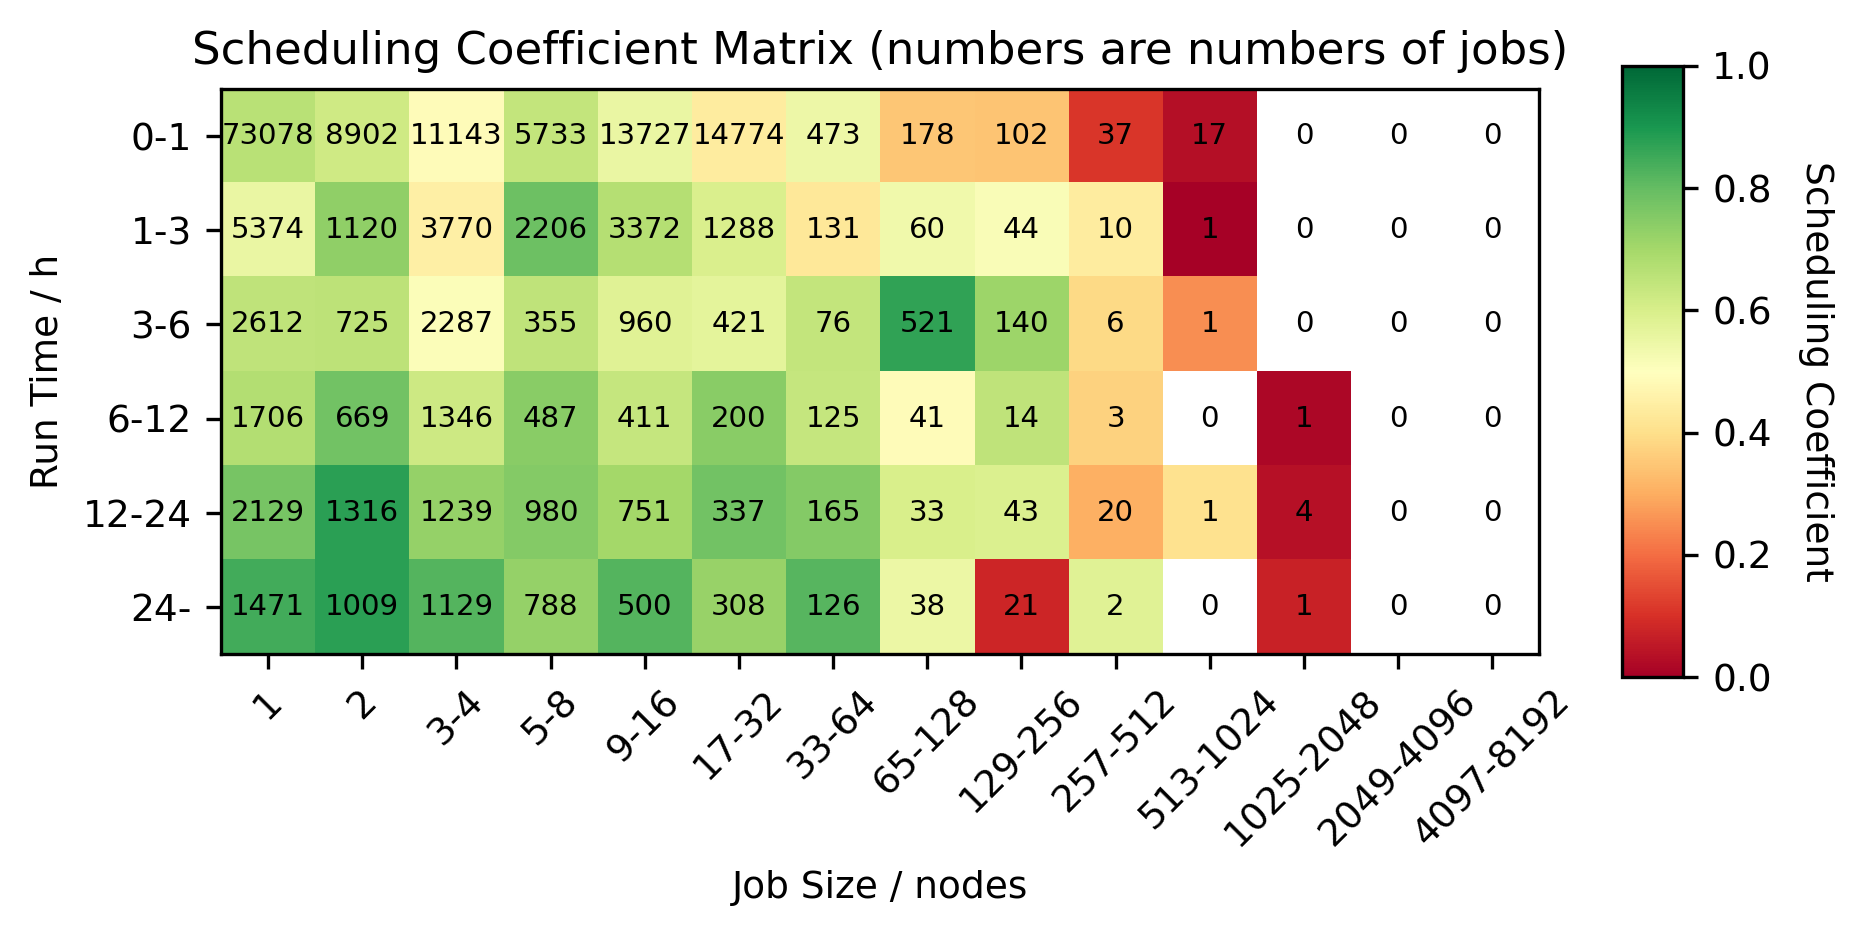
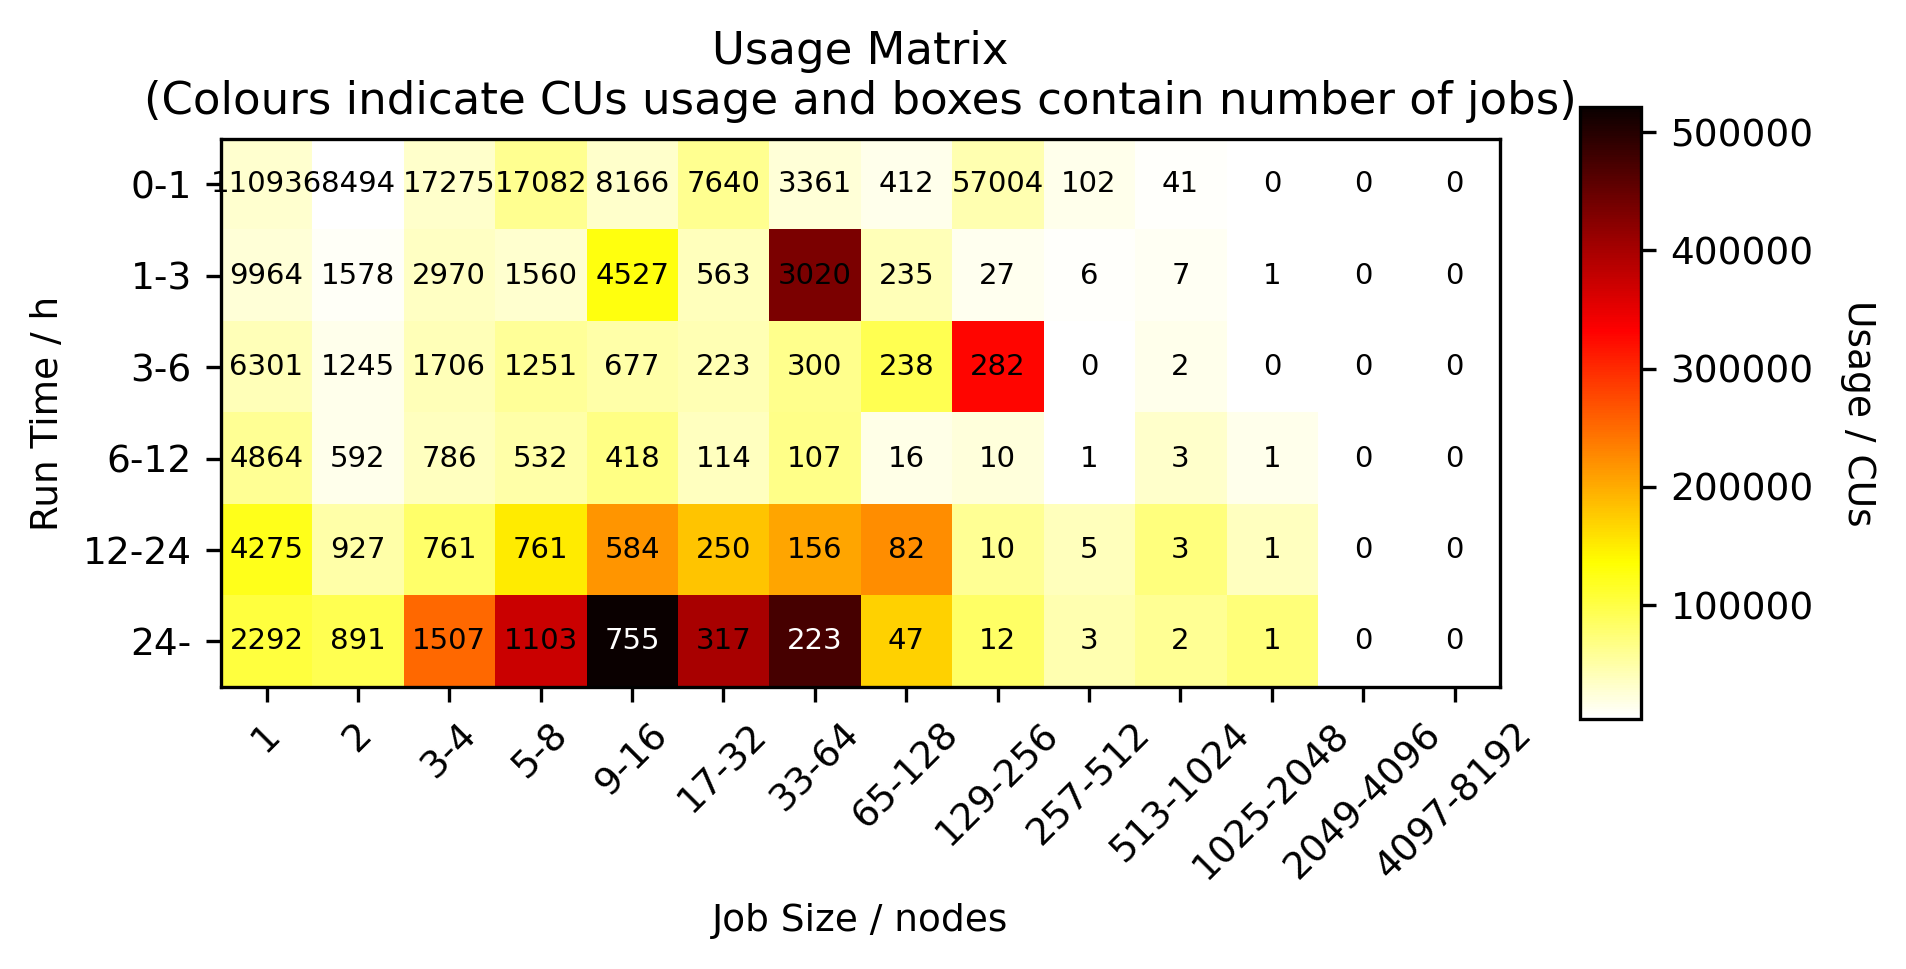
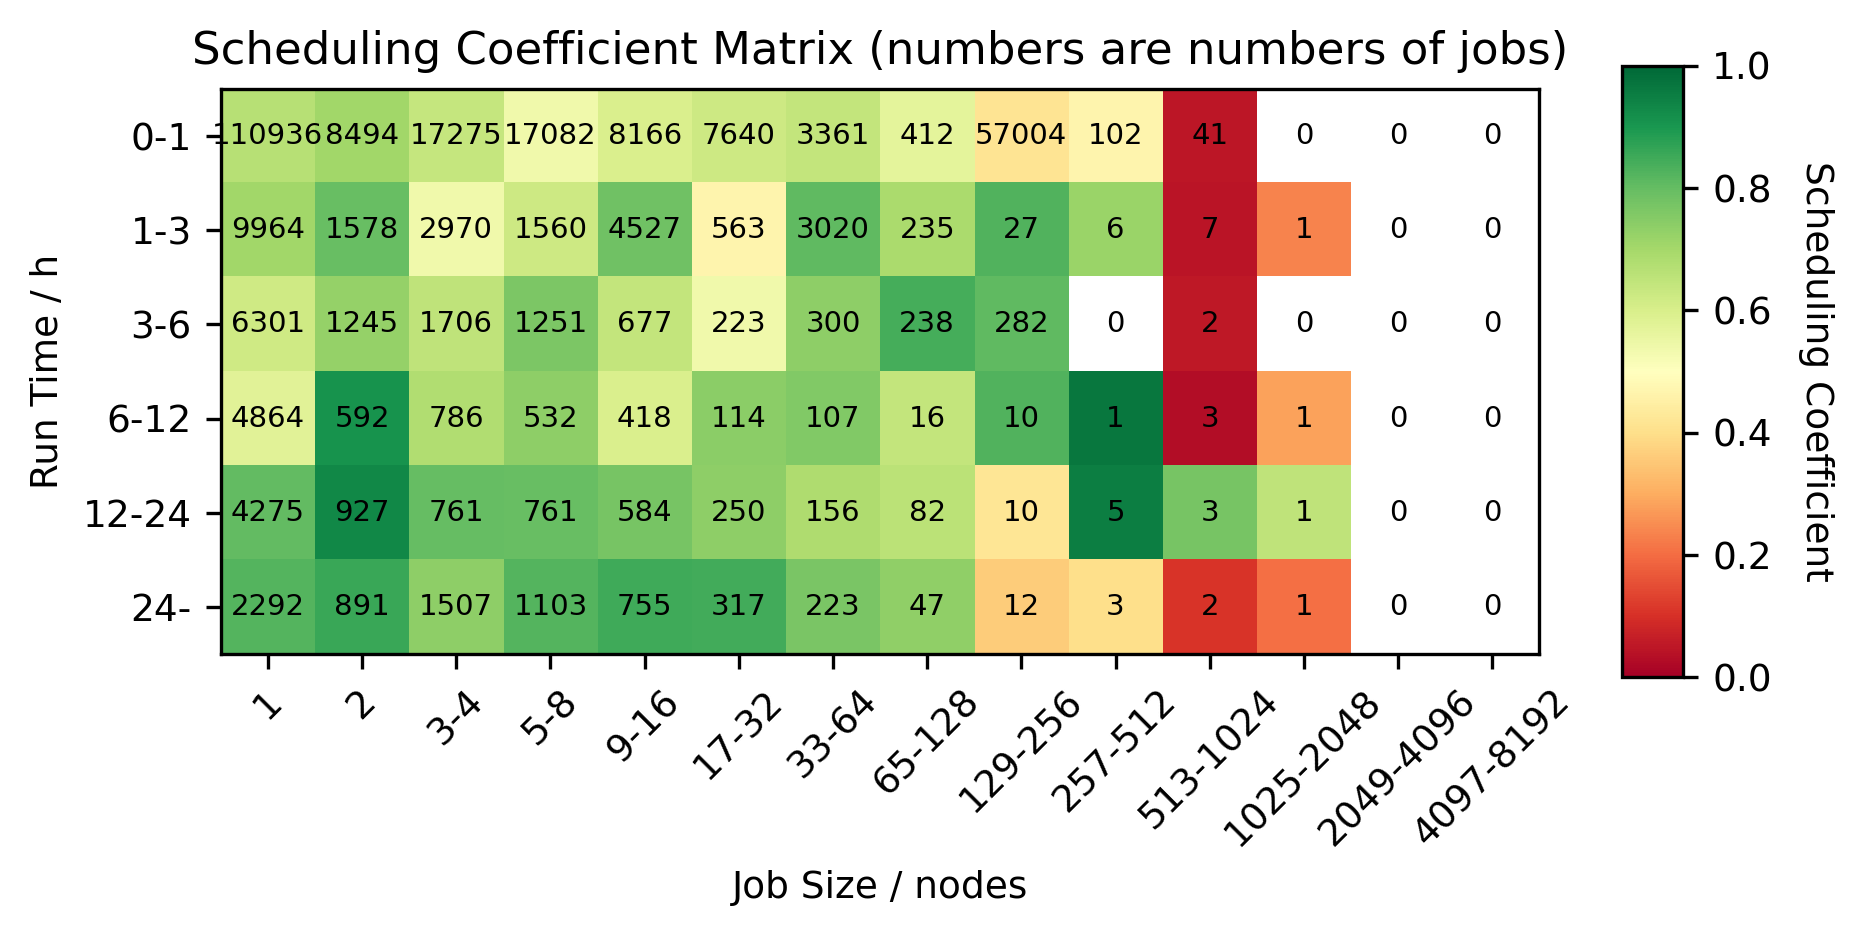
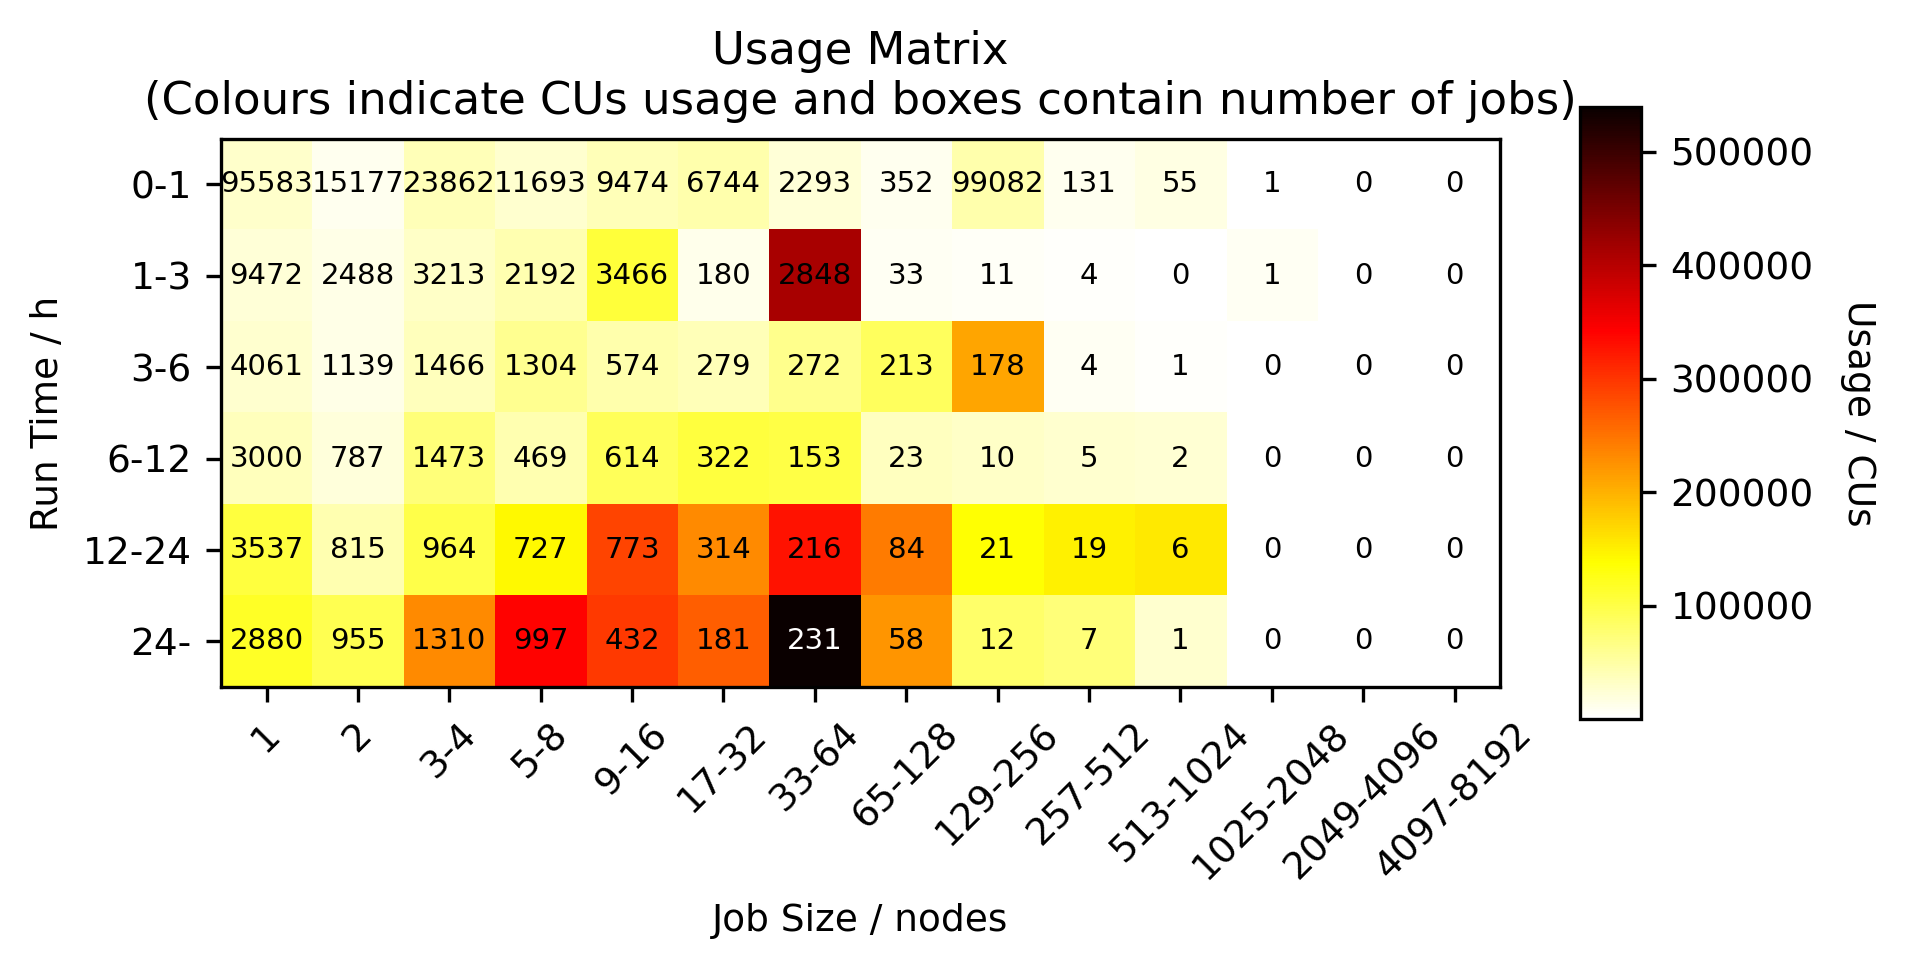
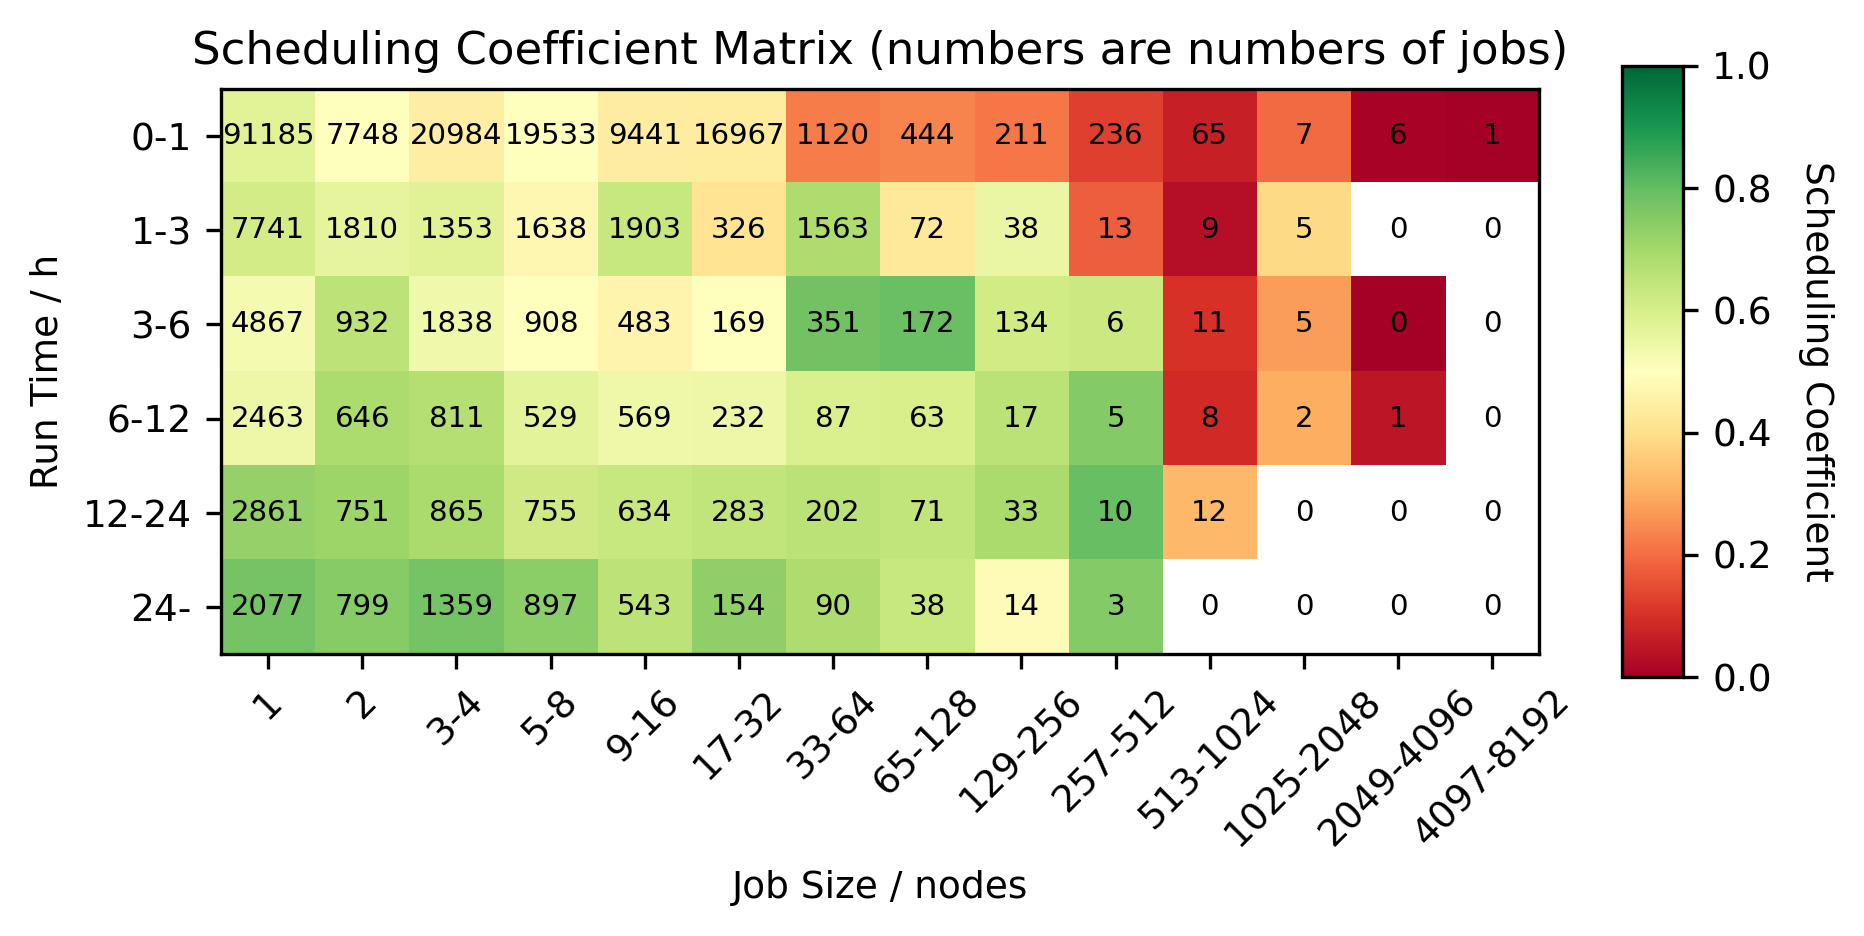
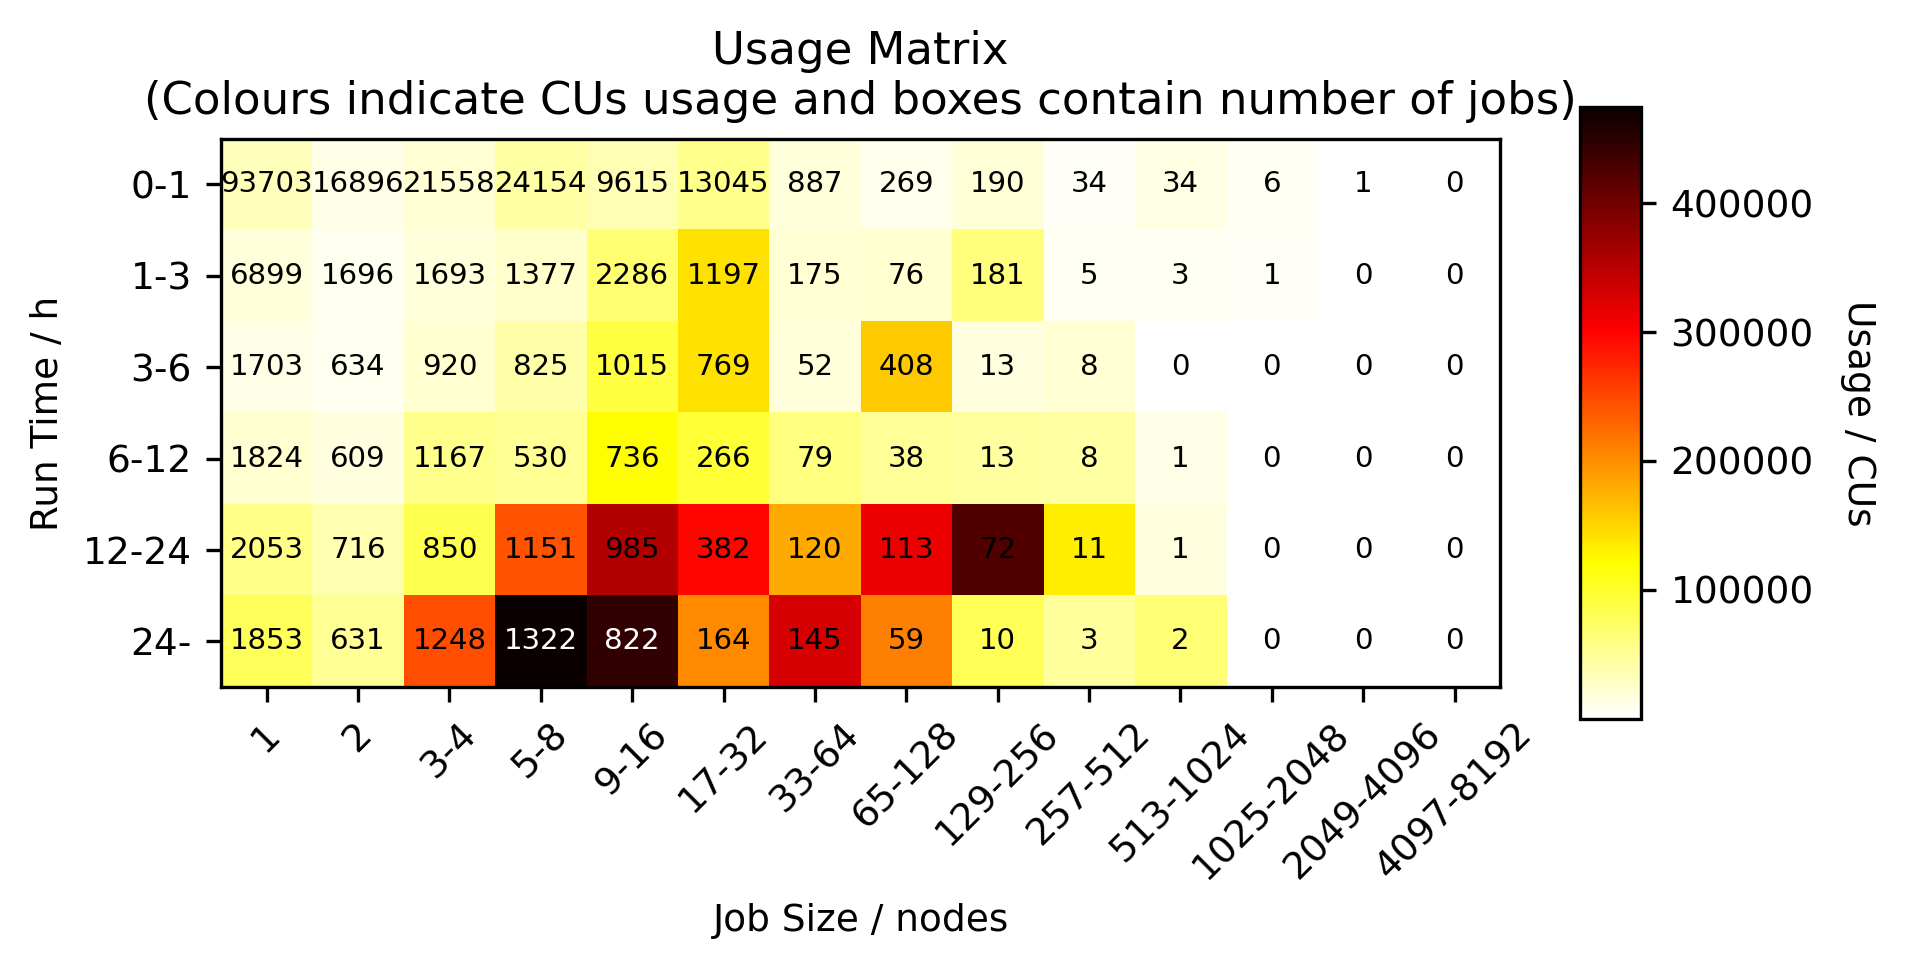
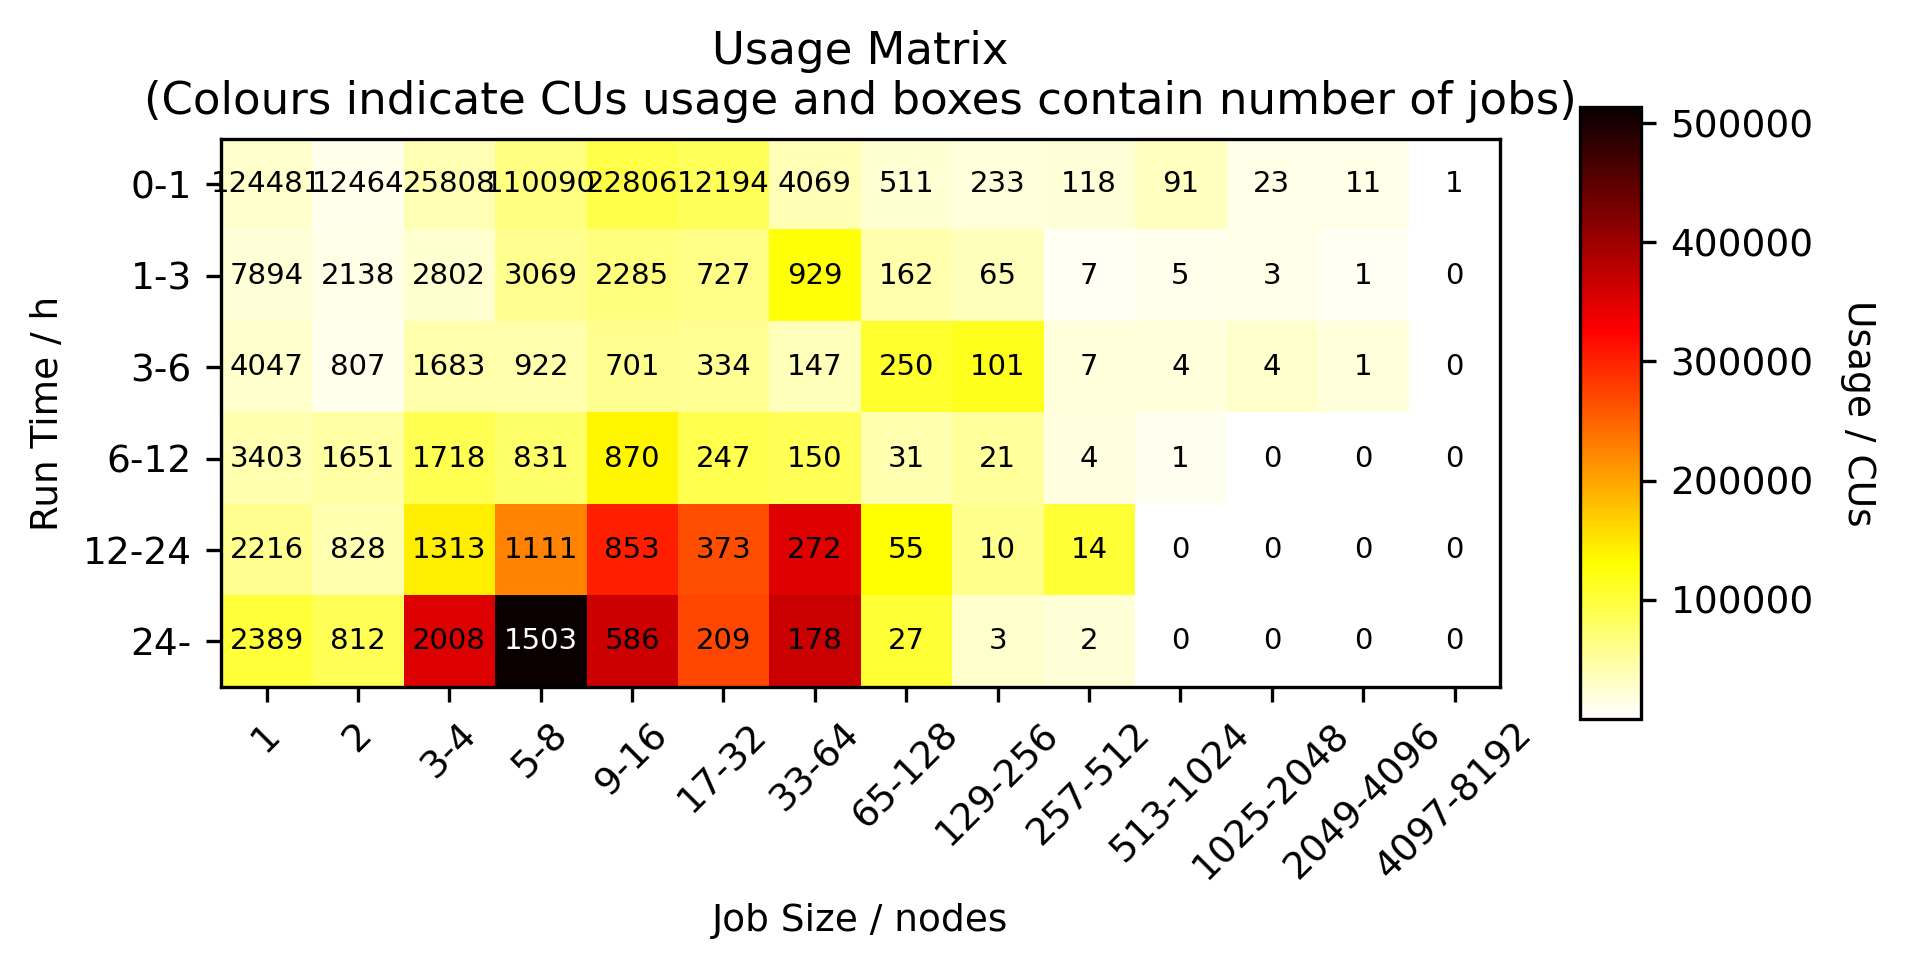
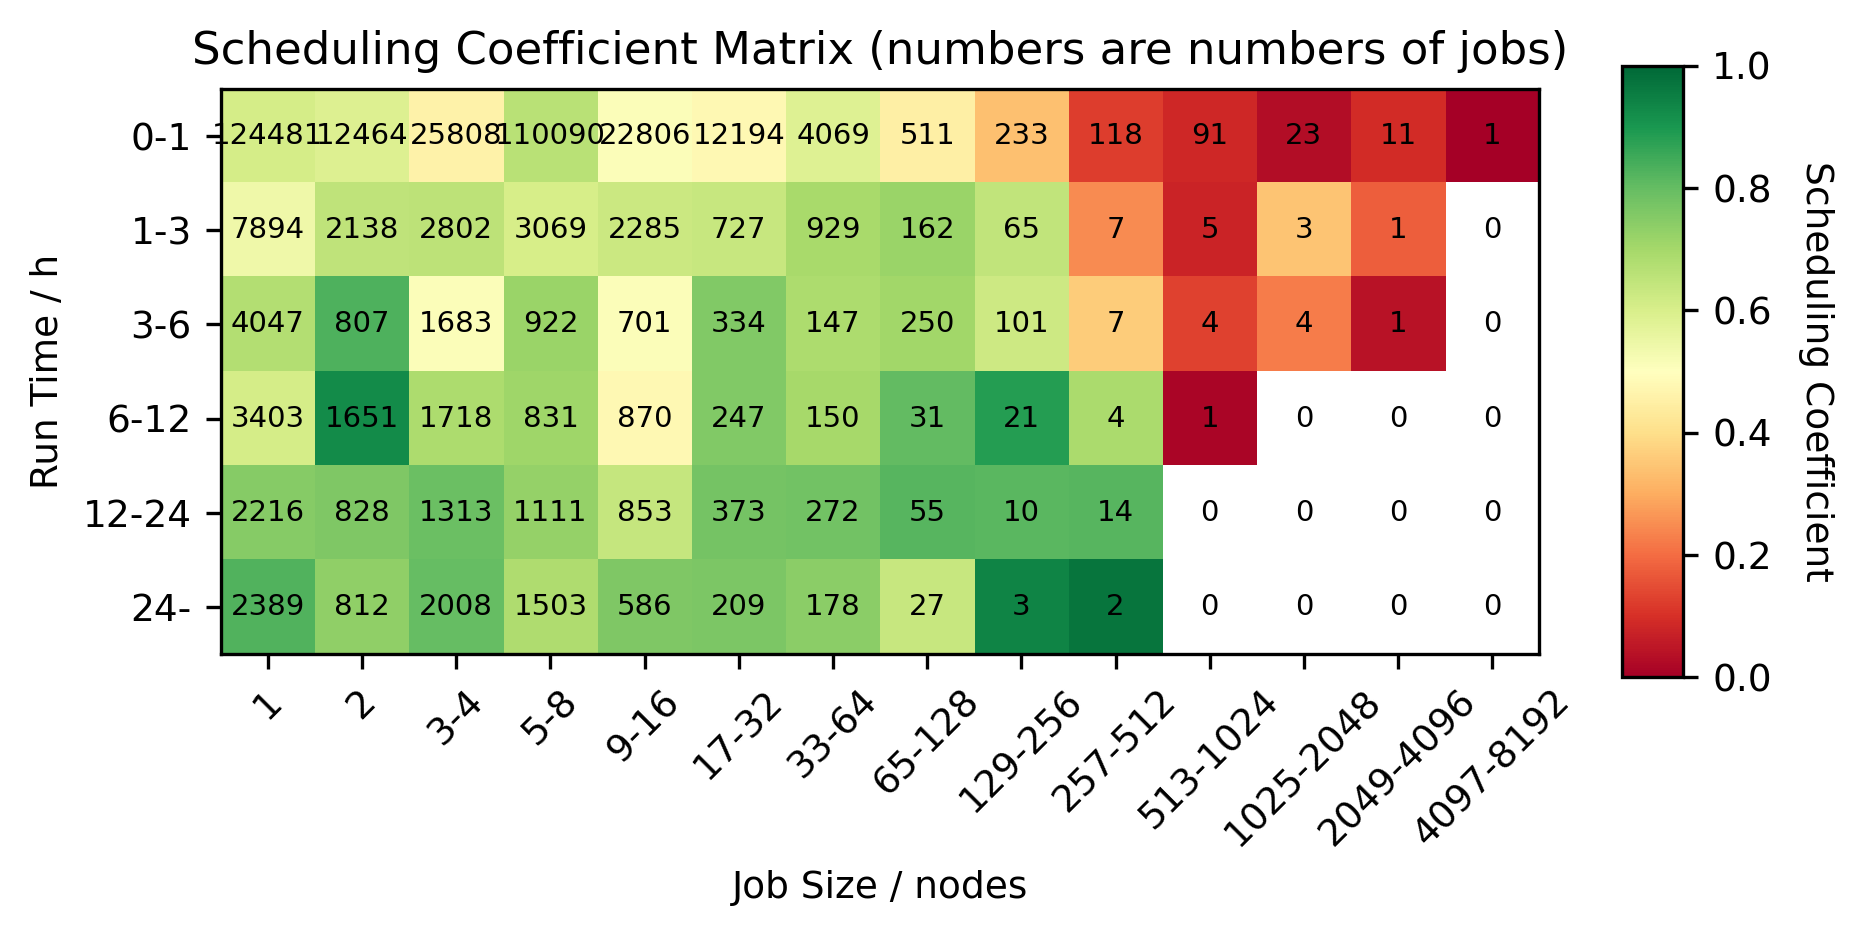
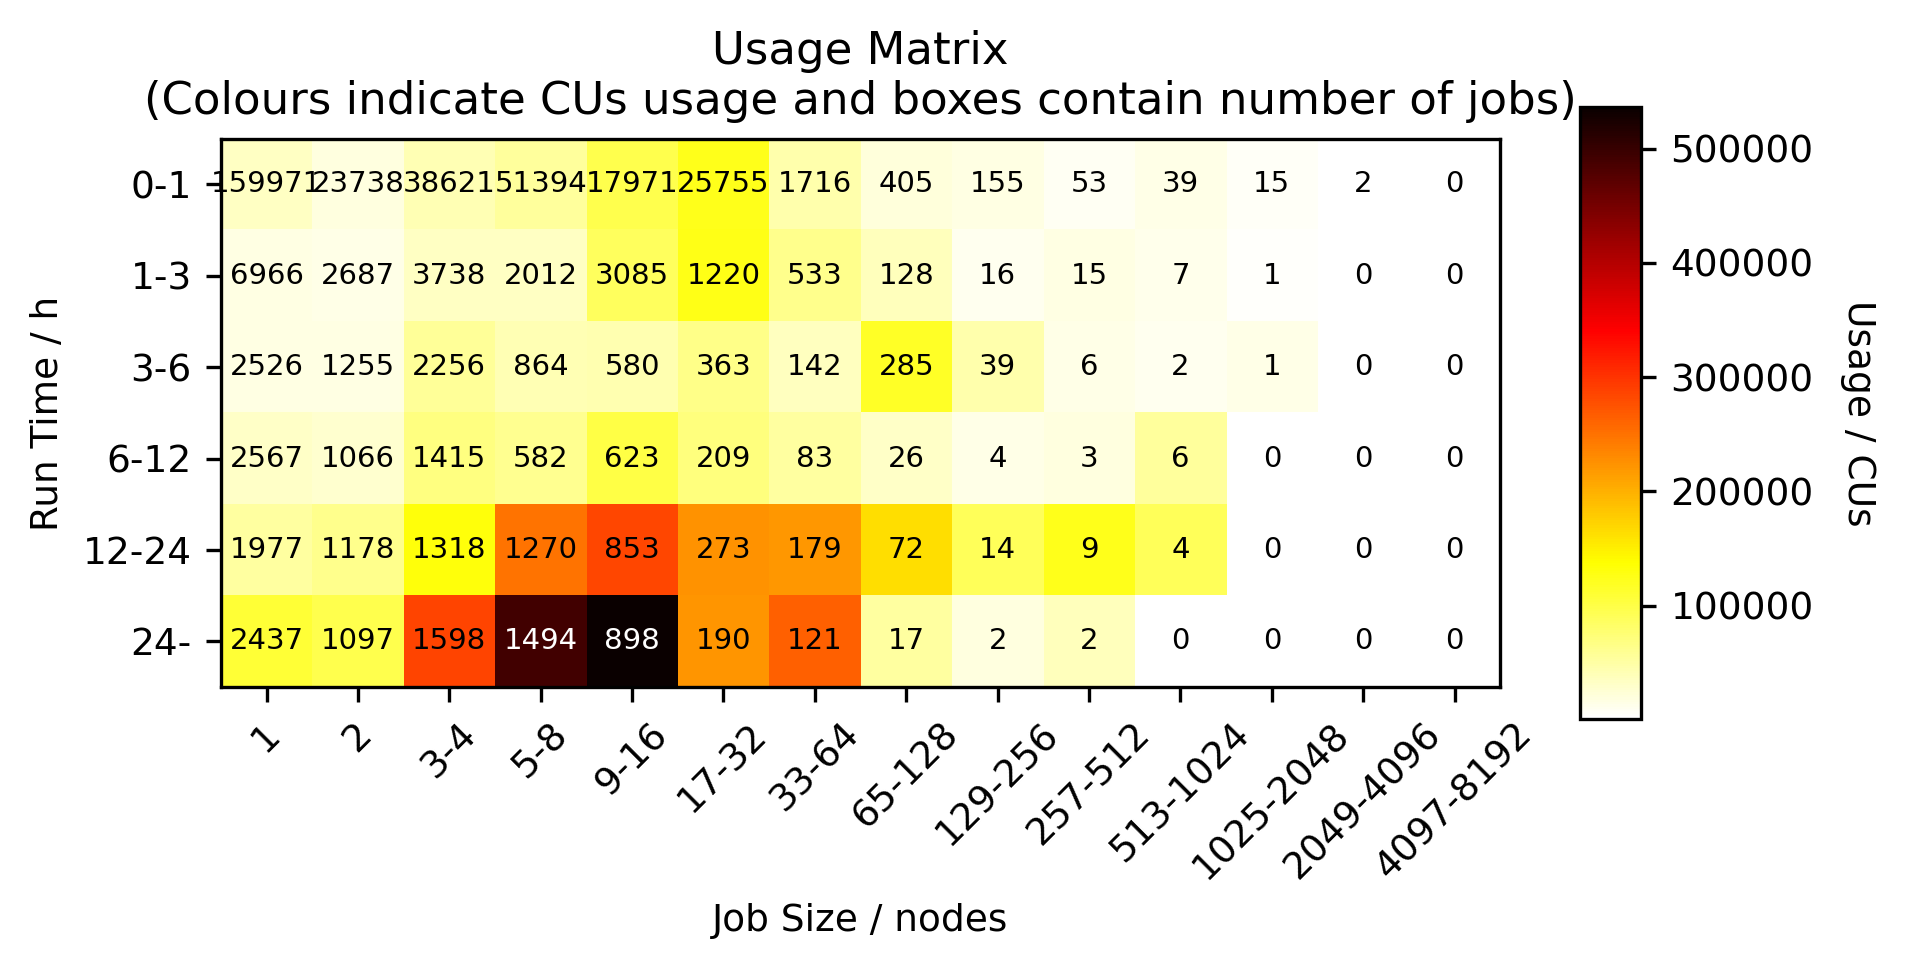
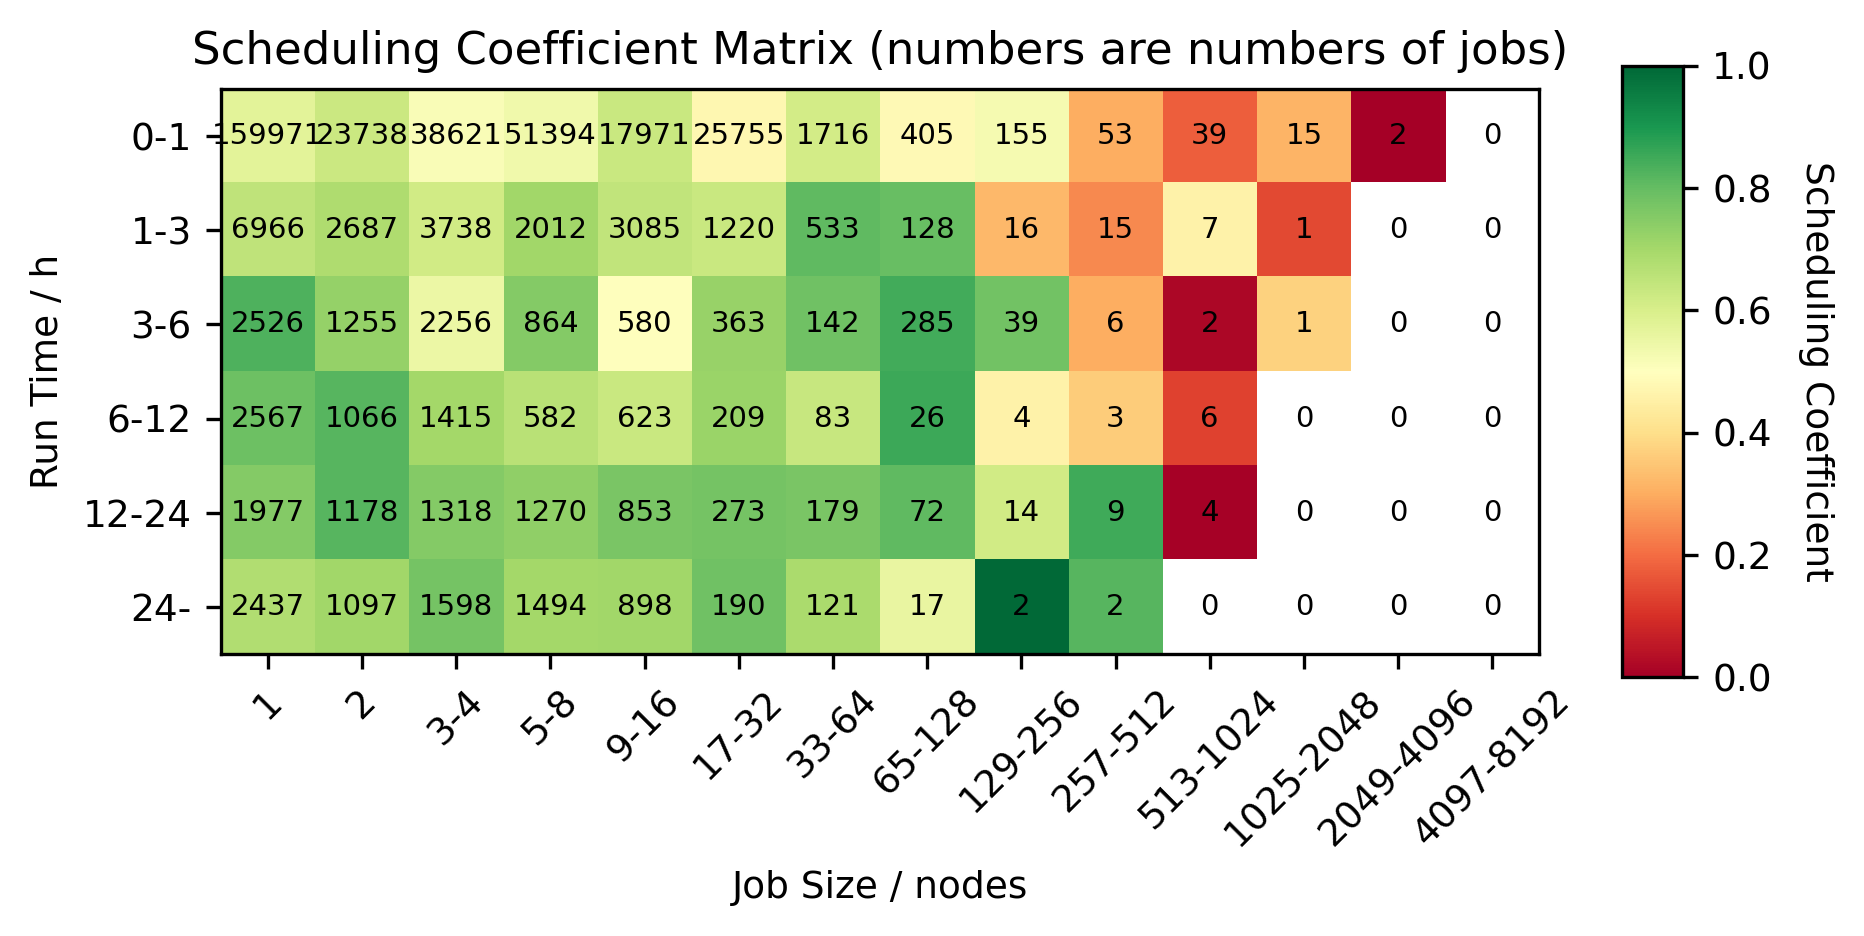
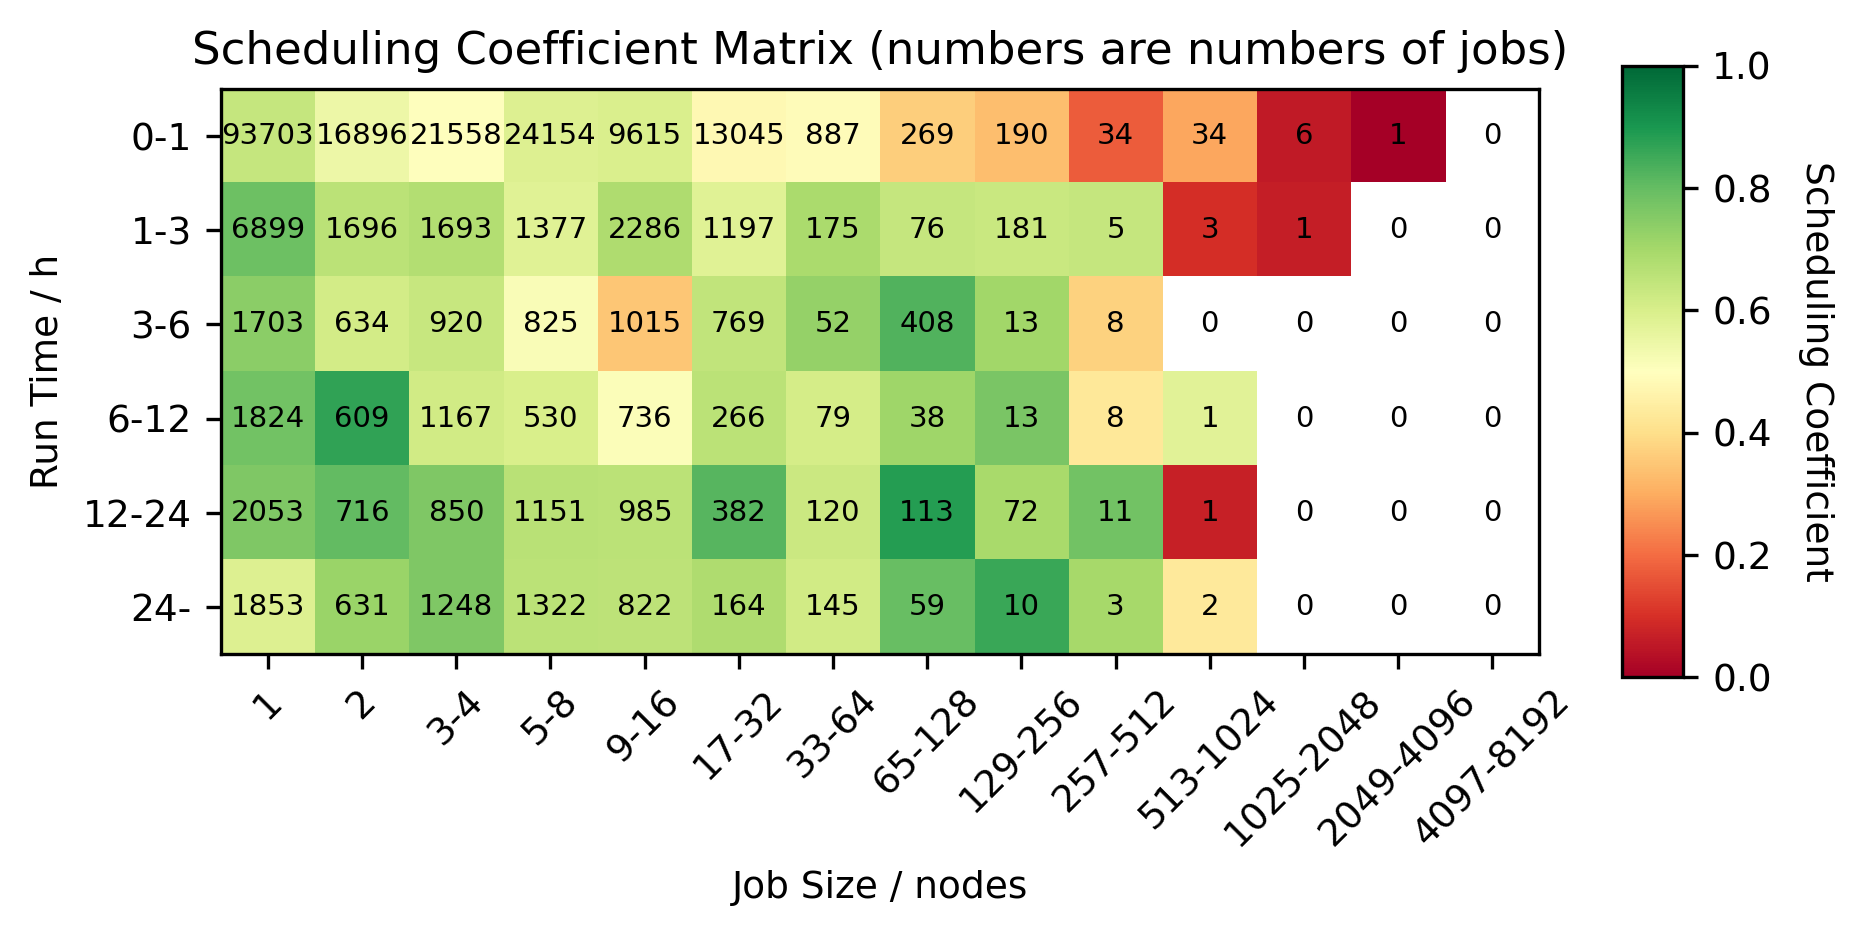
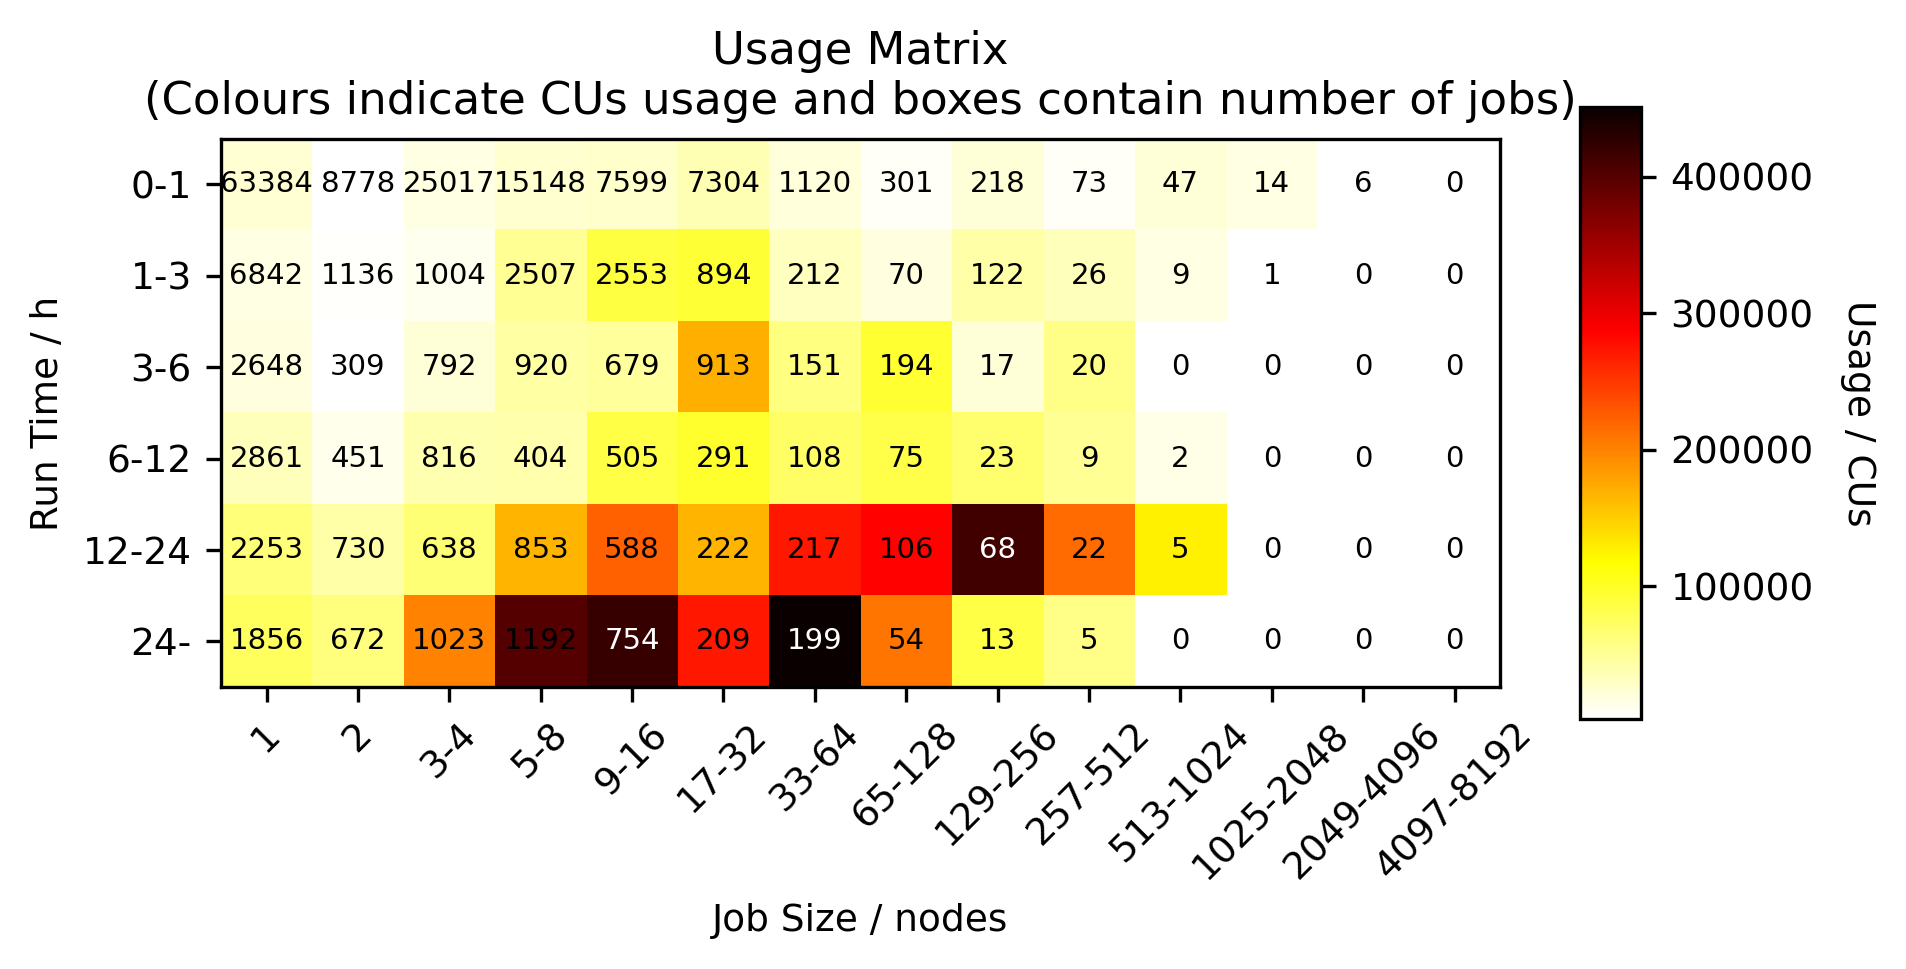
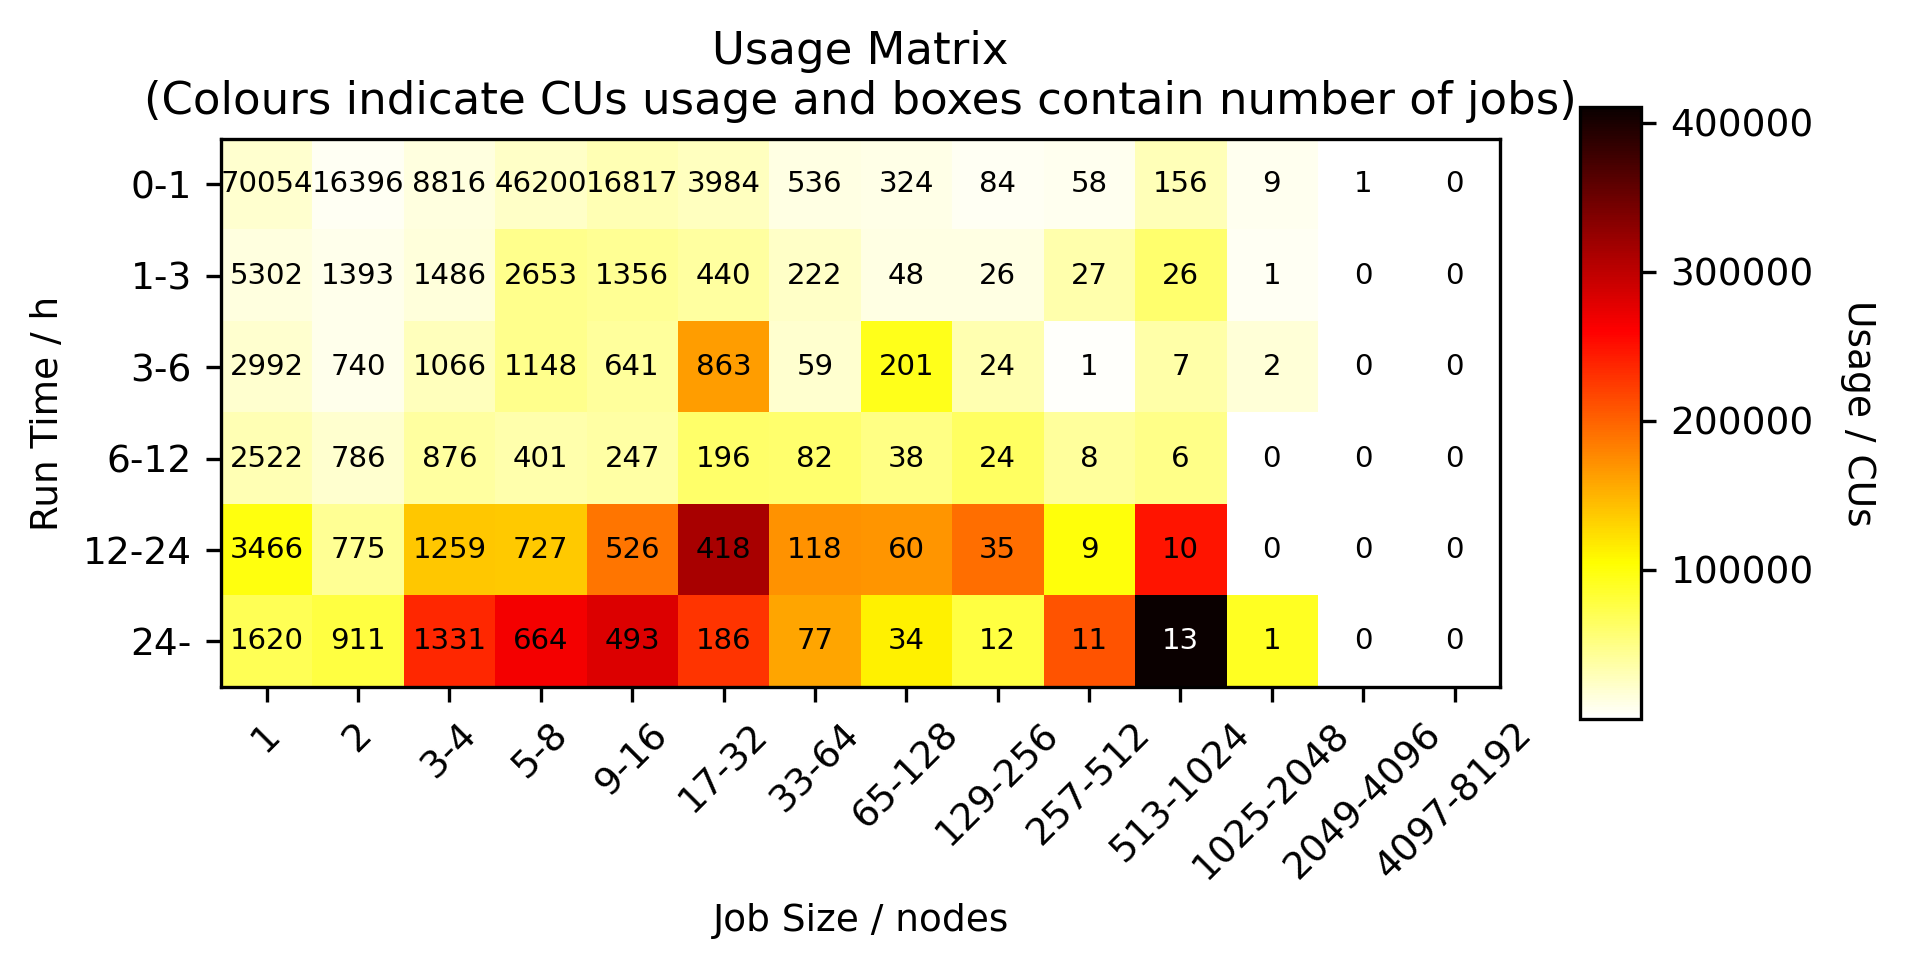
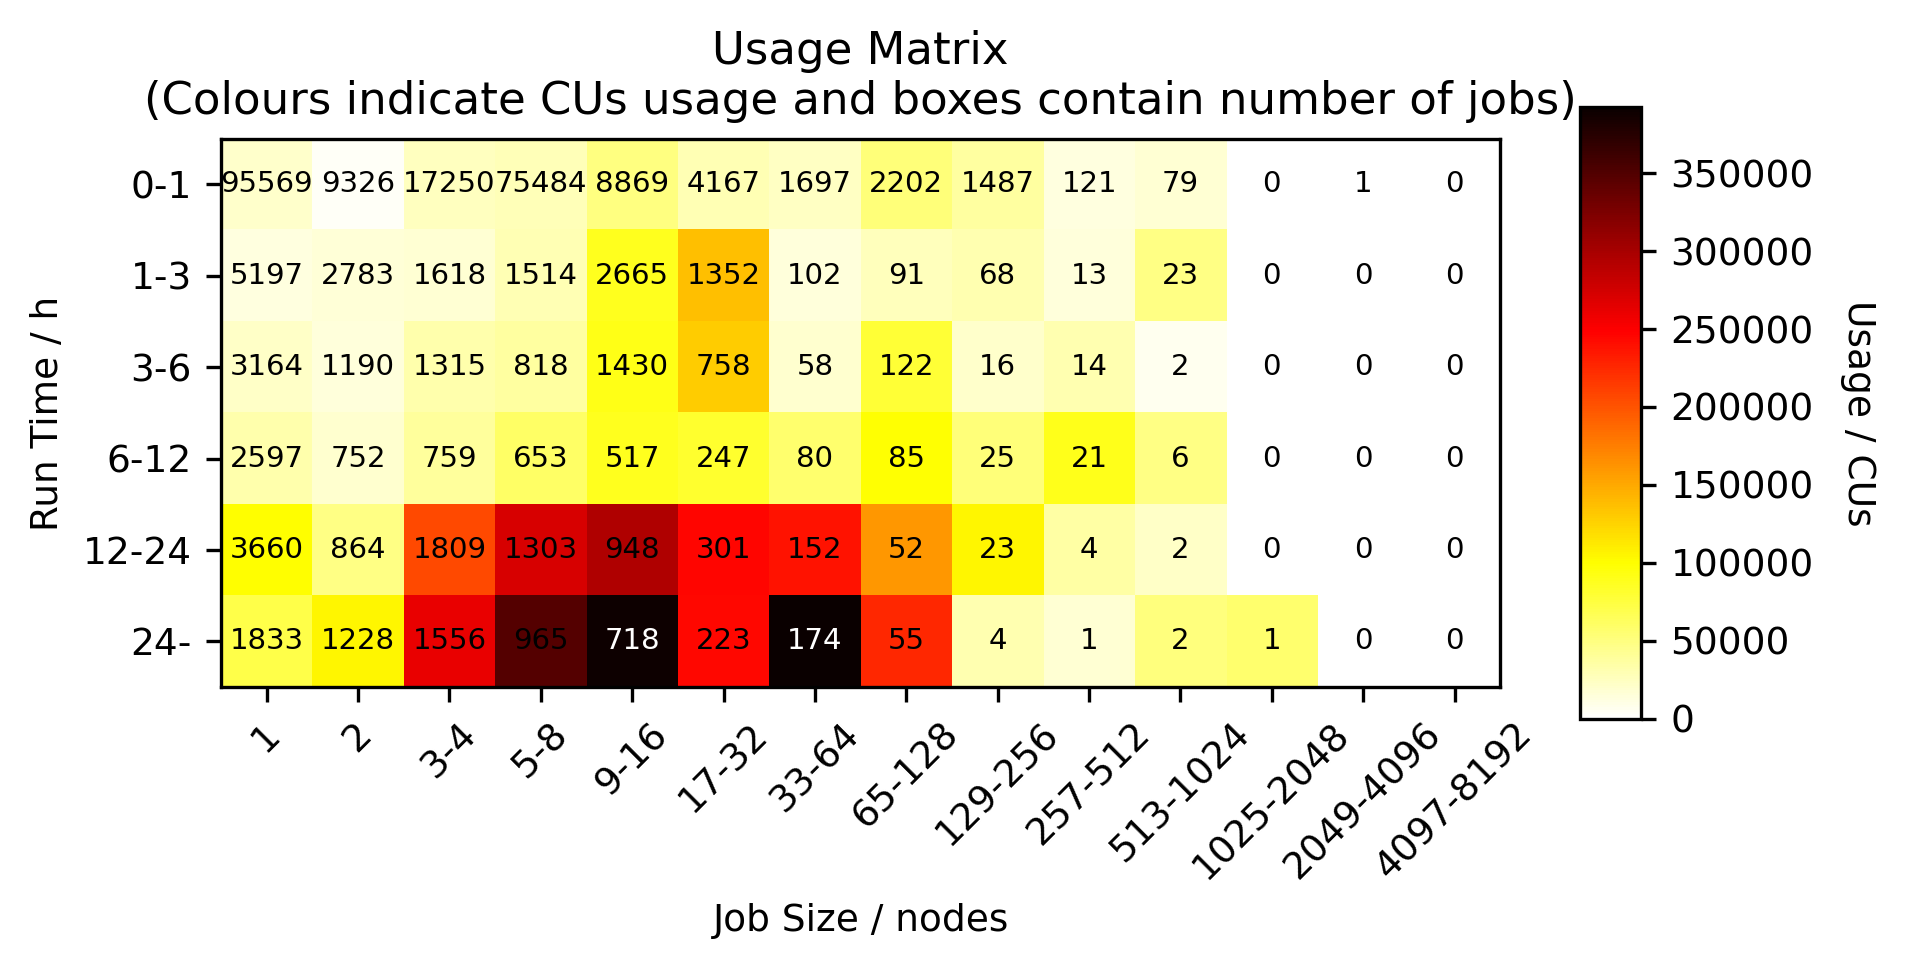
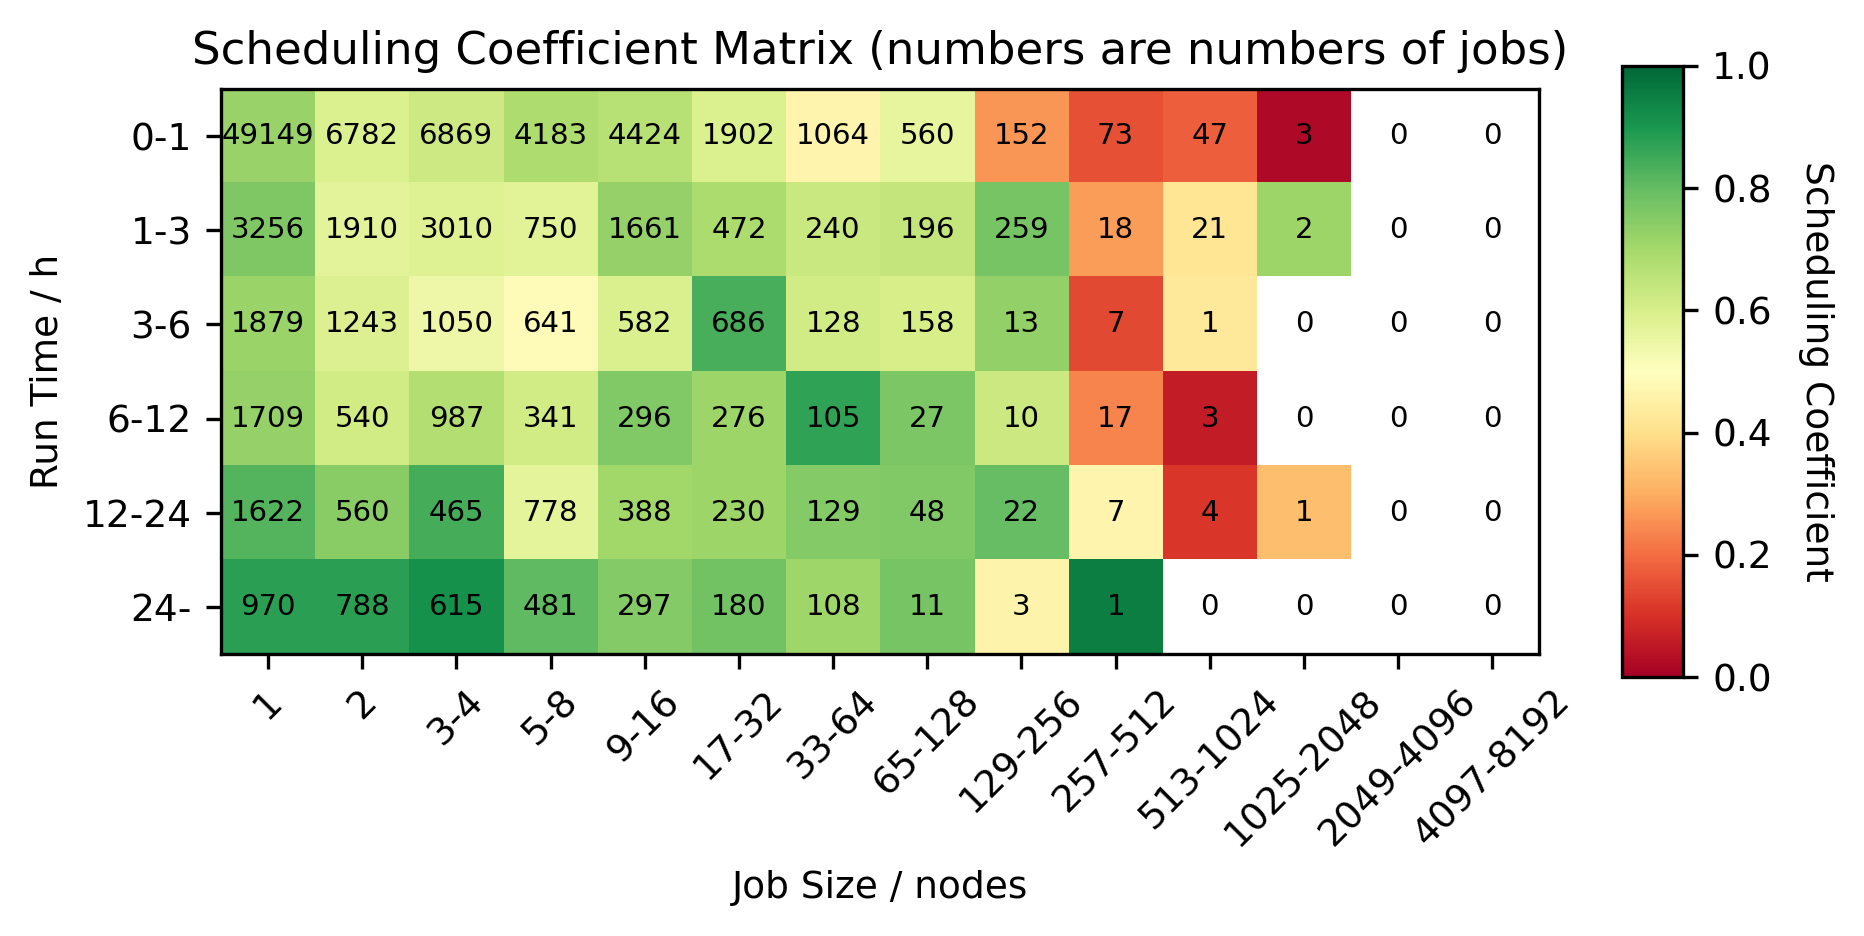
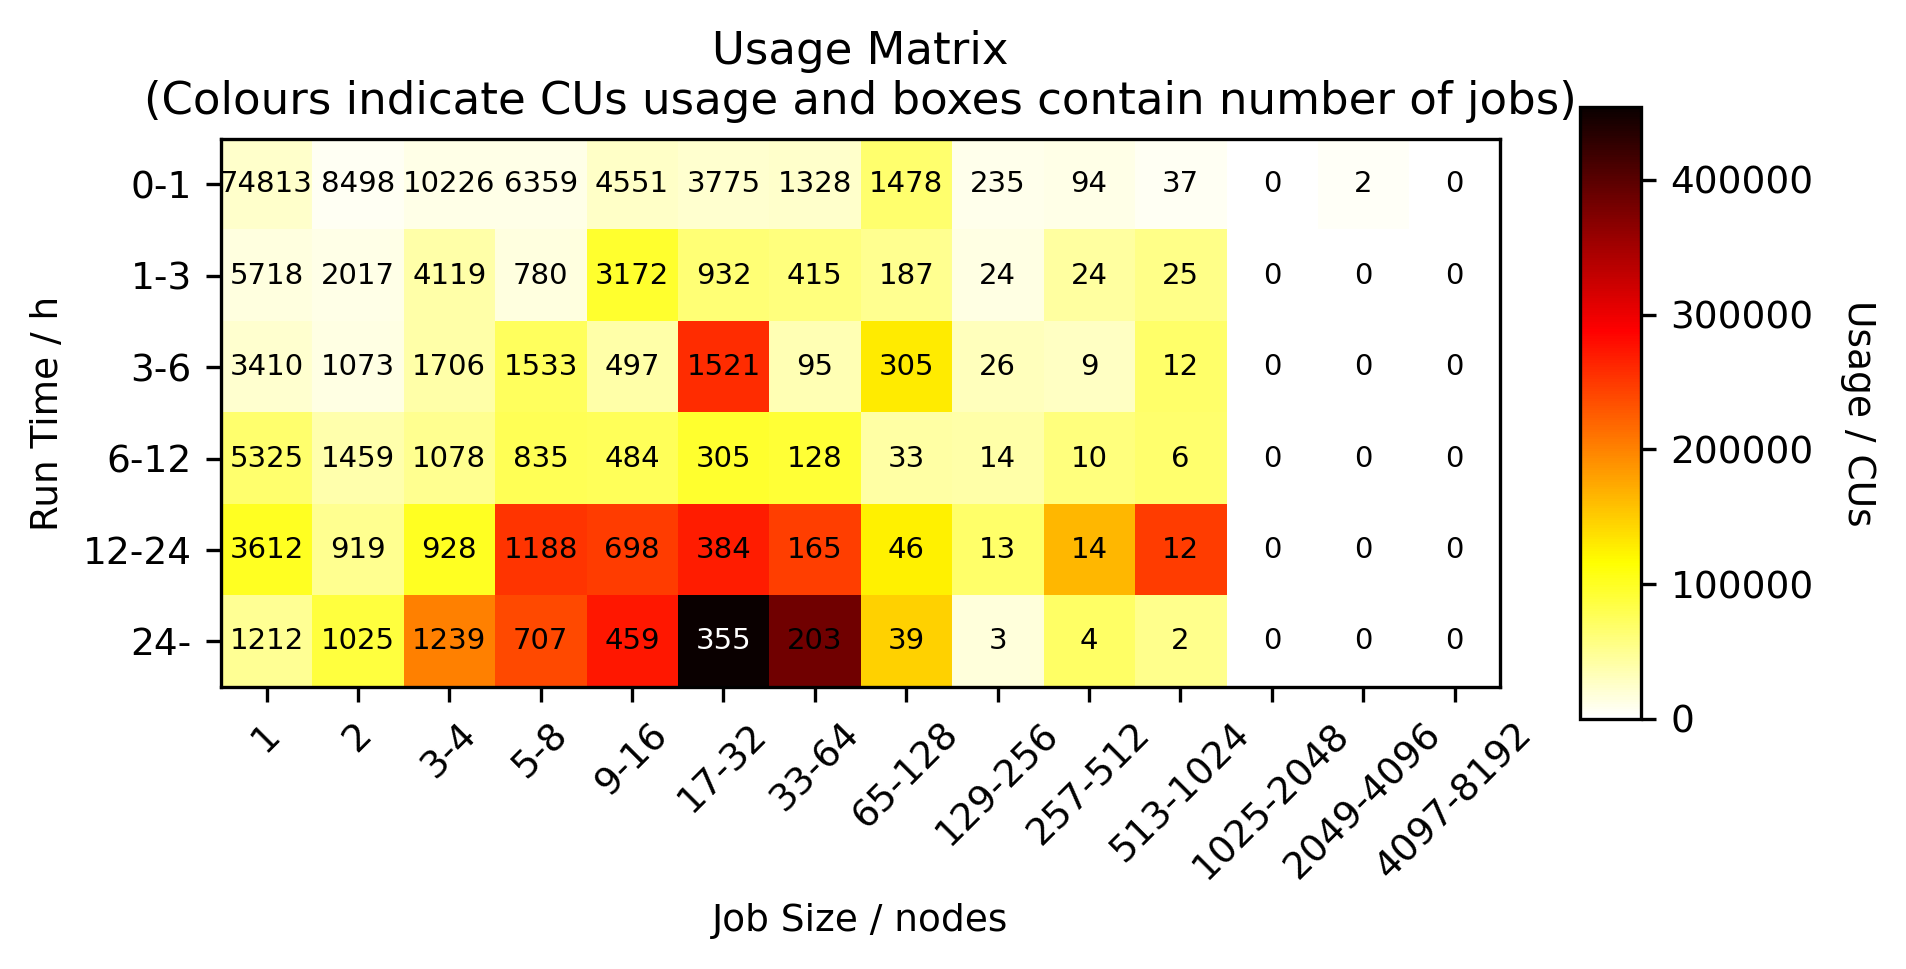
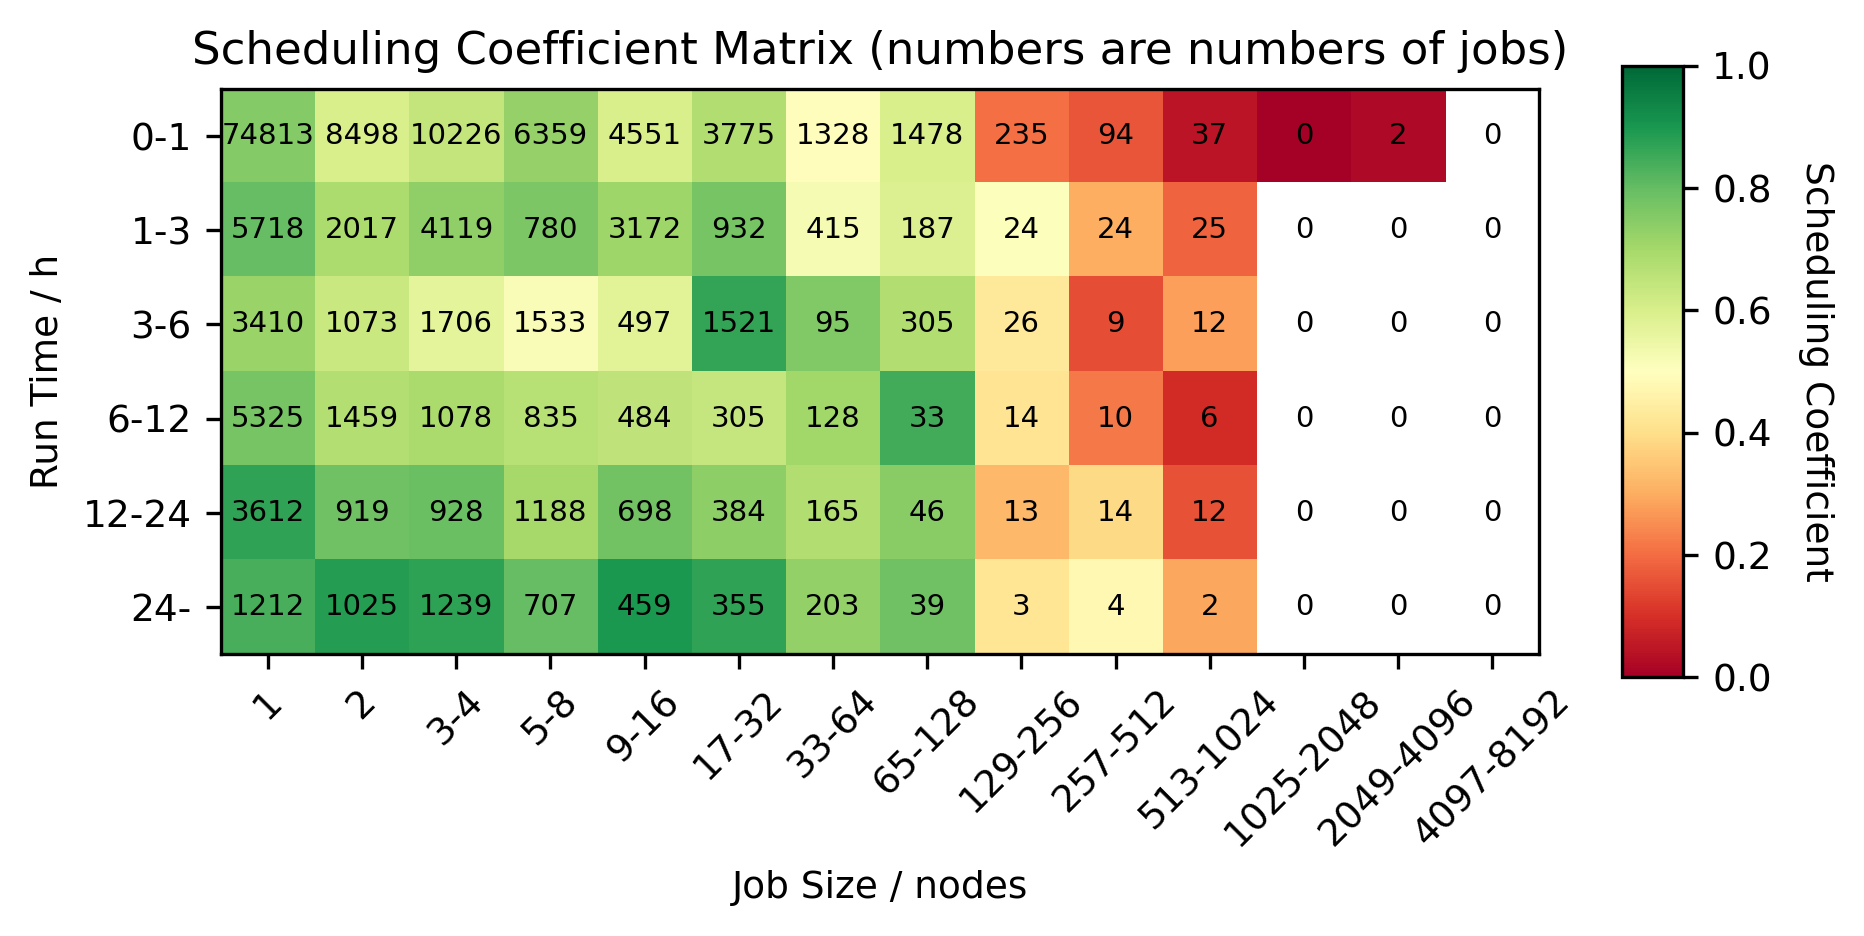
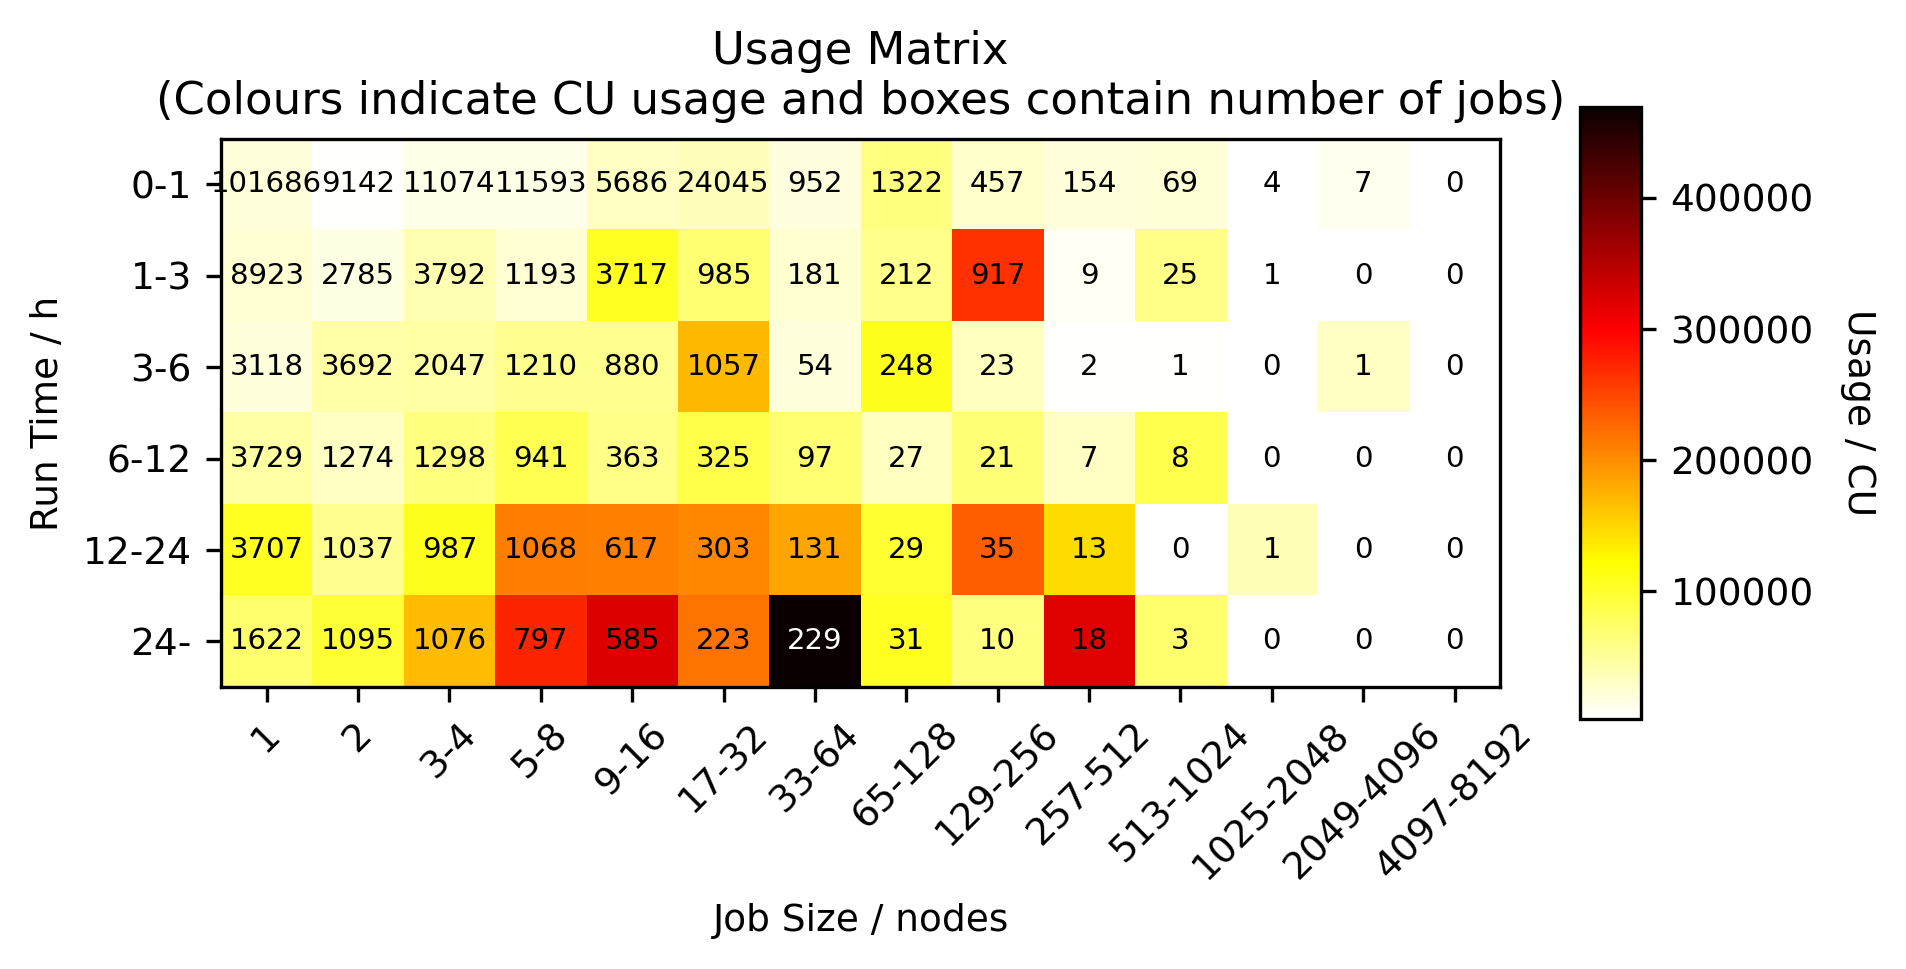
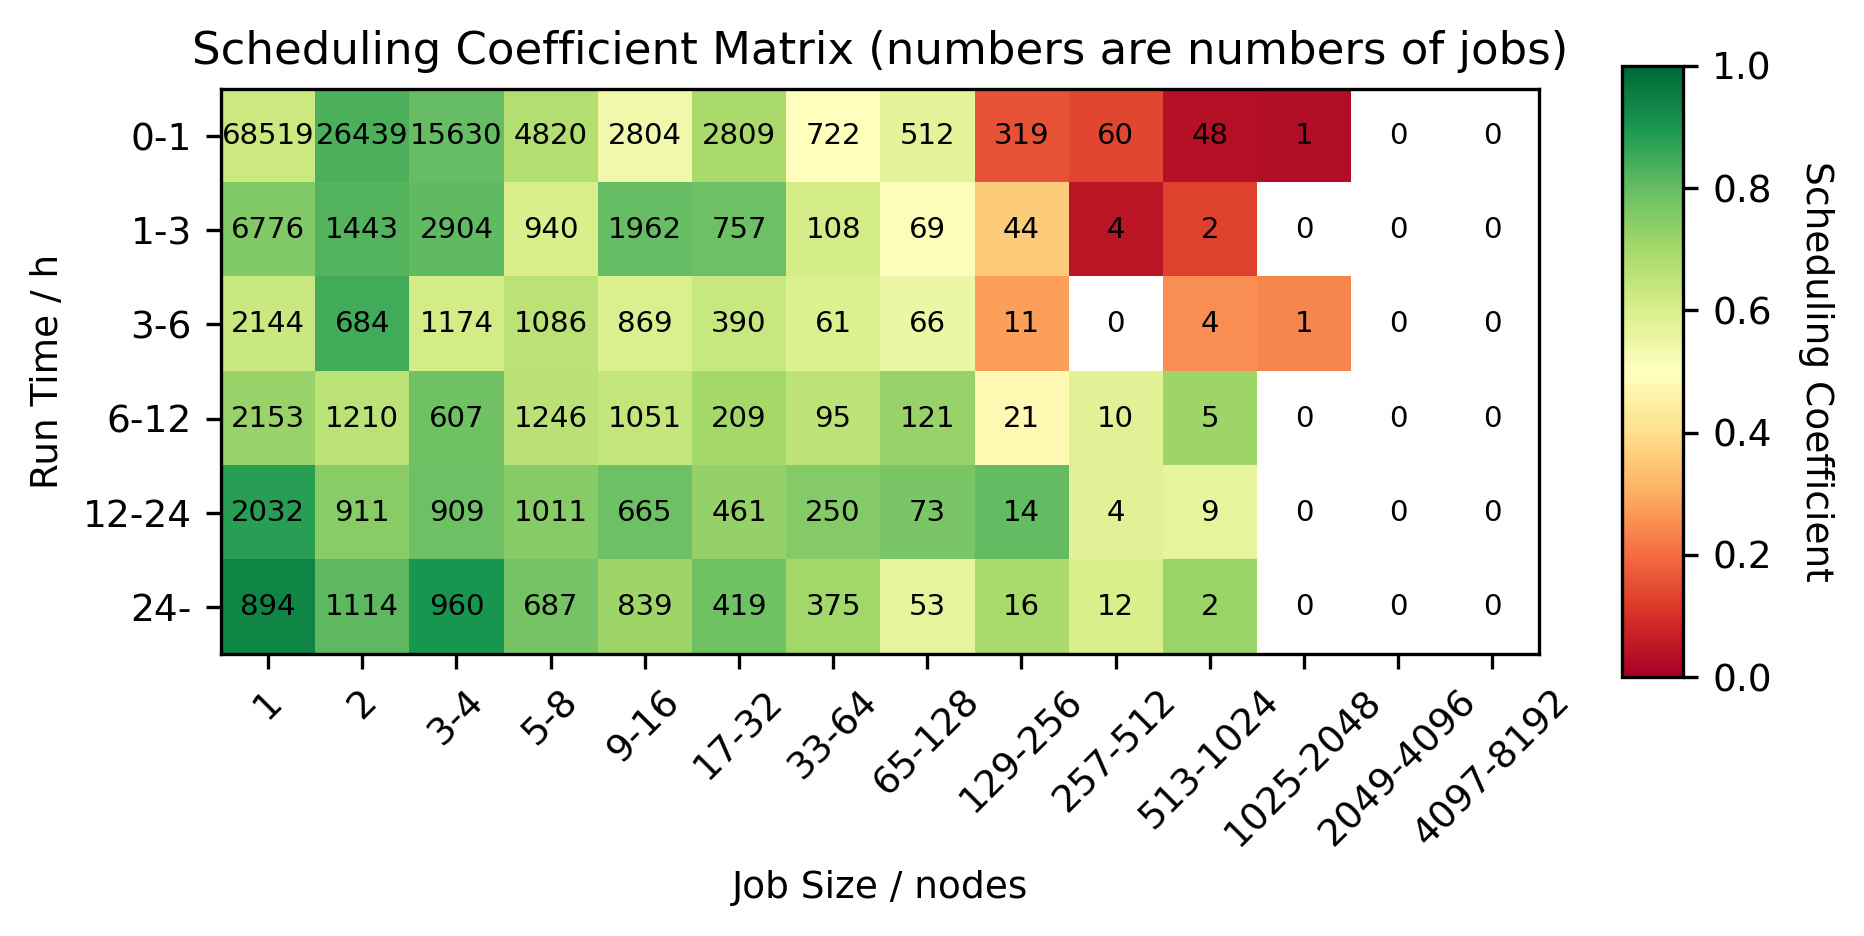
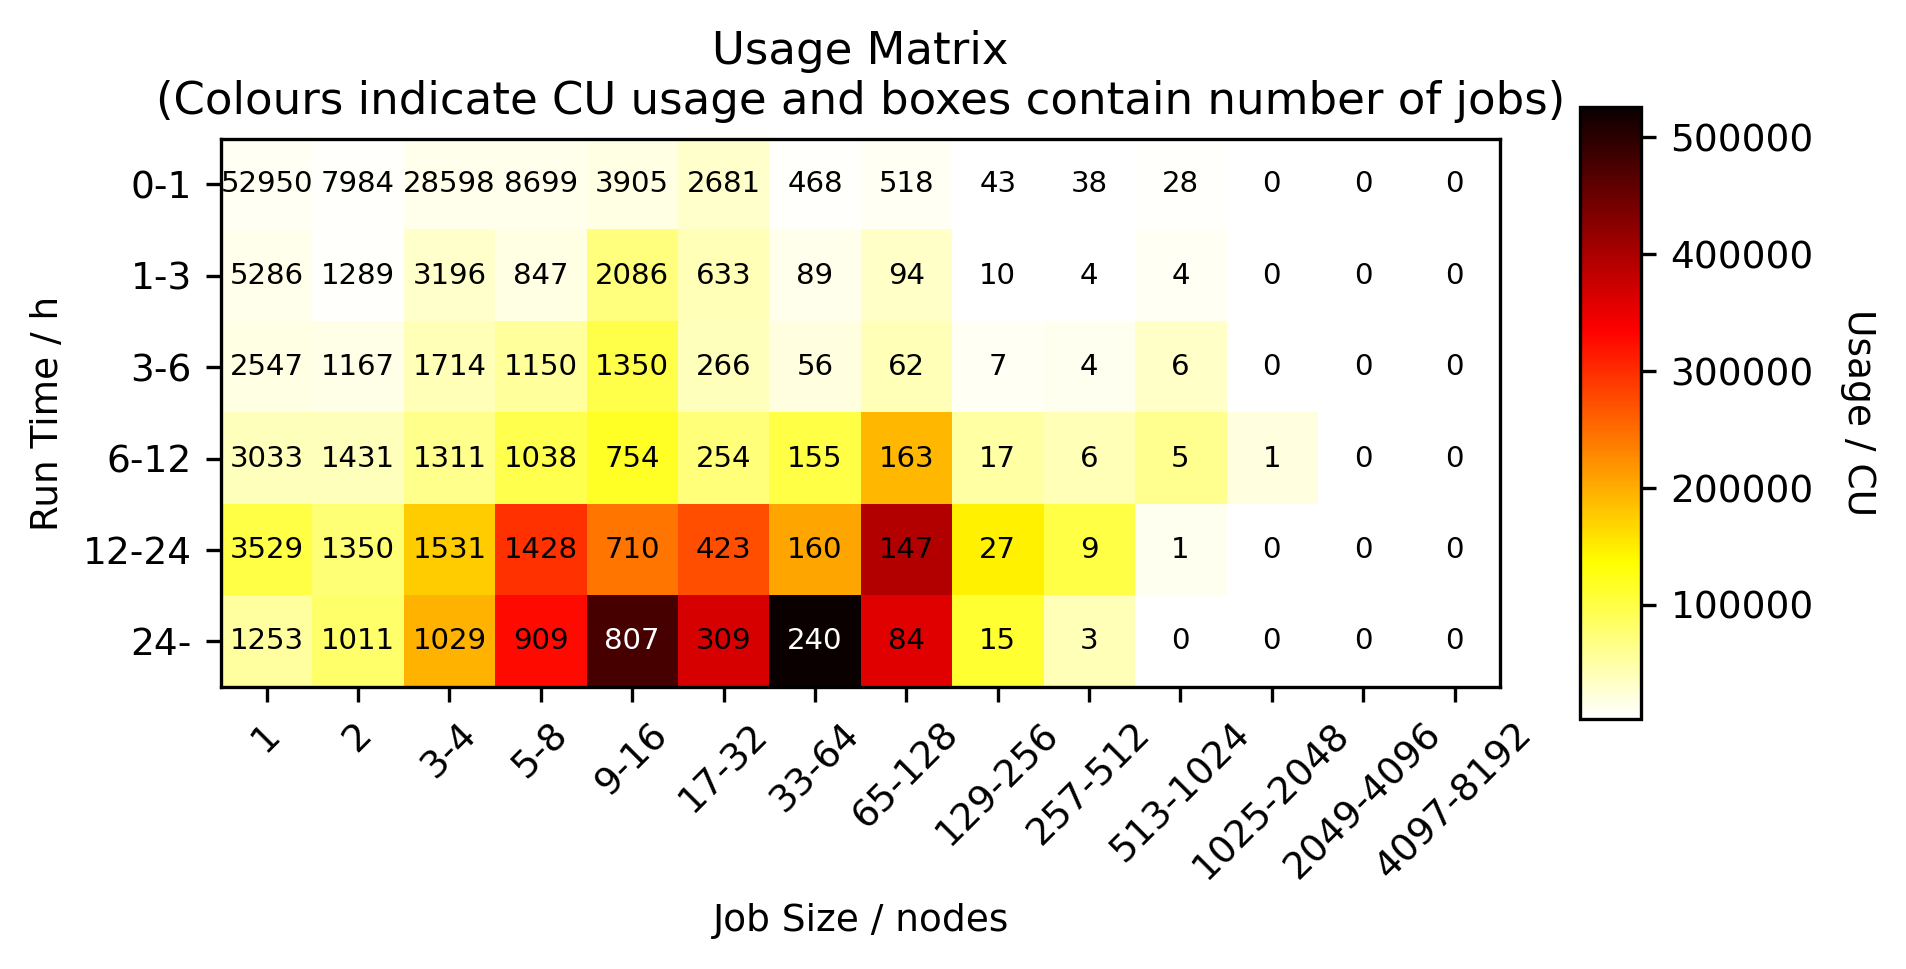
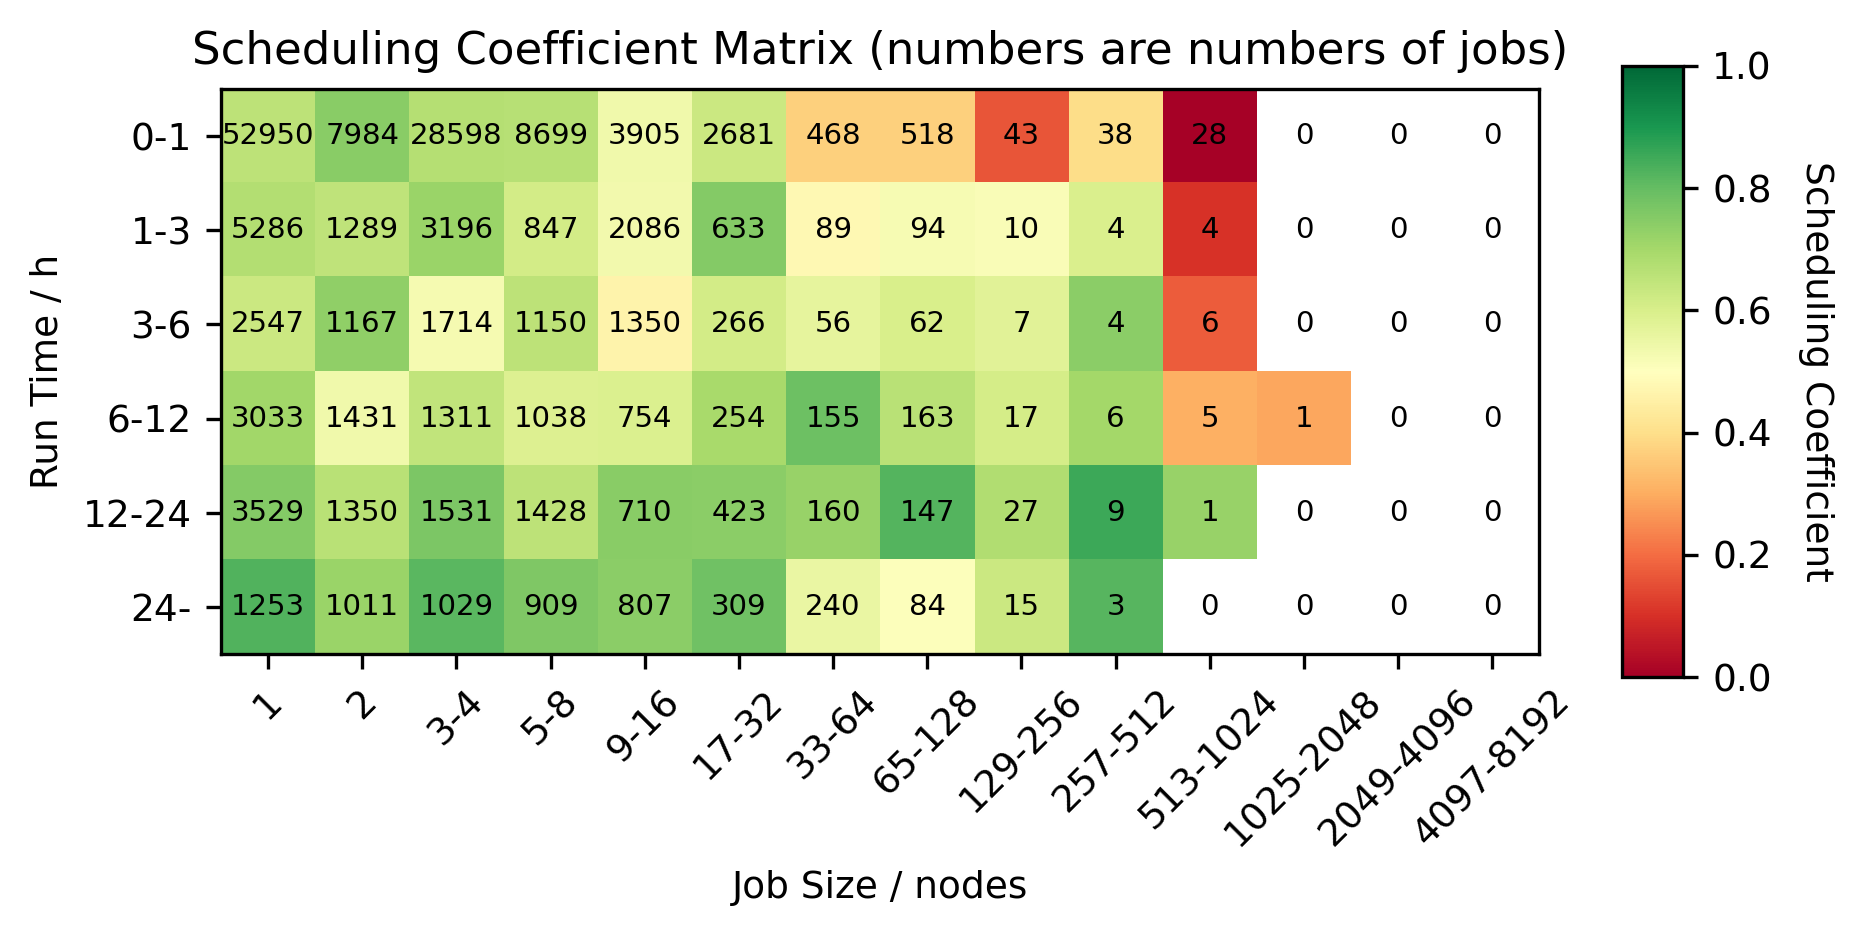
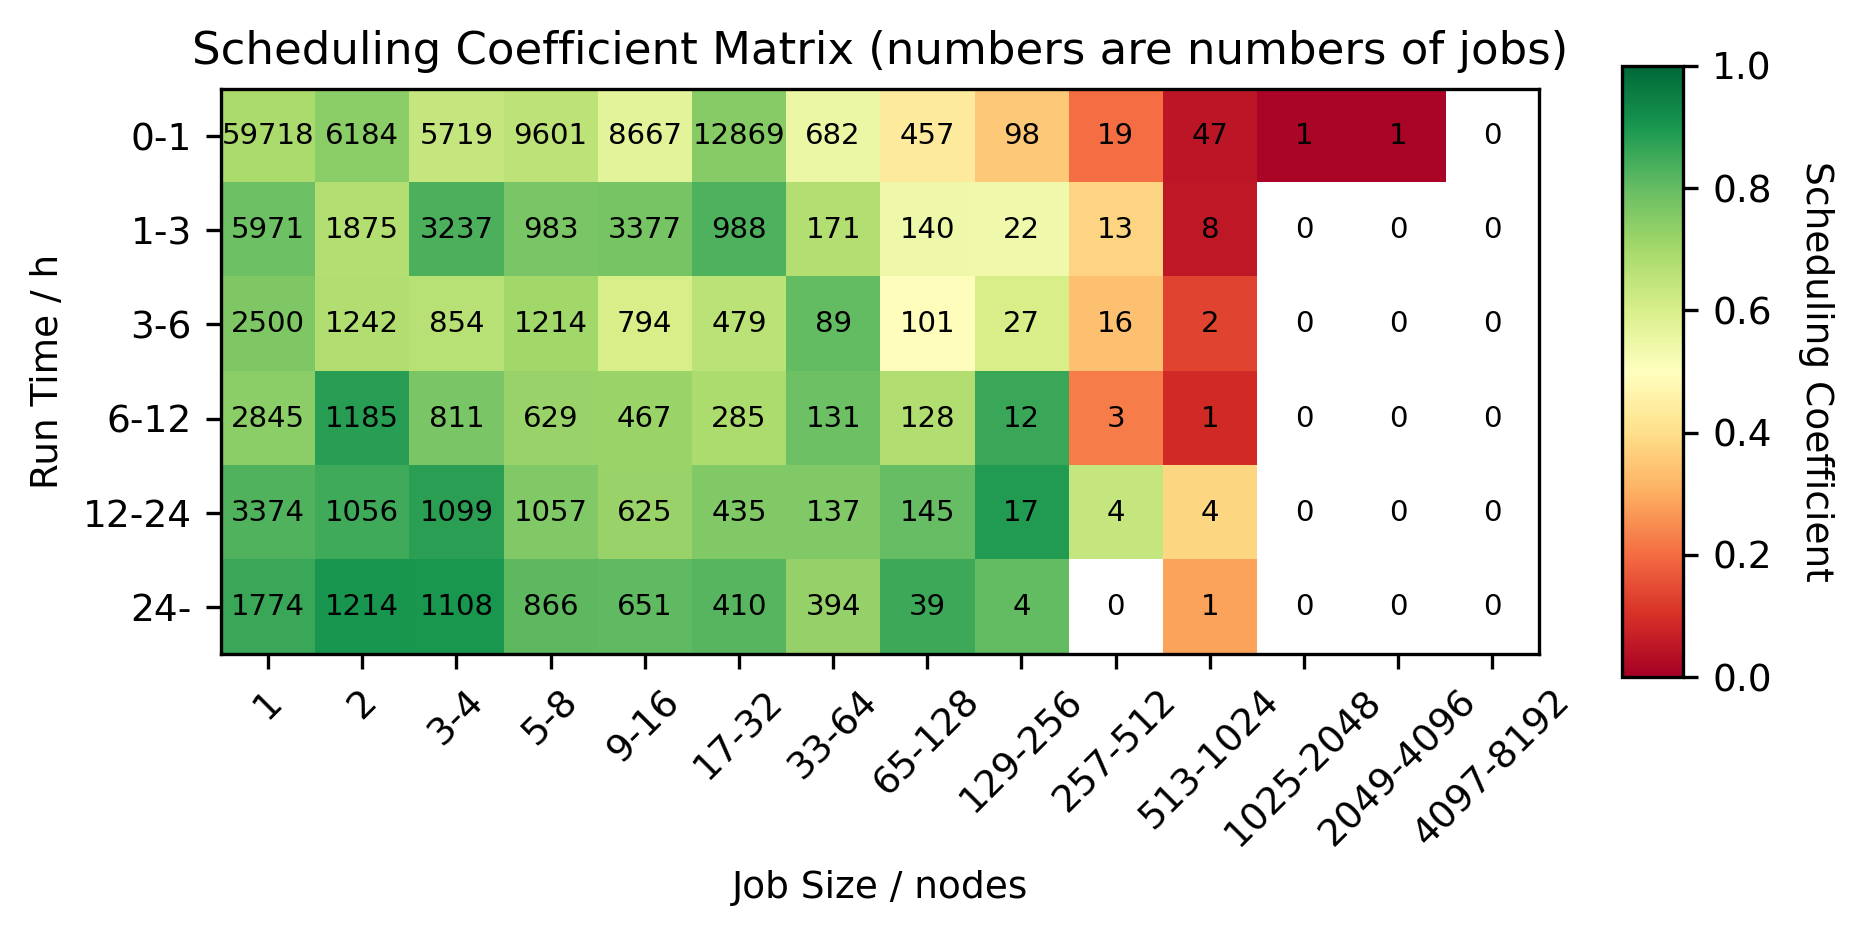
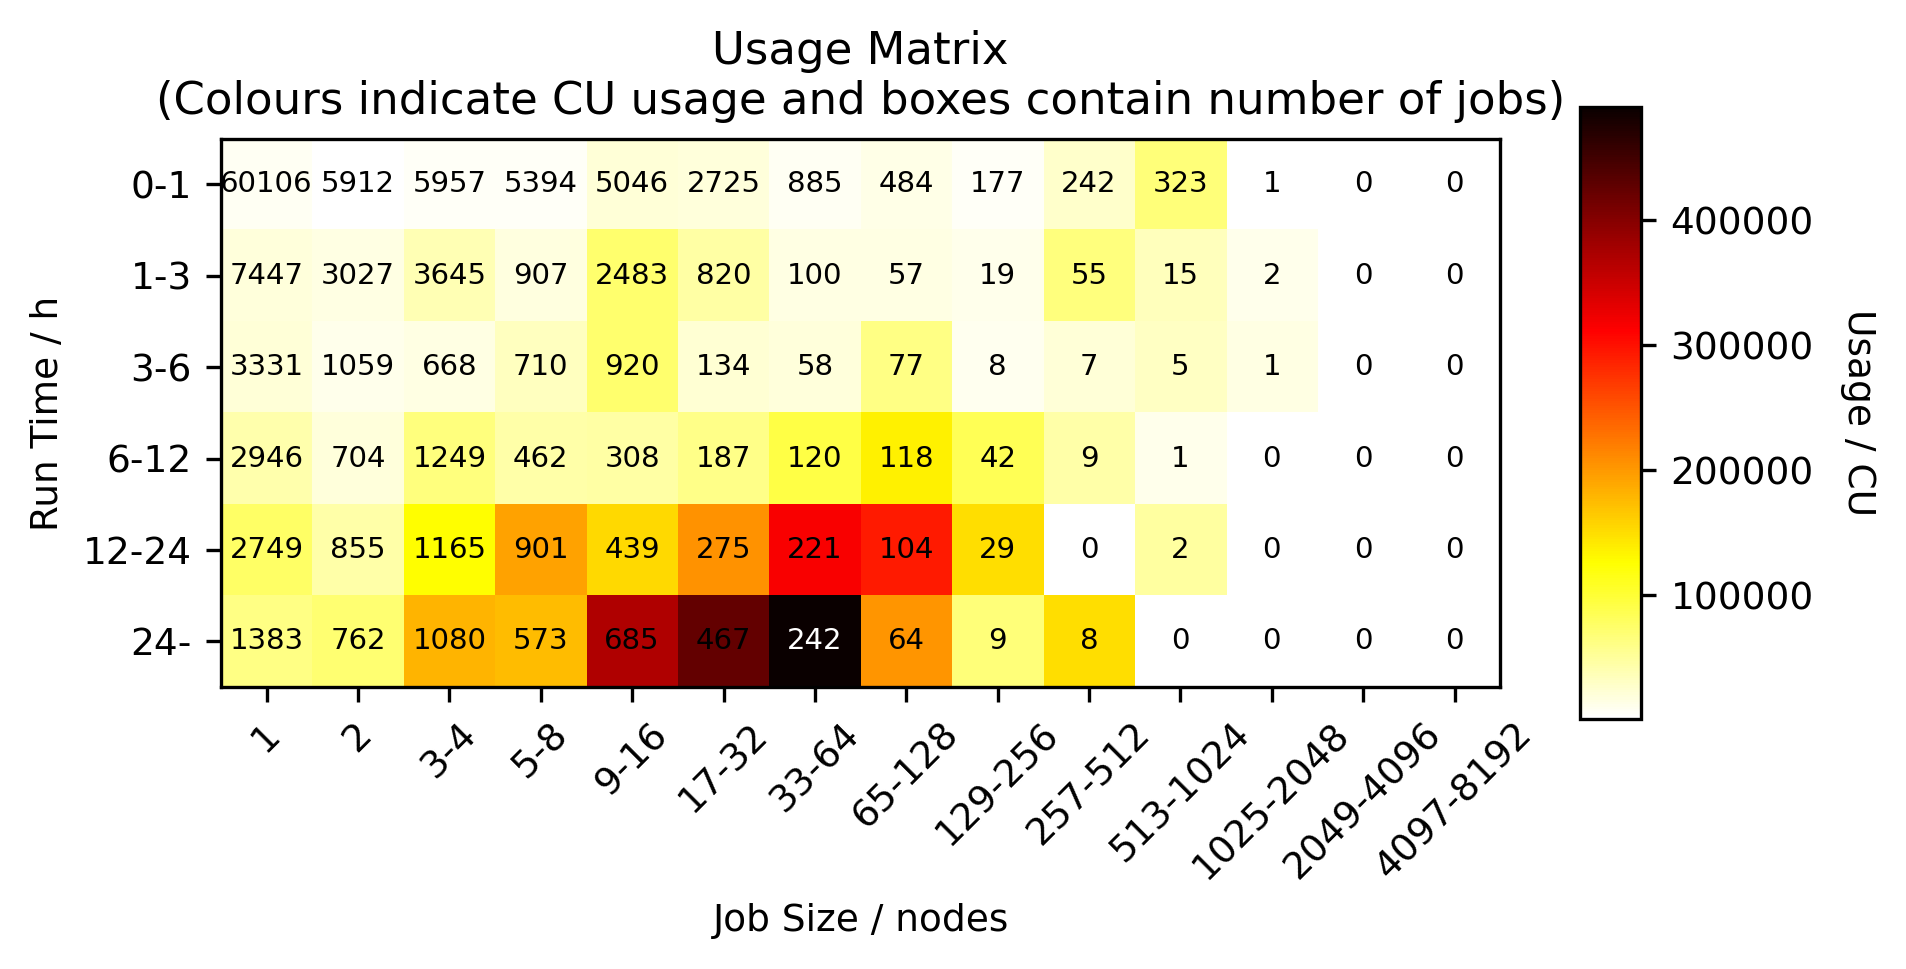
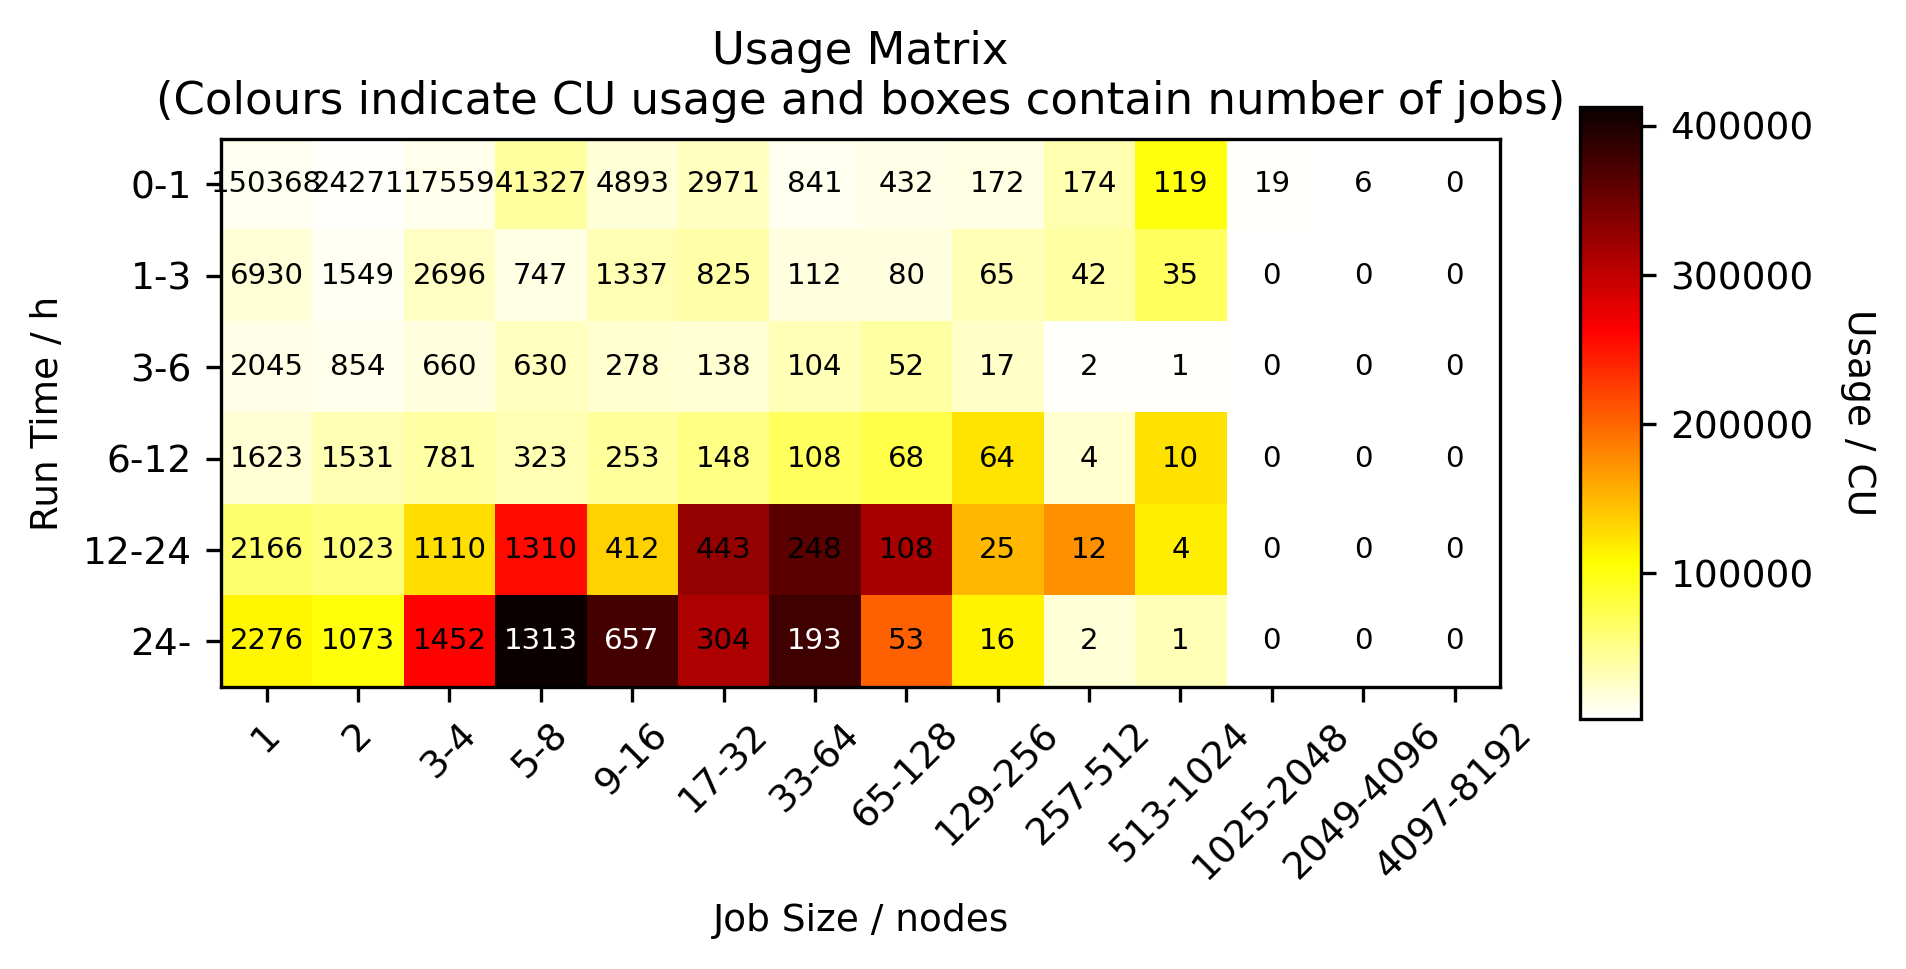
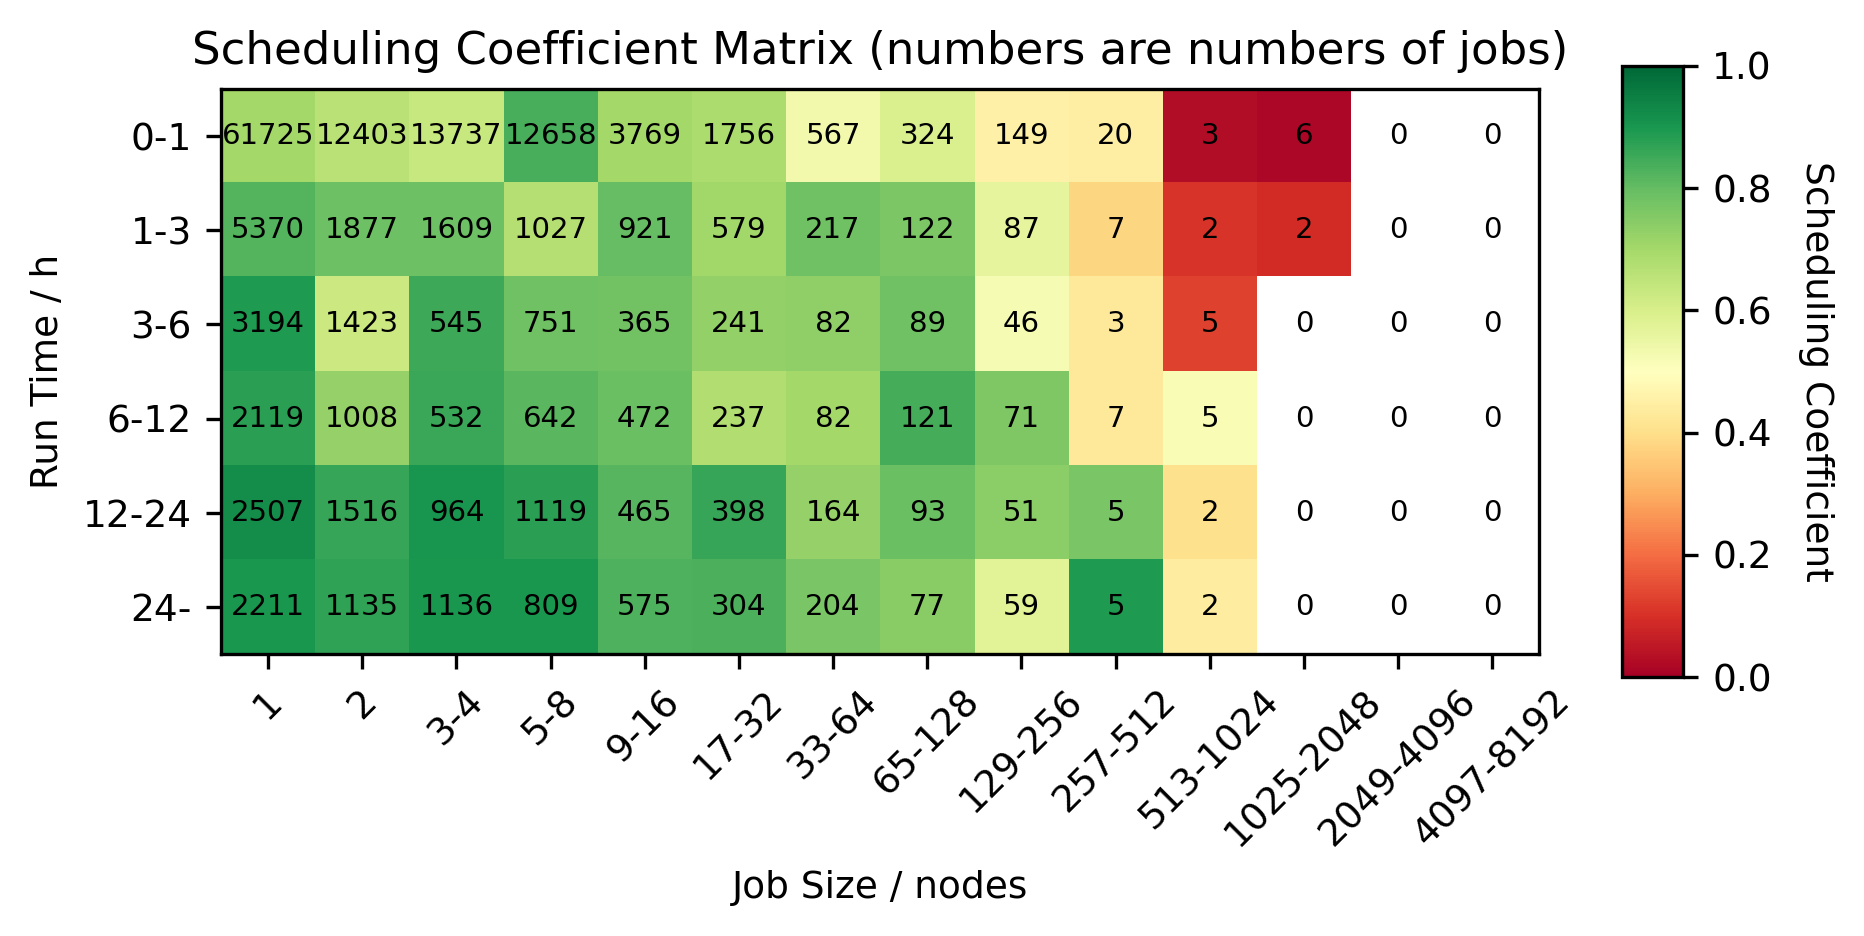
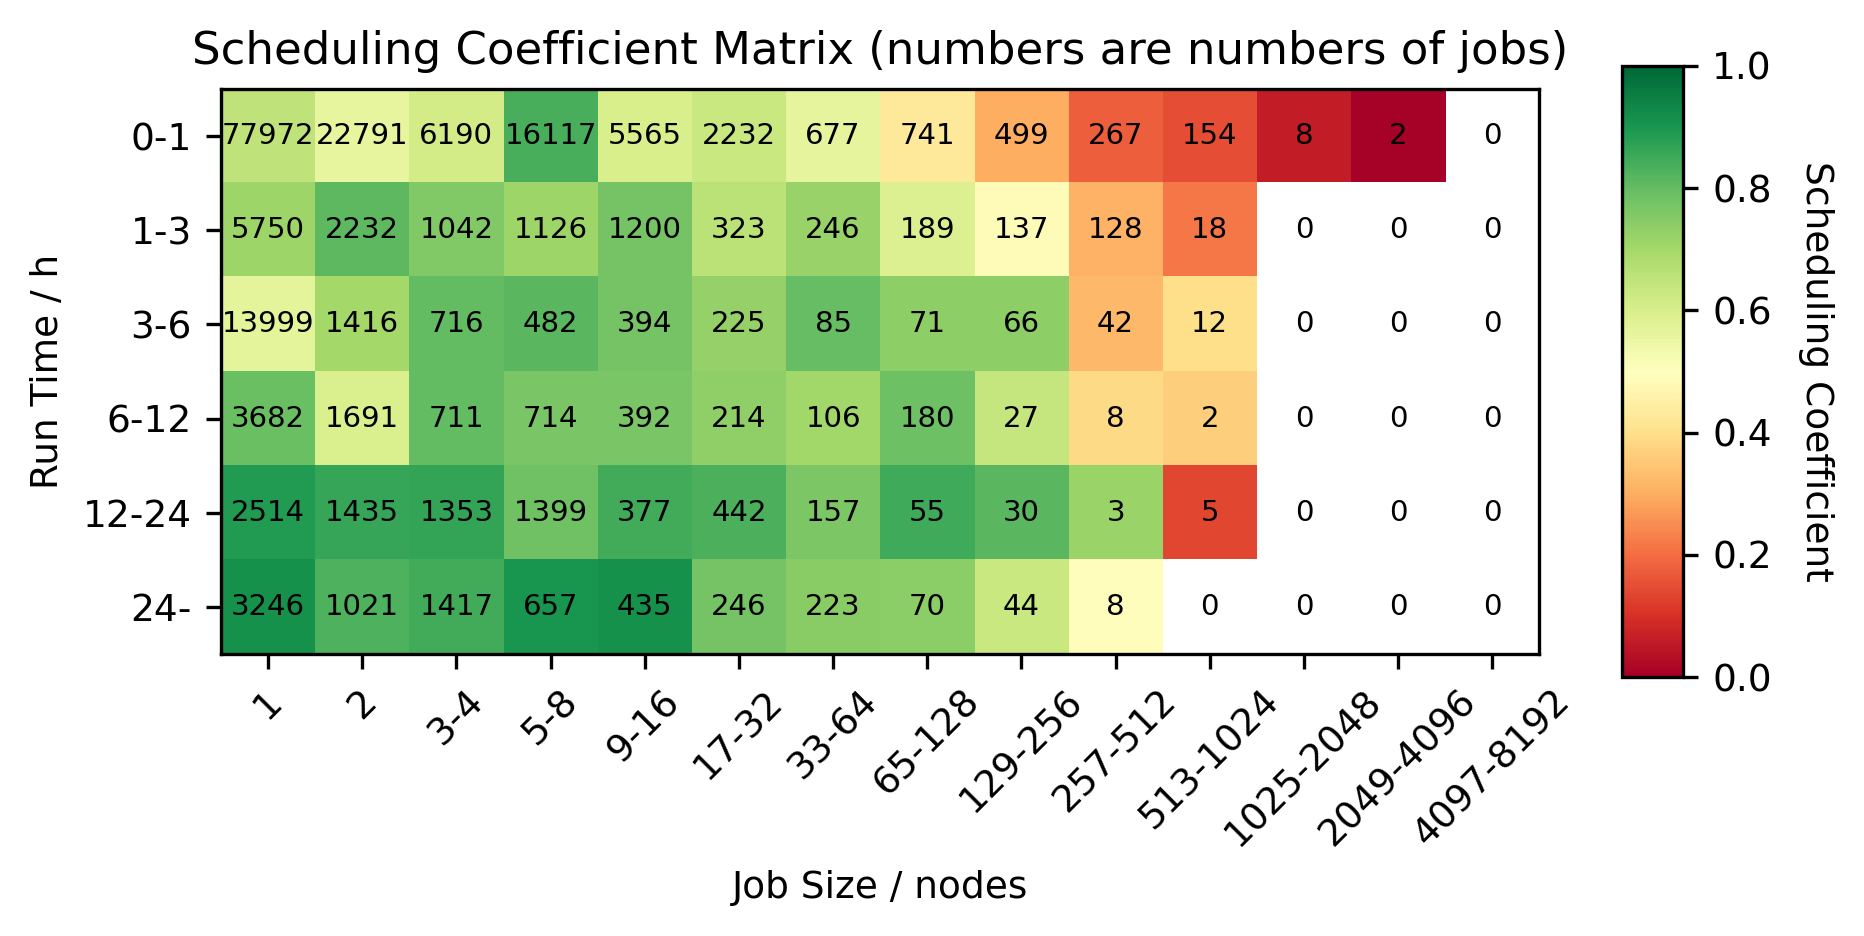
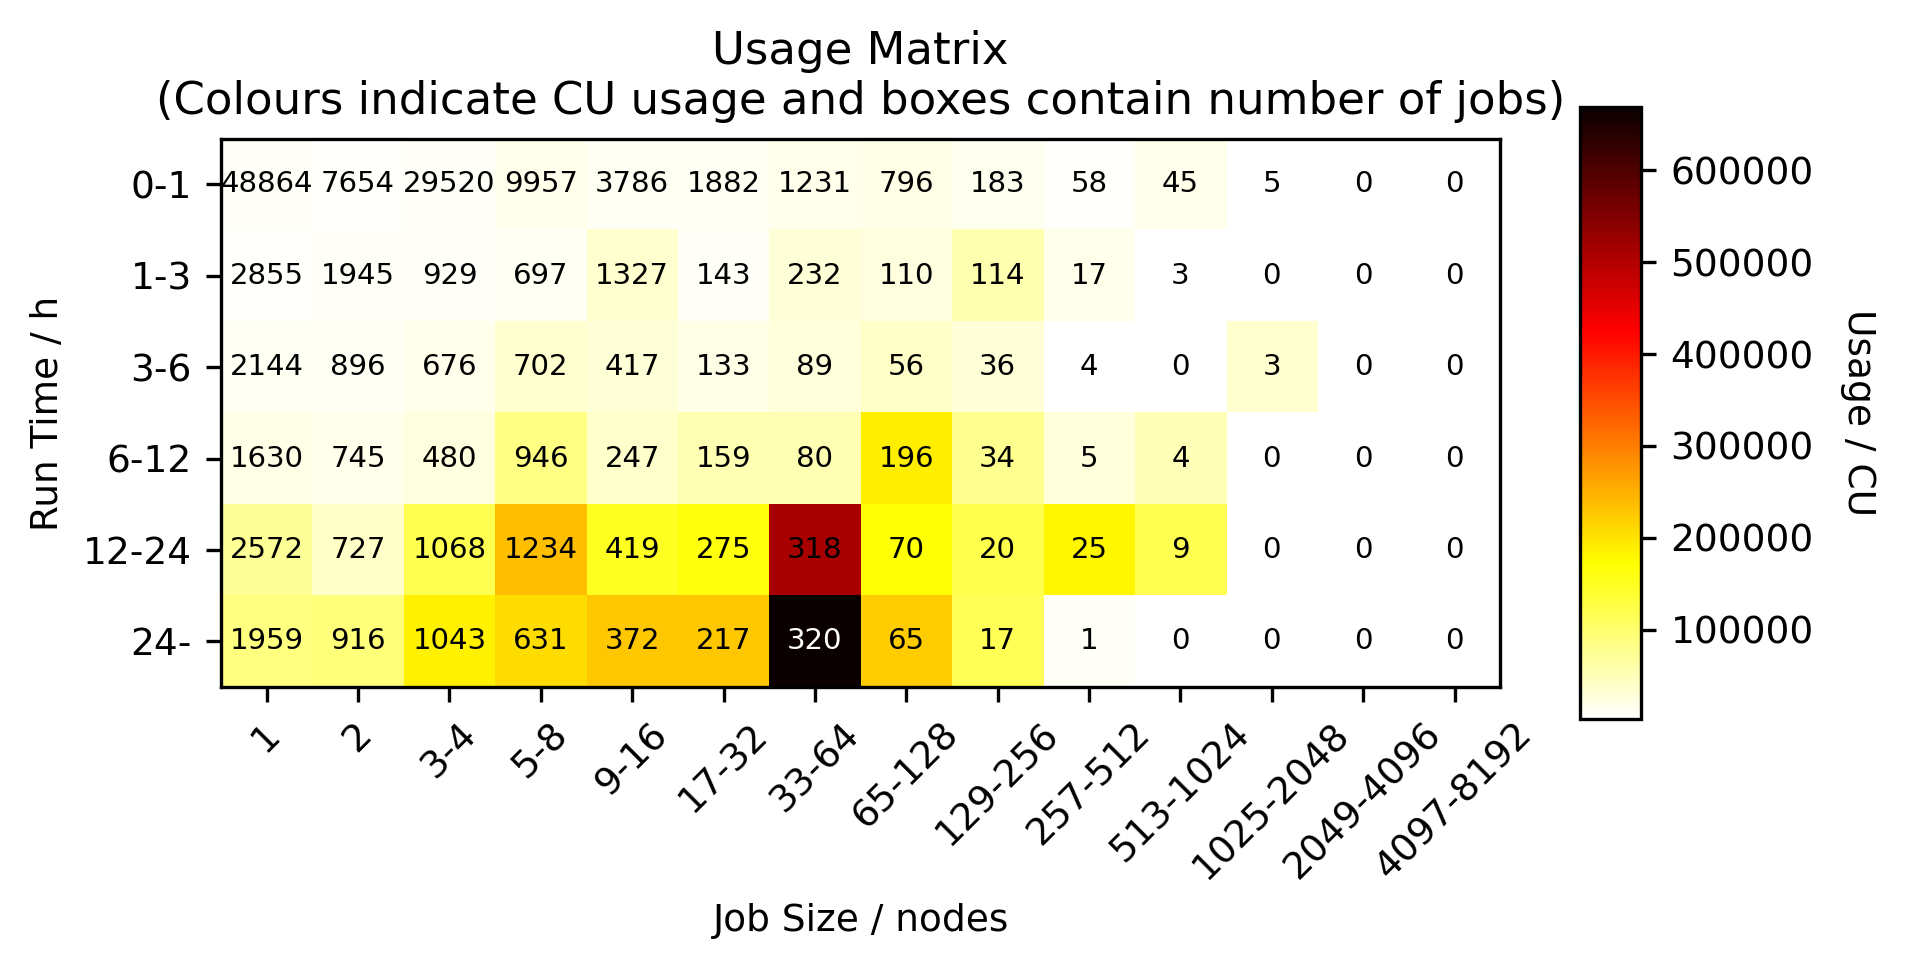
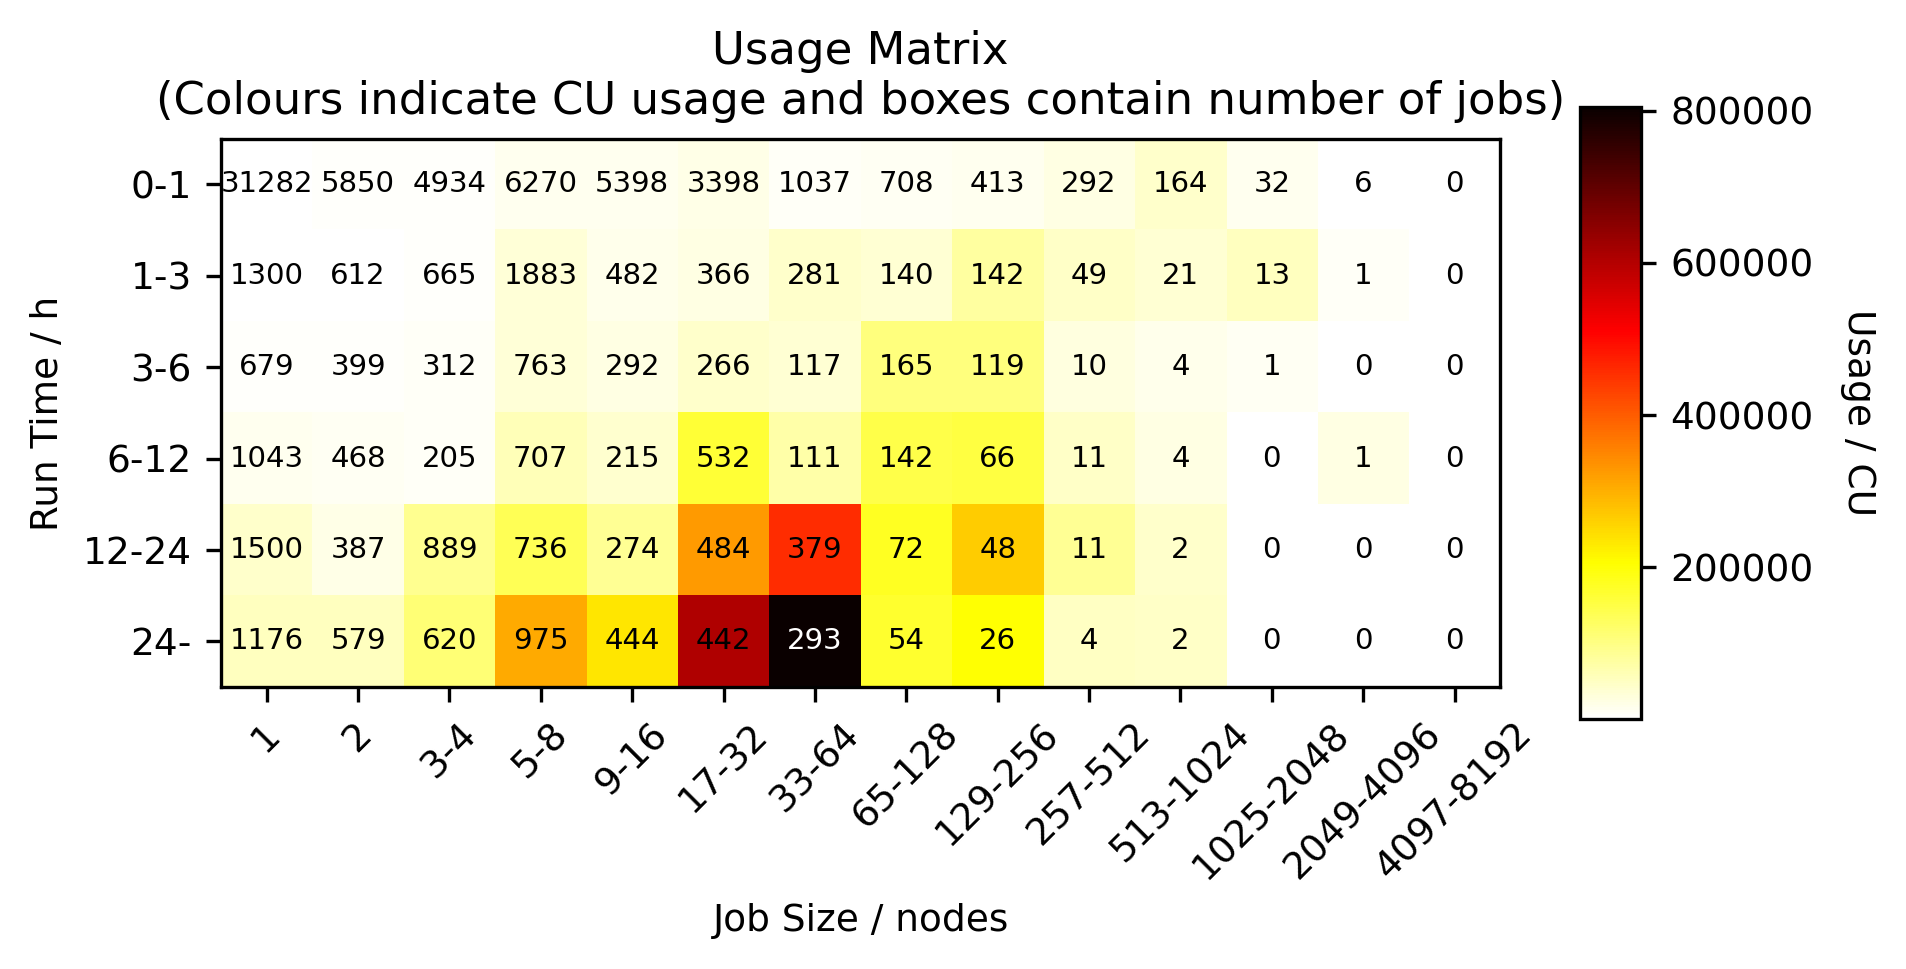
Usage by job size and length
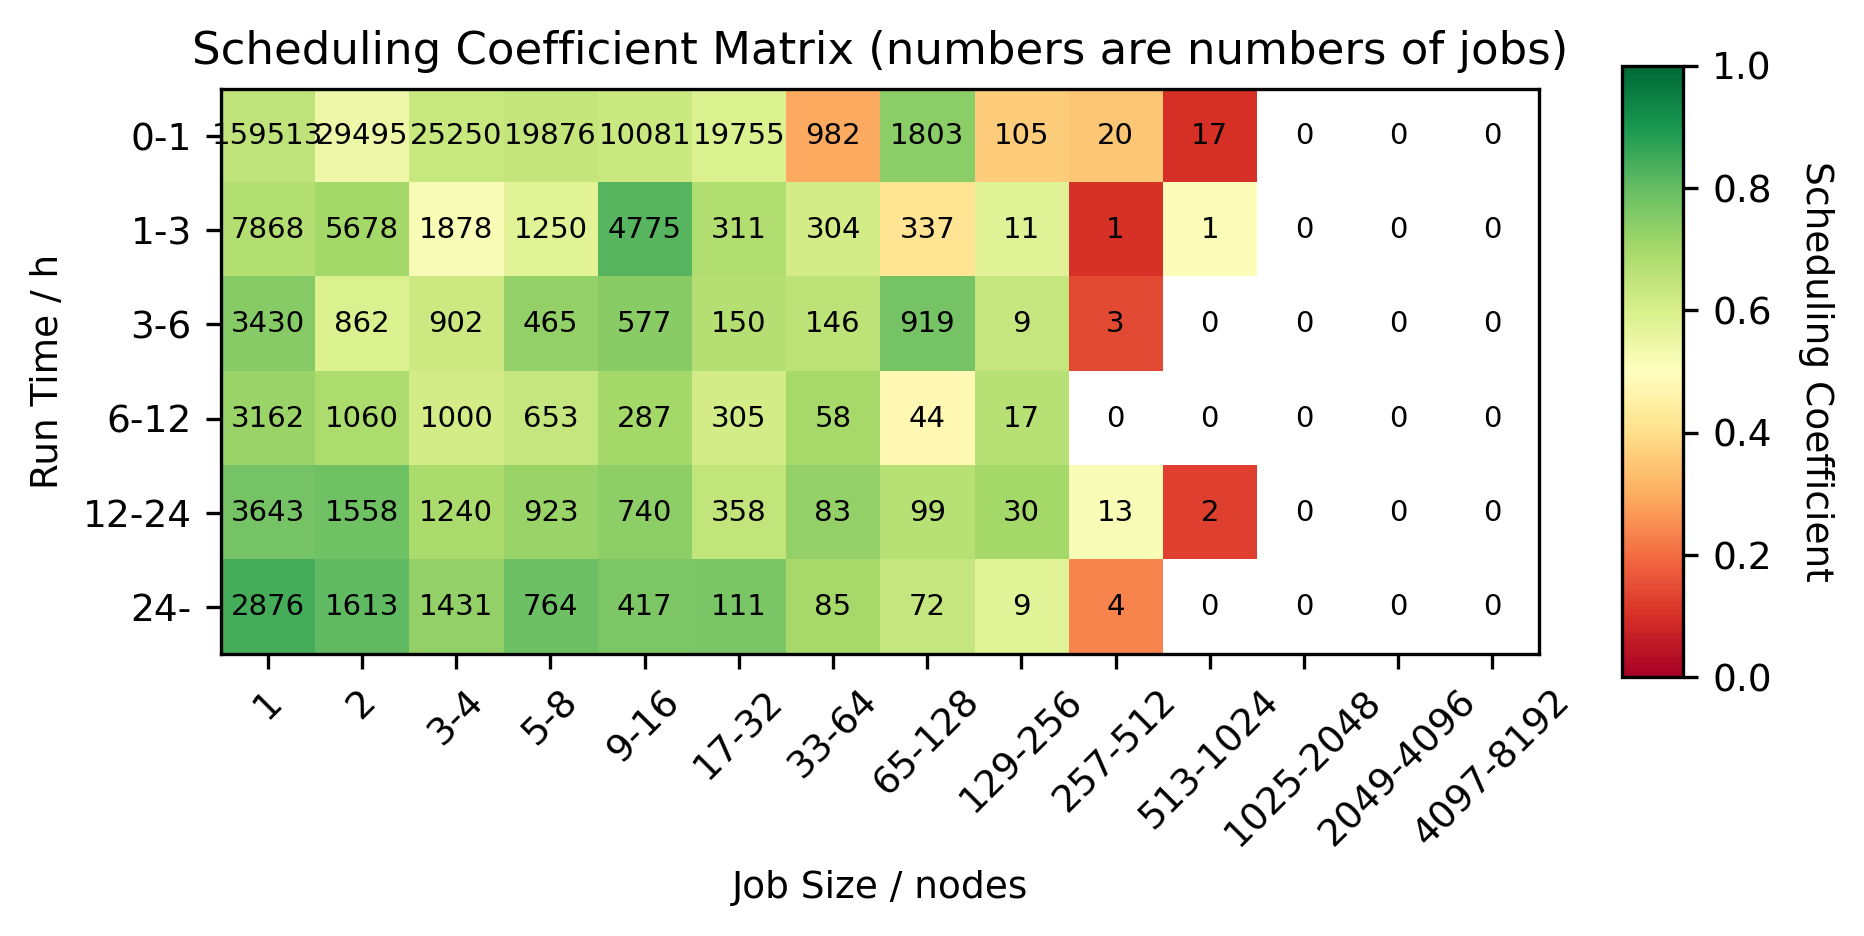
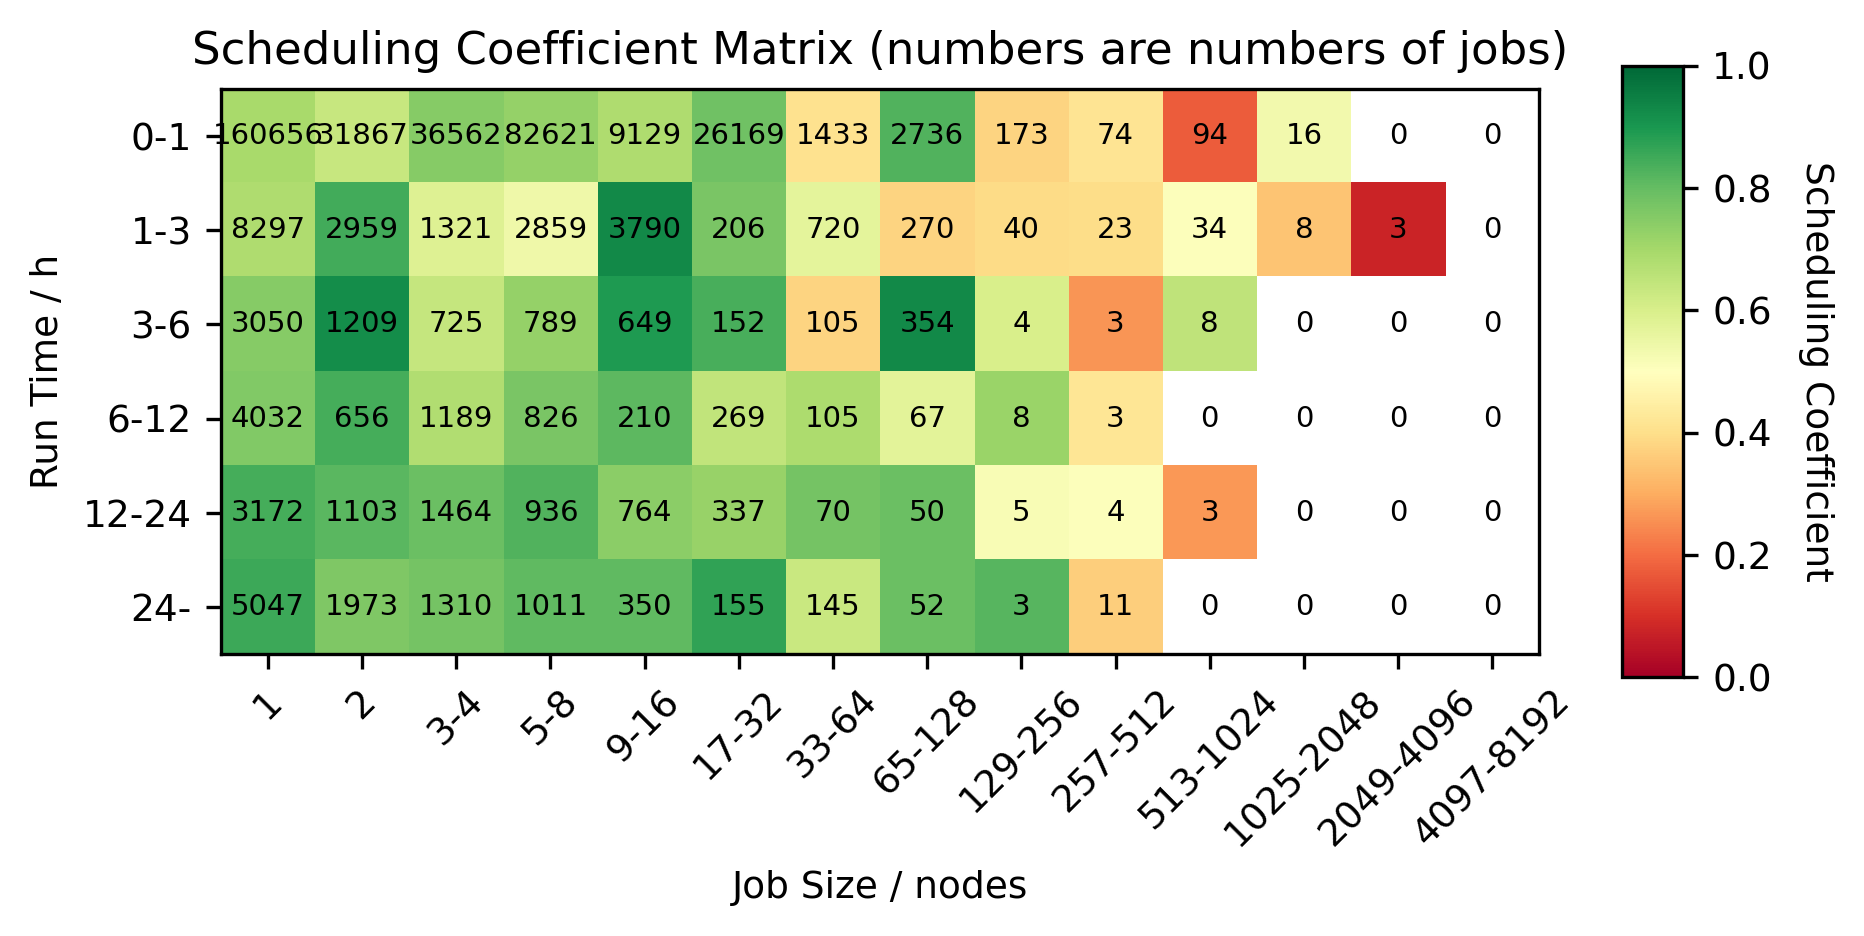
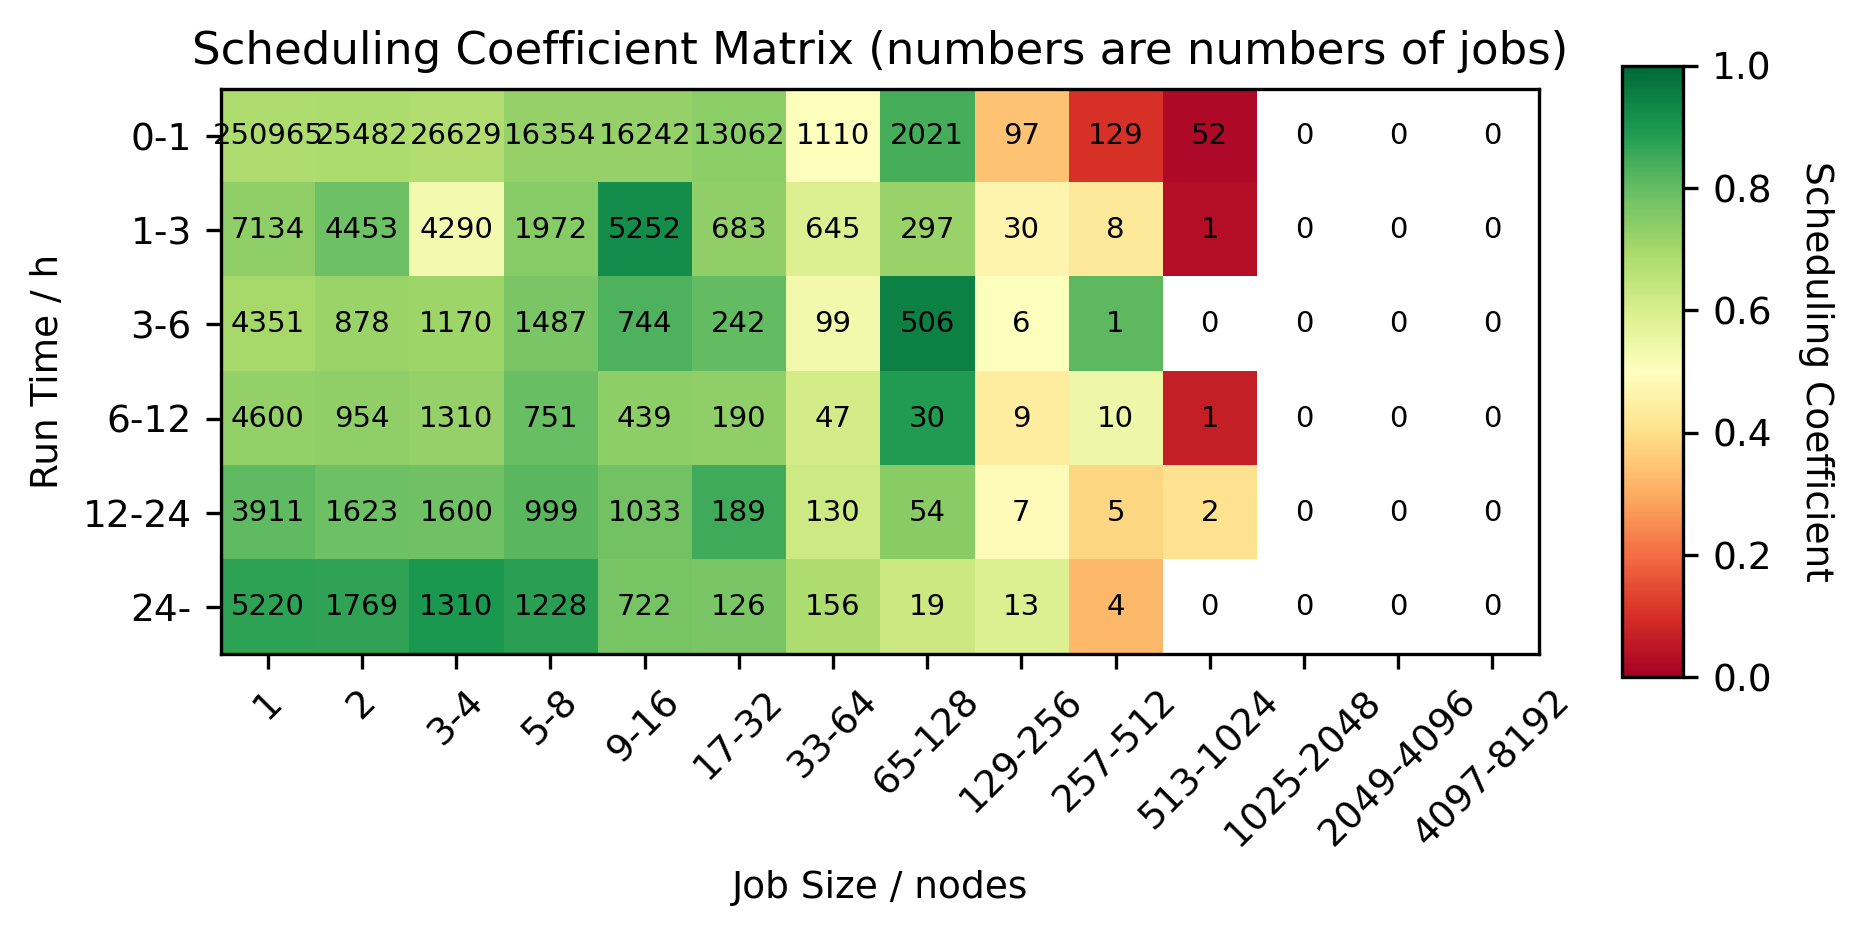
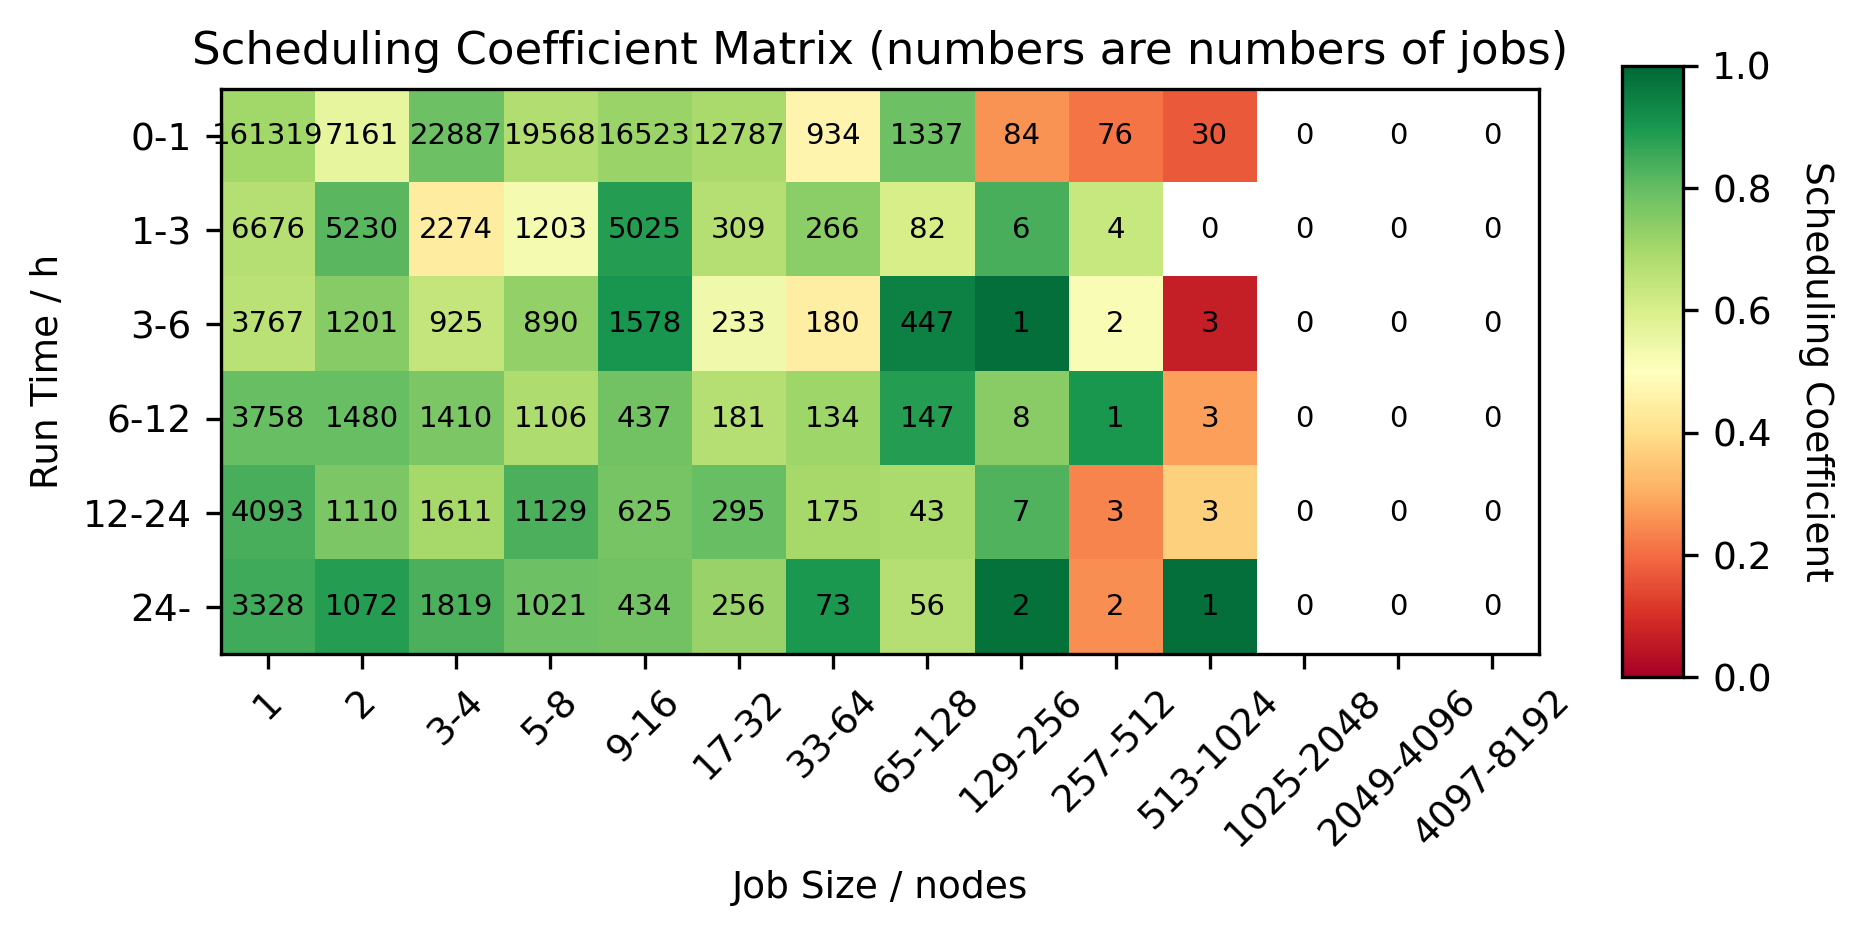
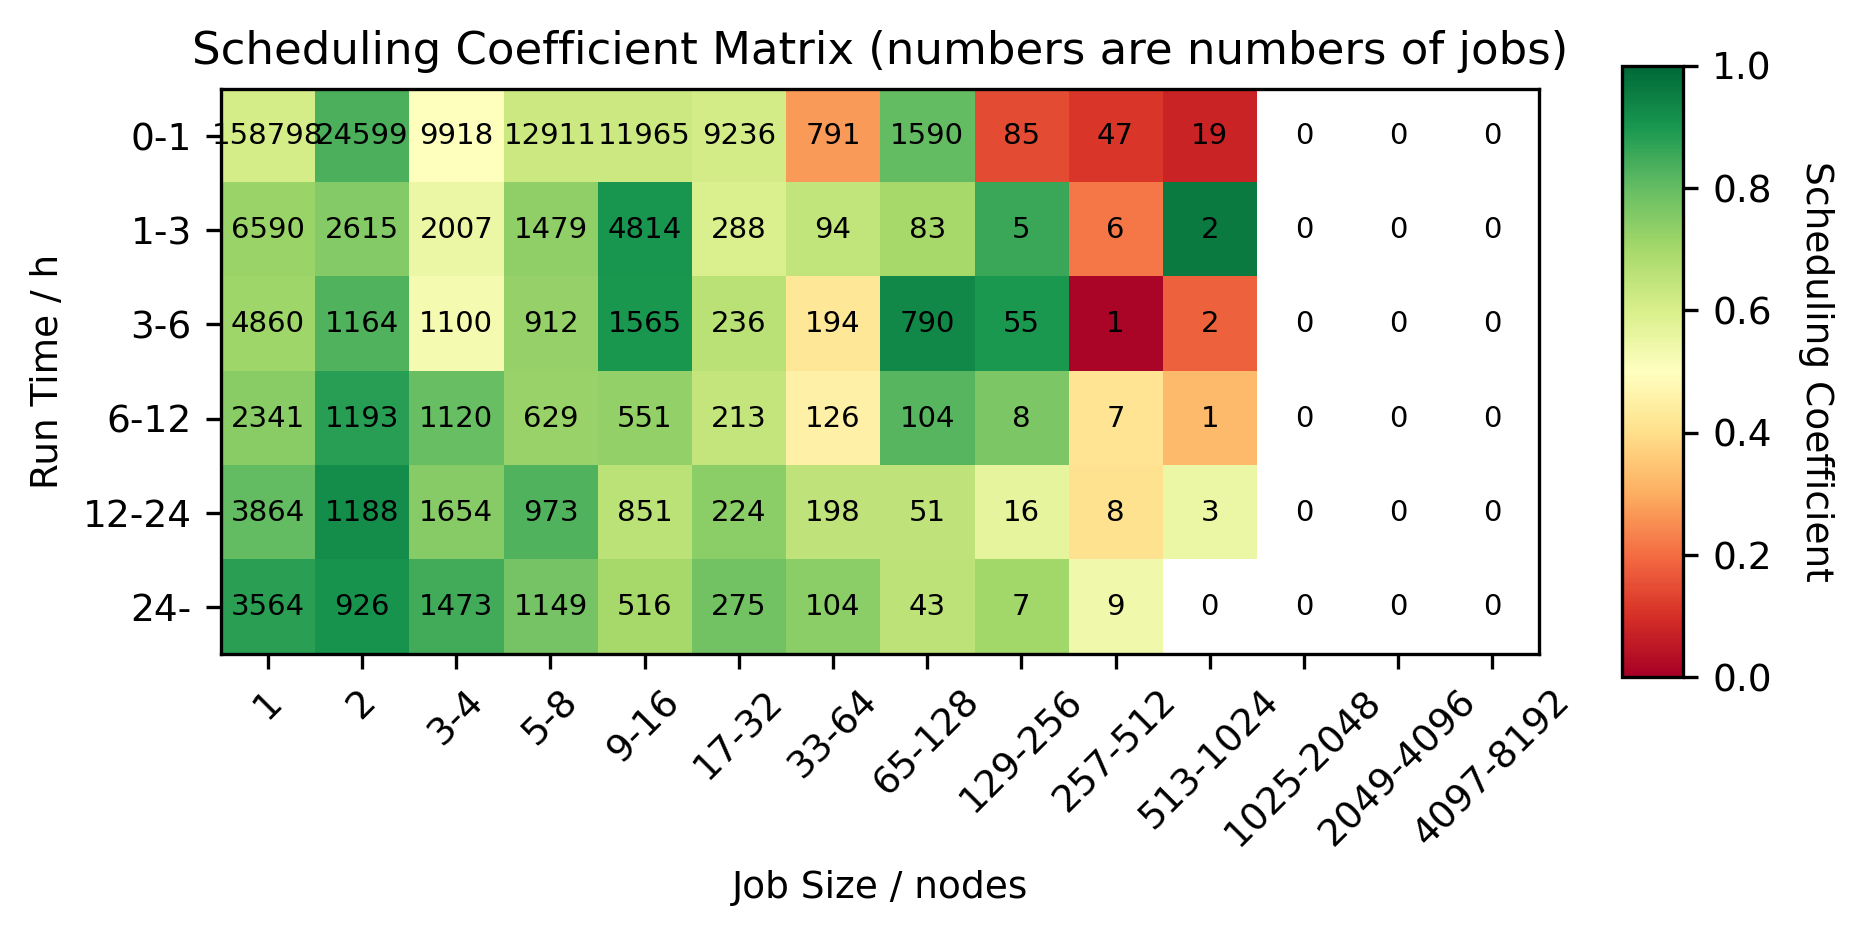
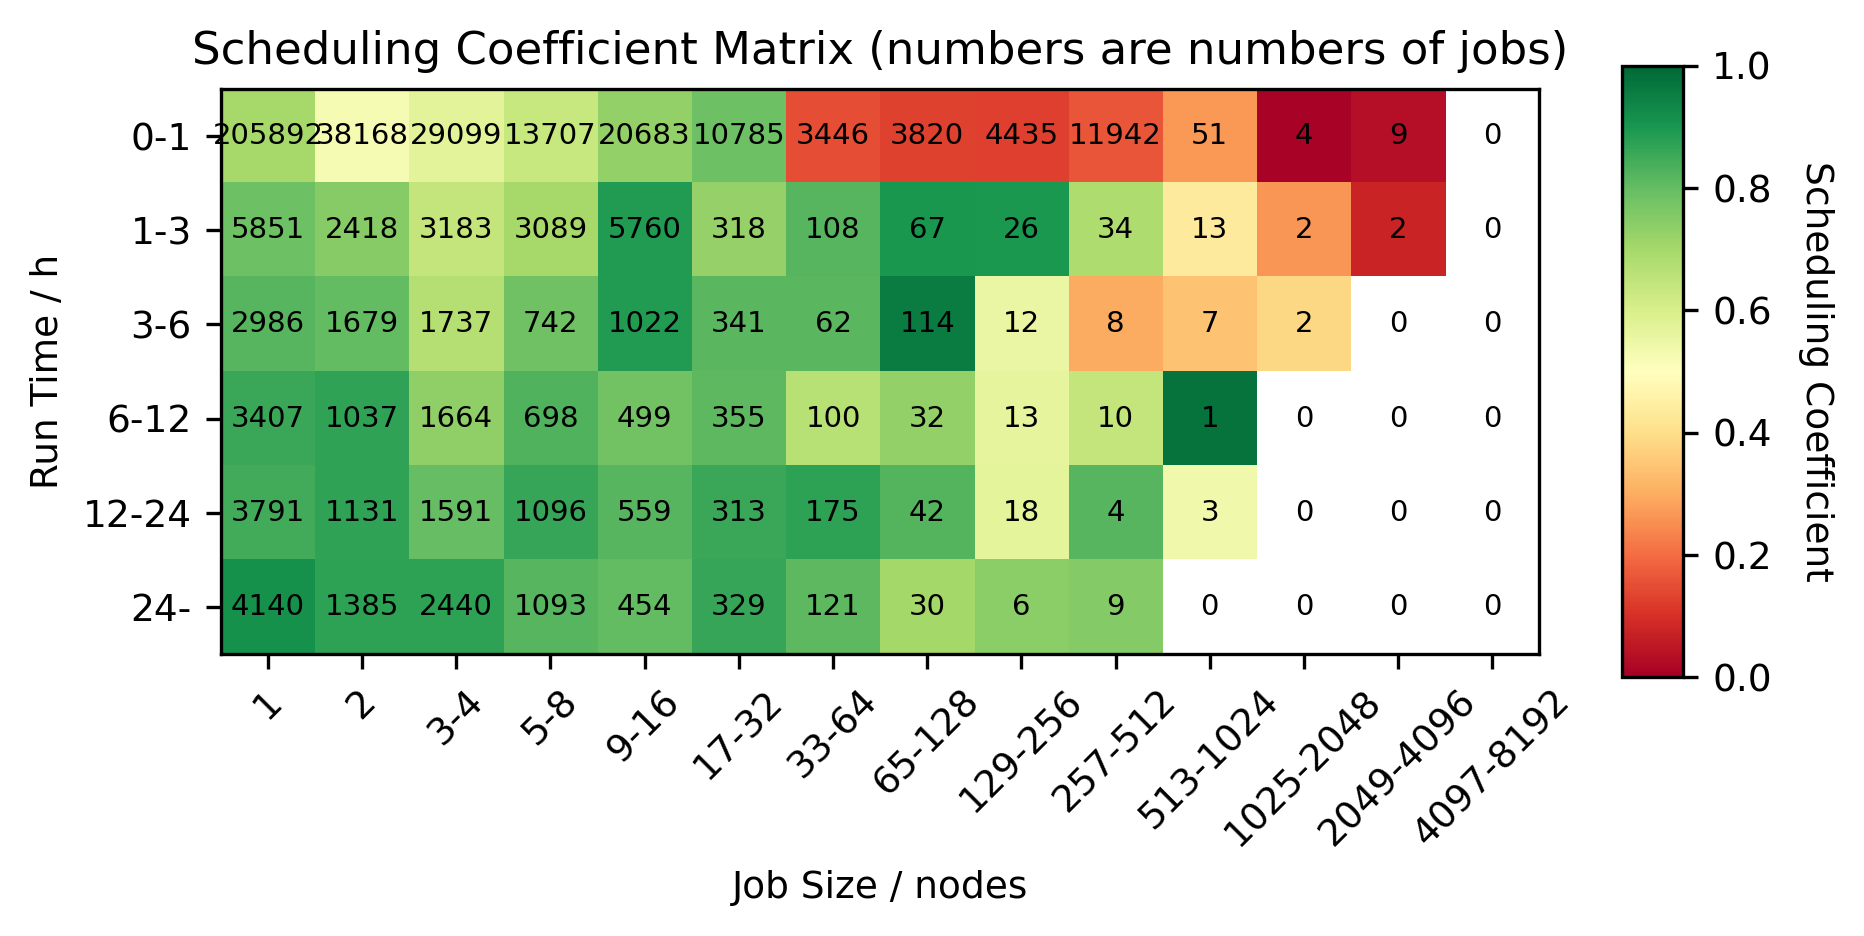
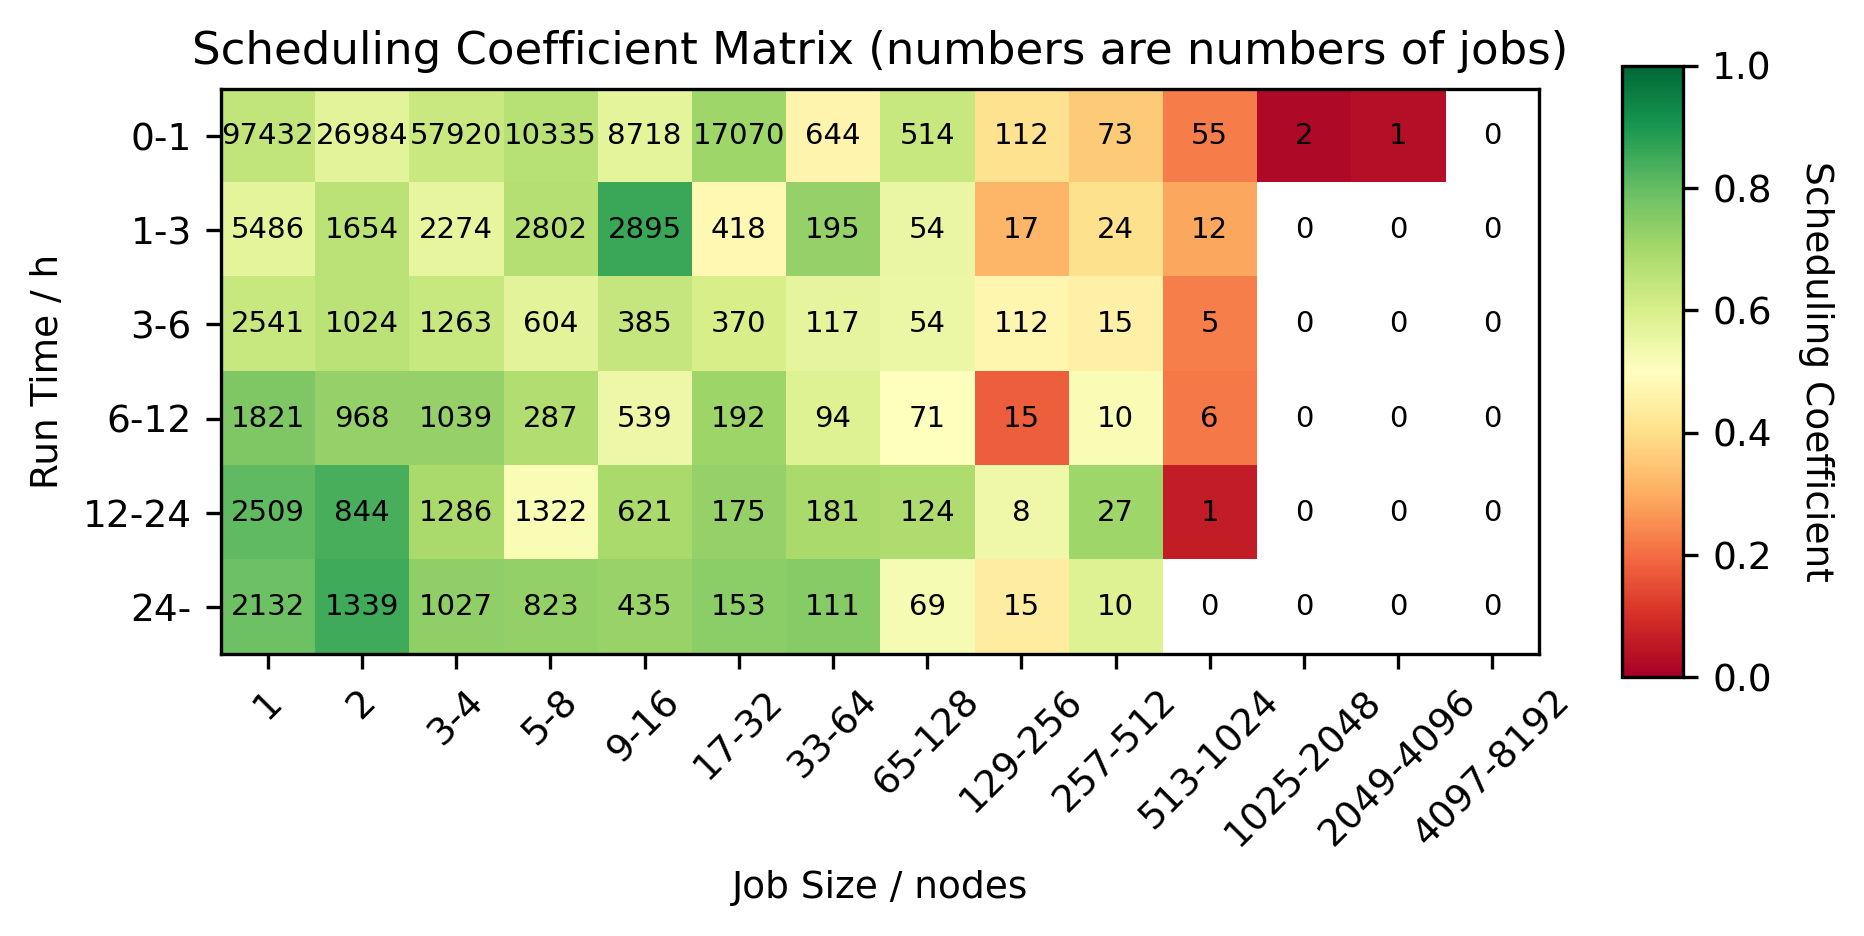
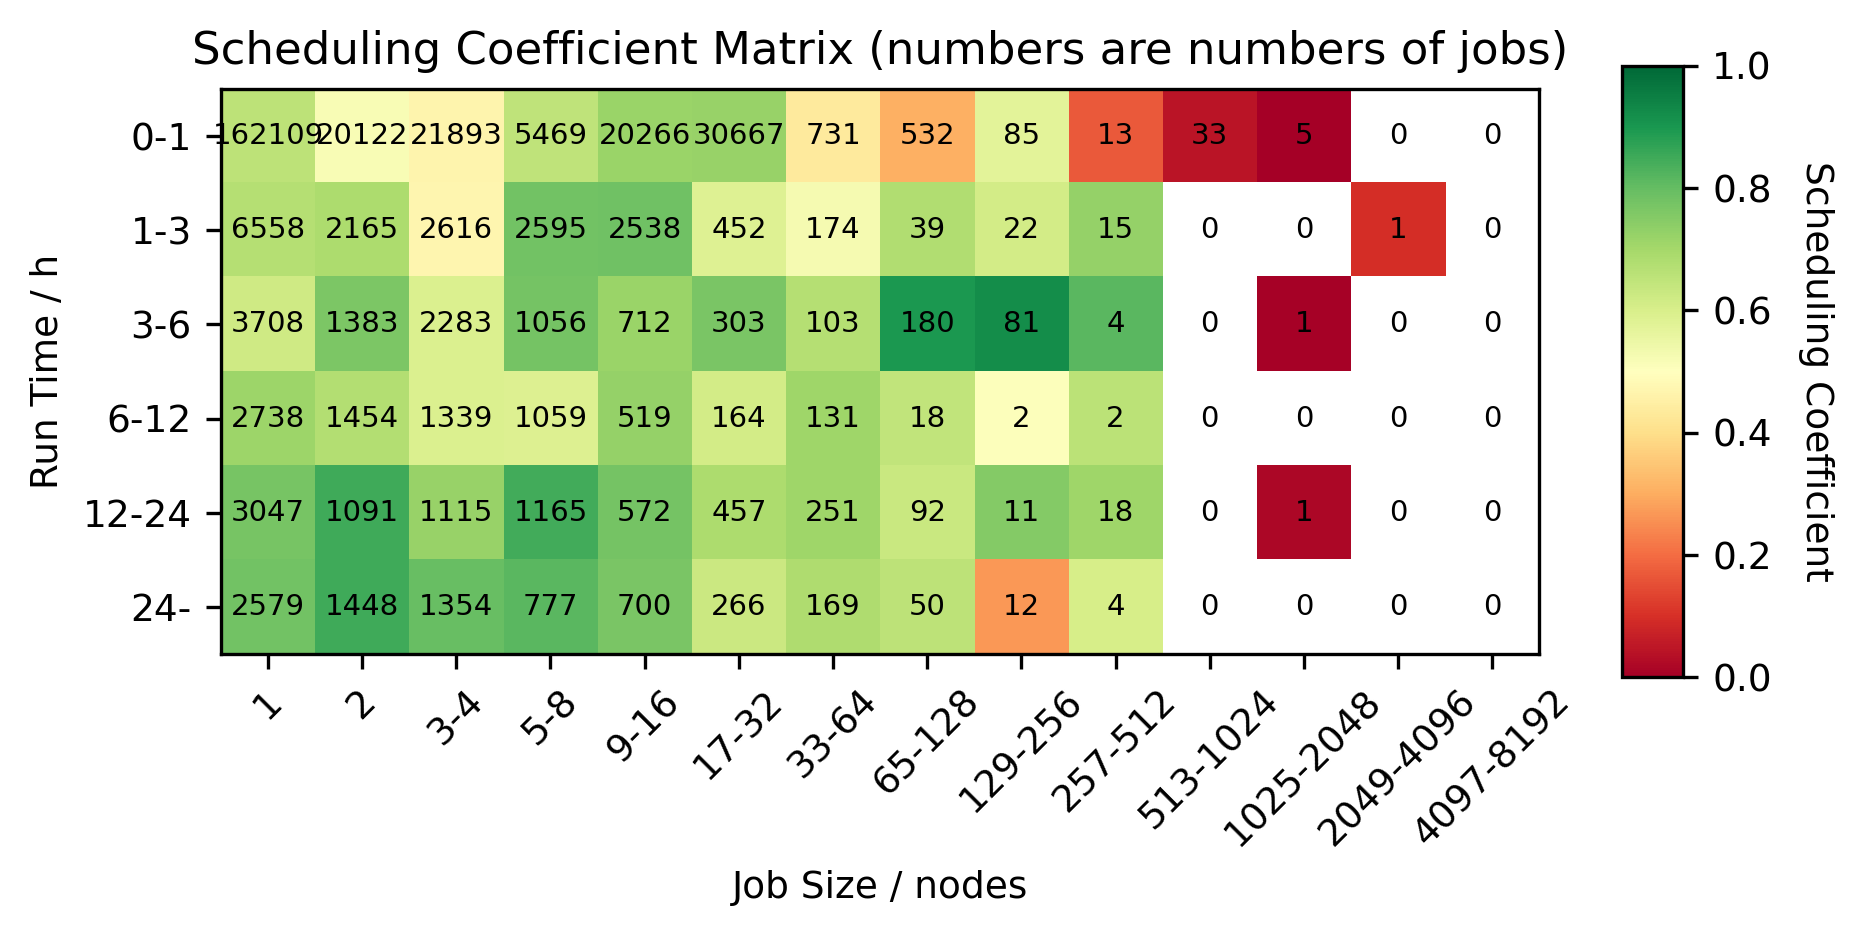
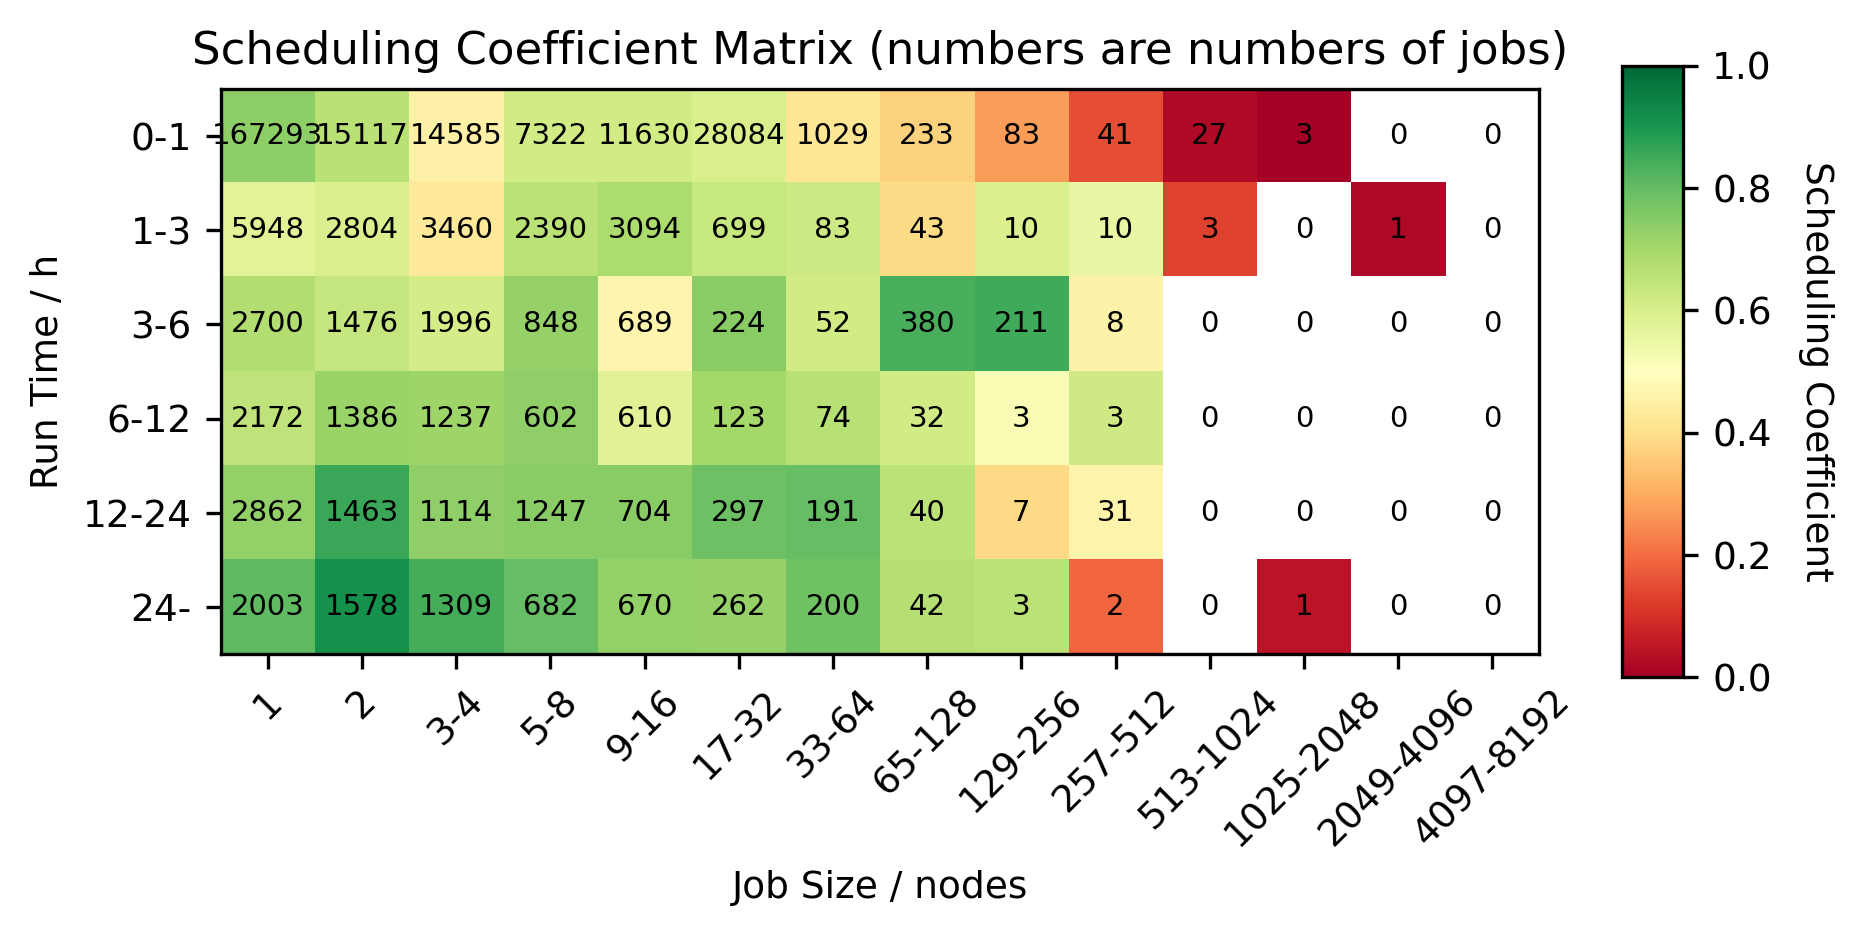
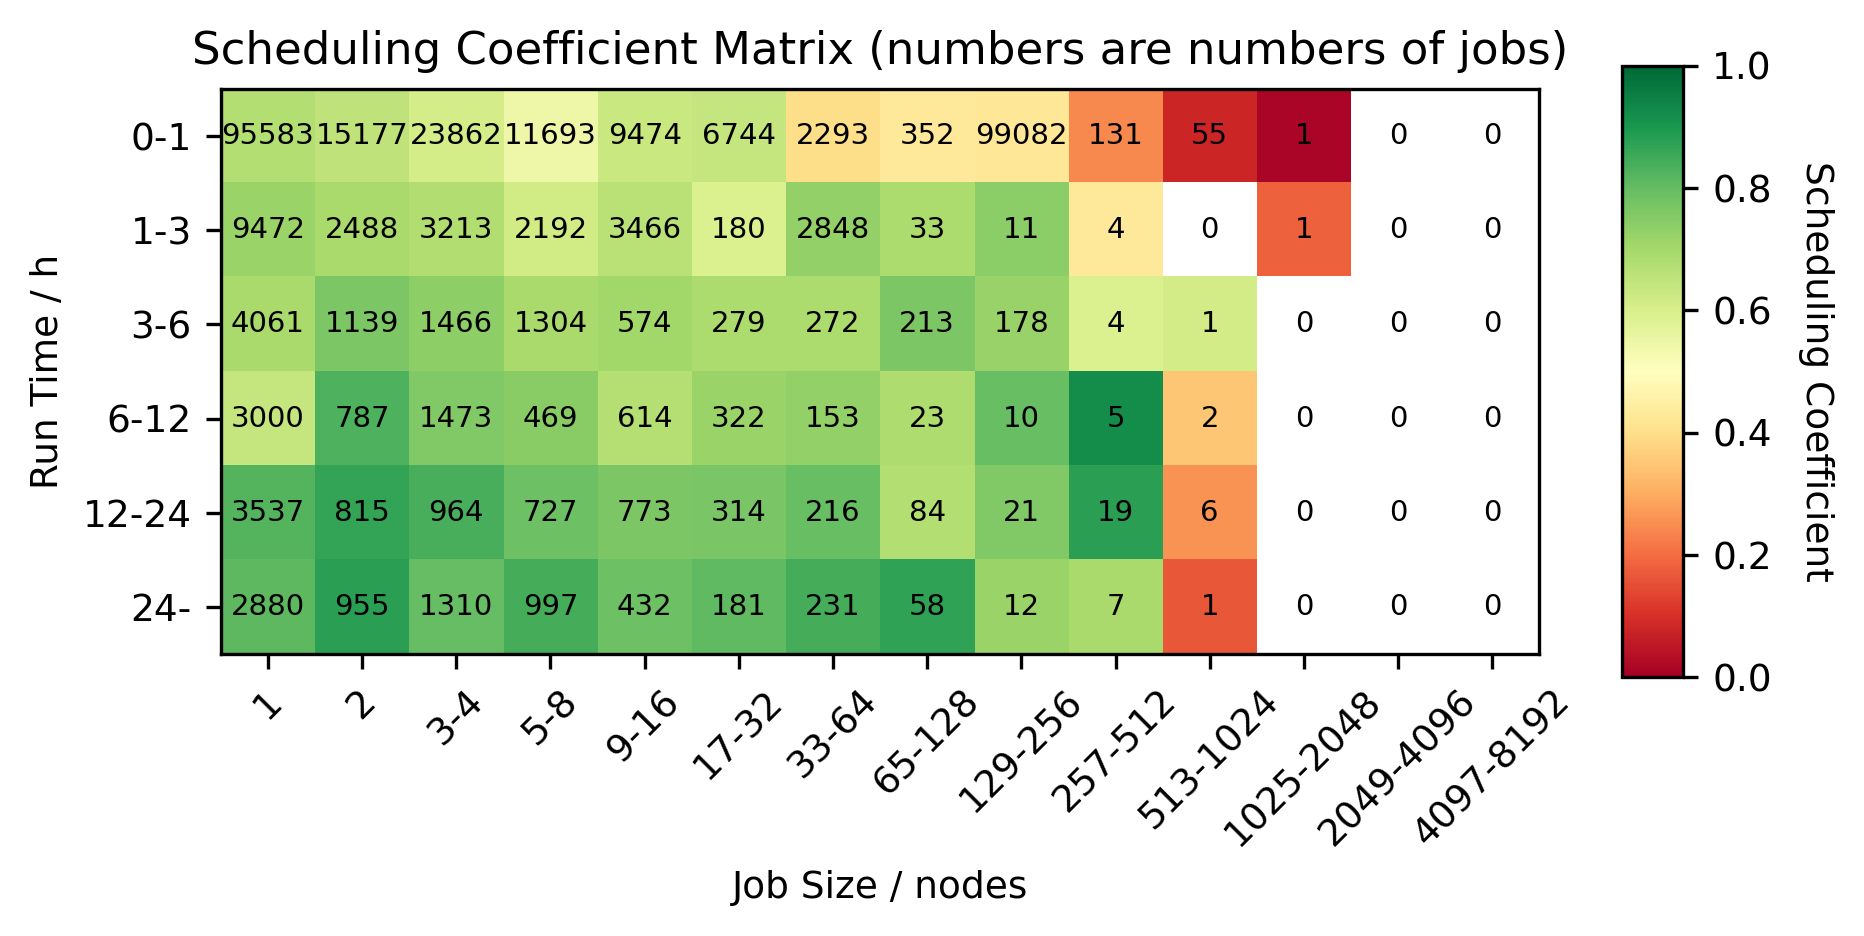
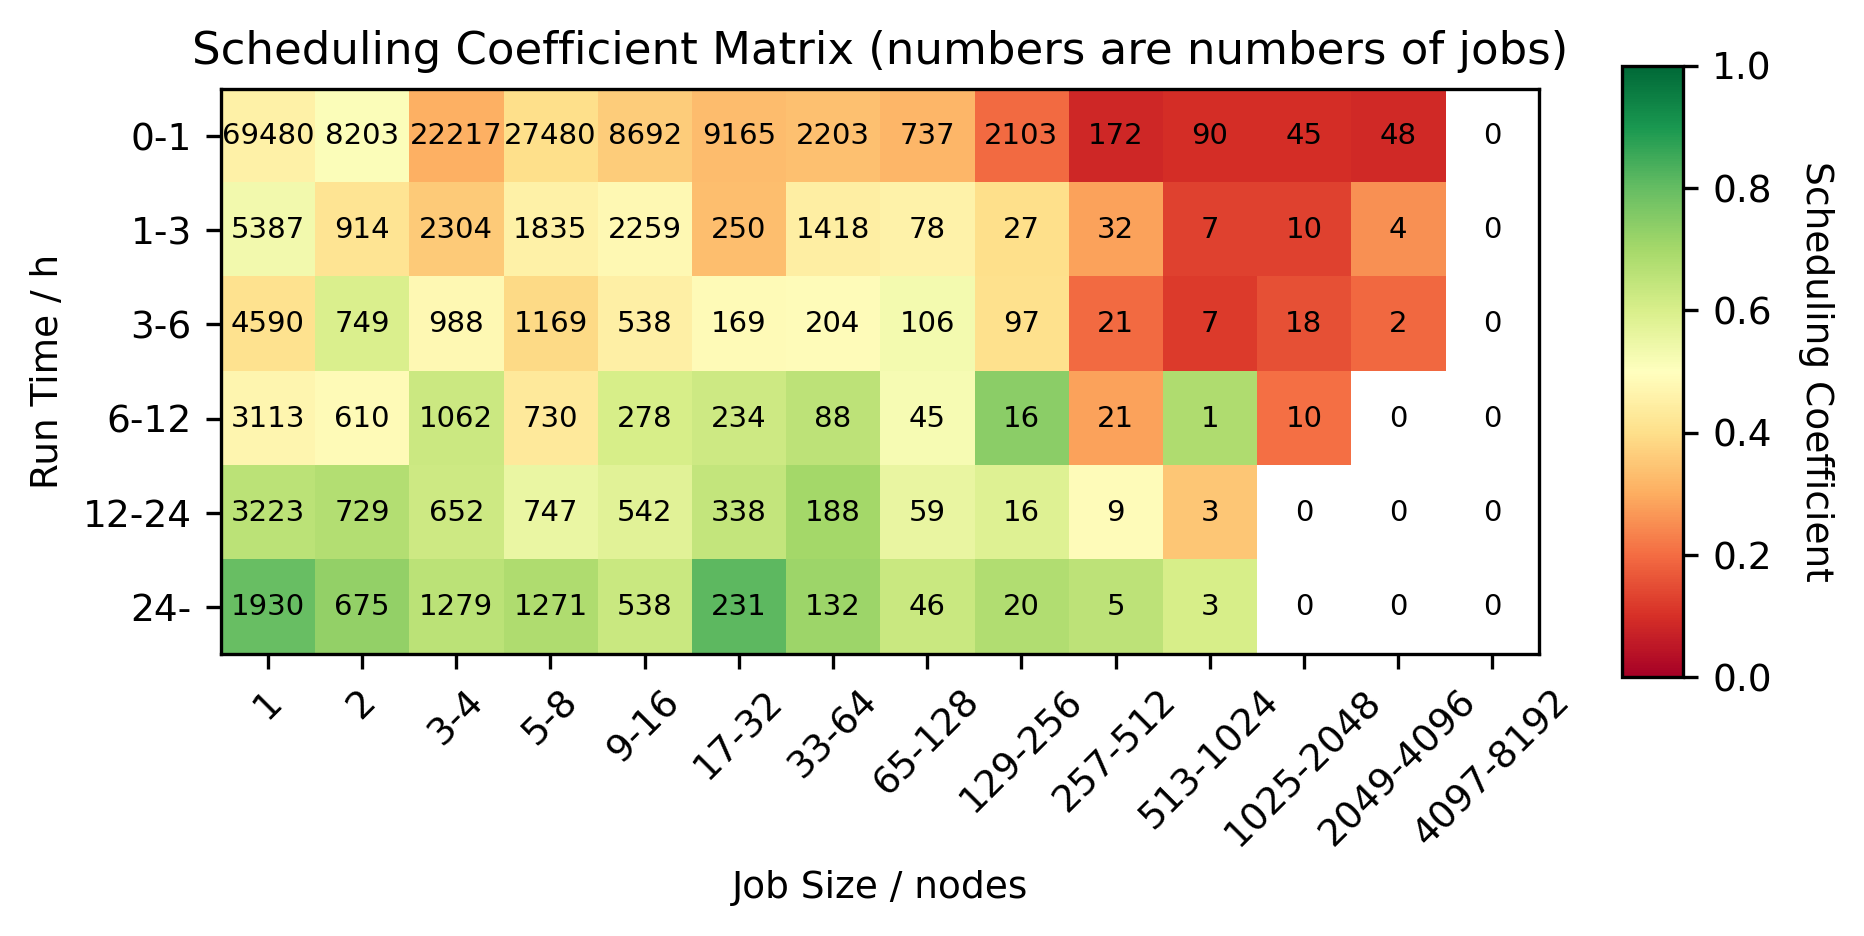
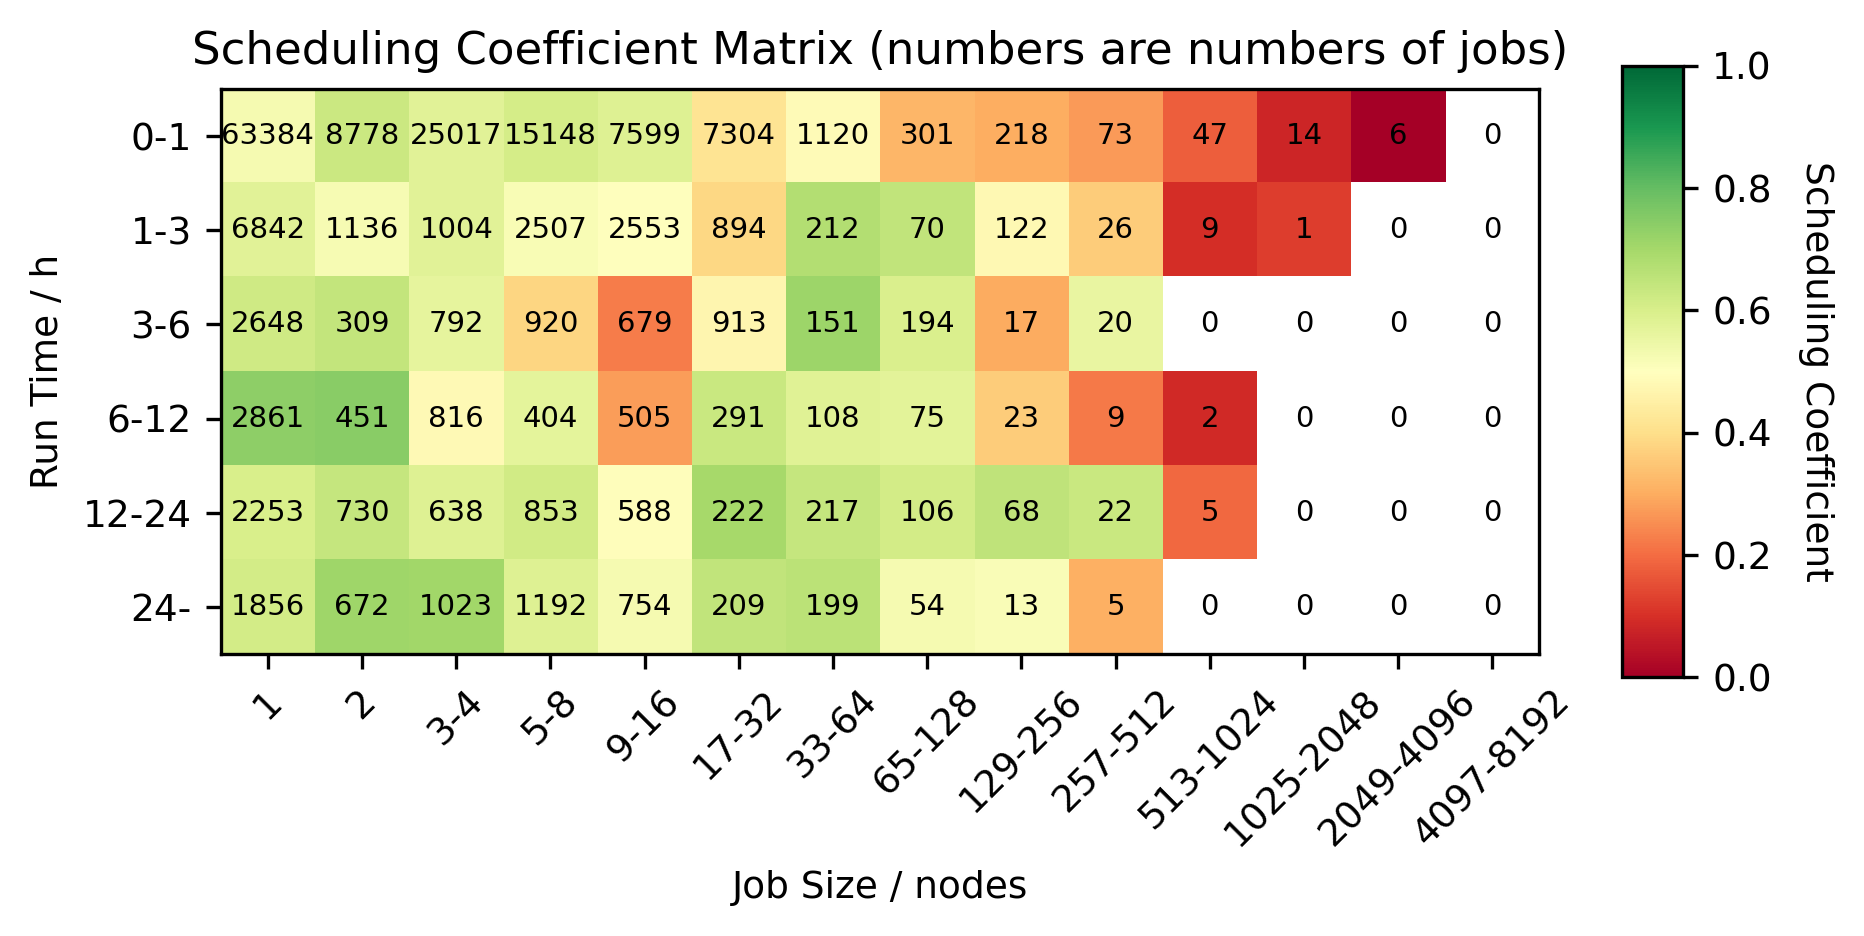
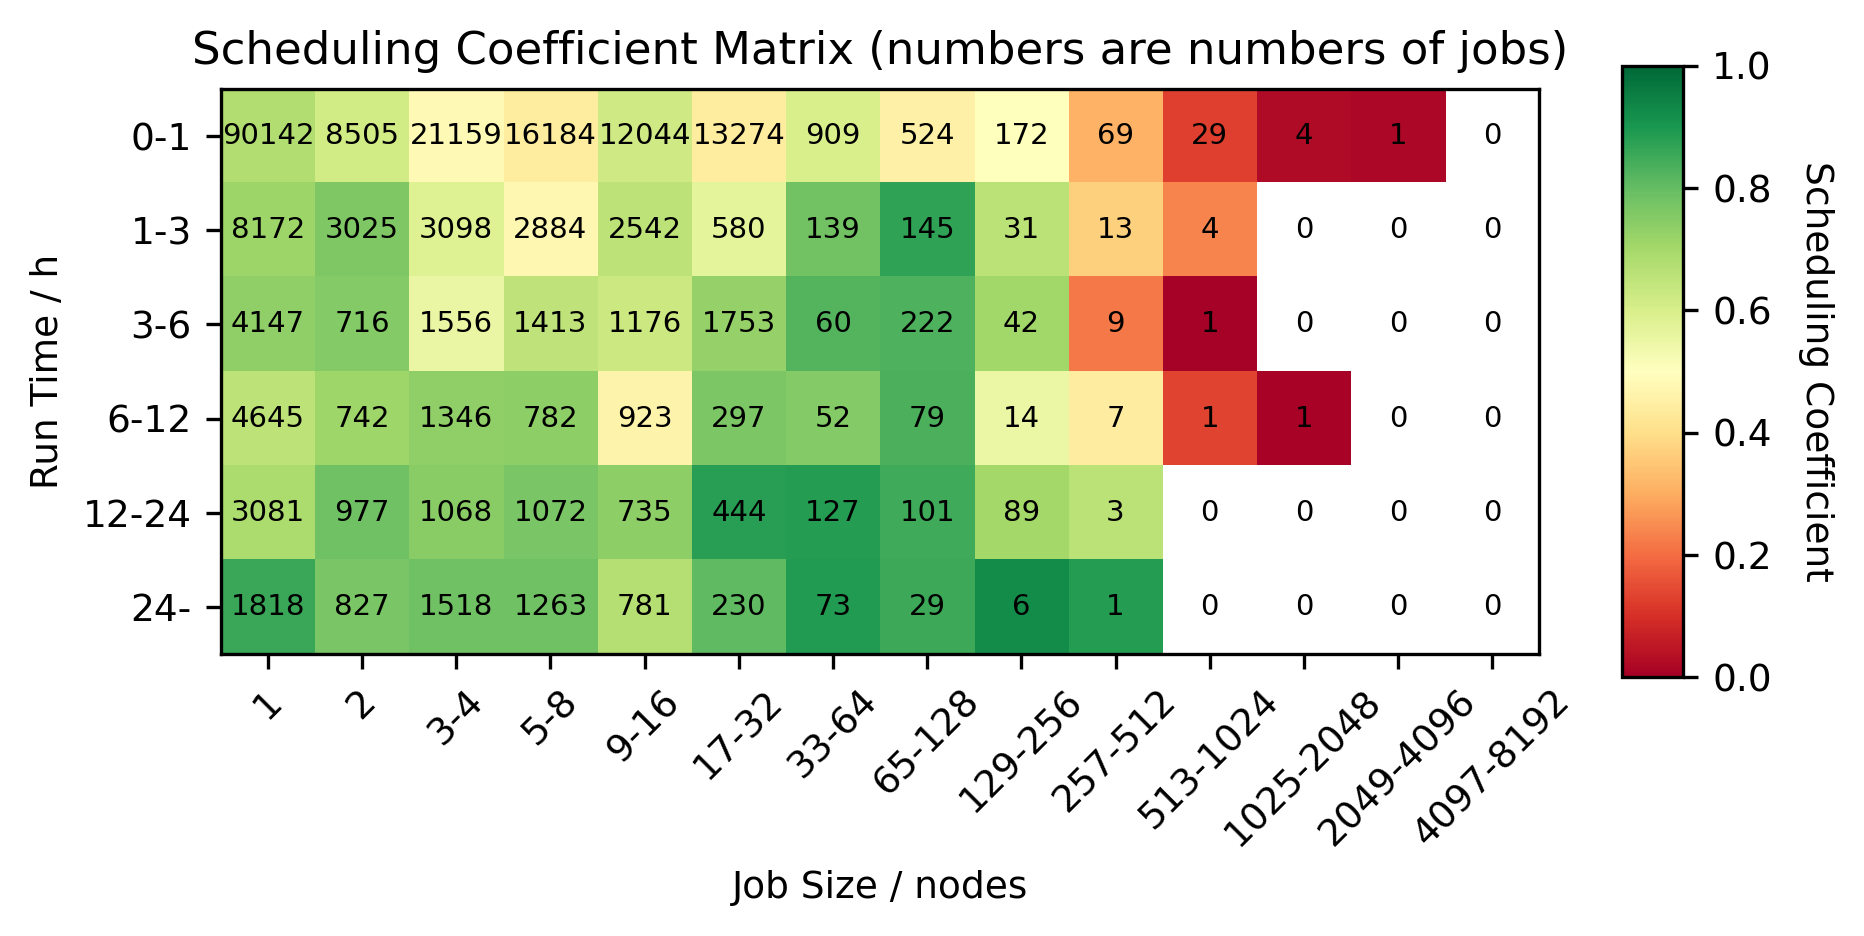
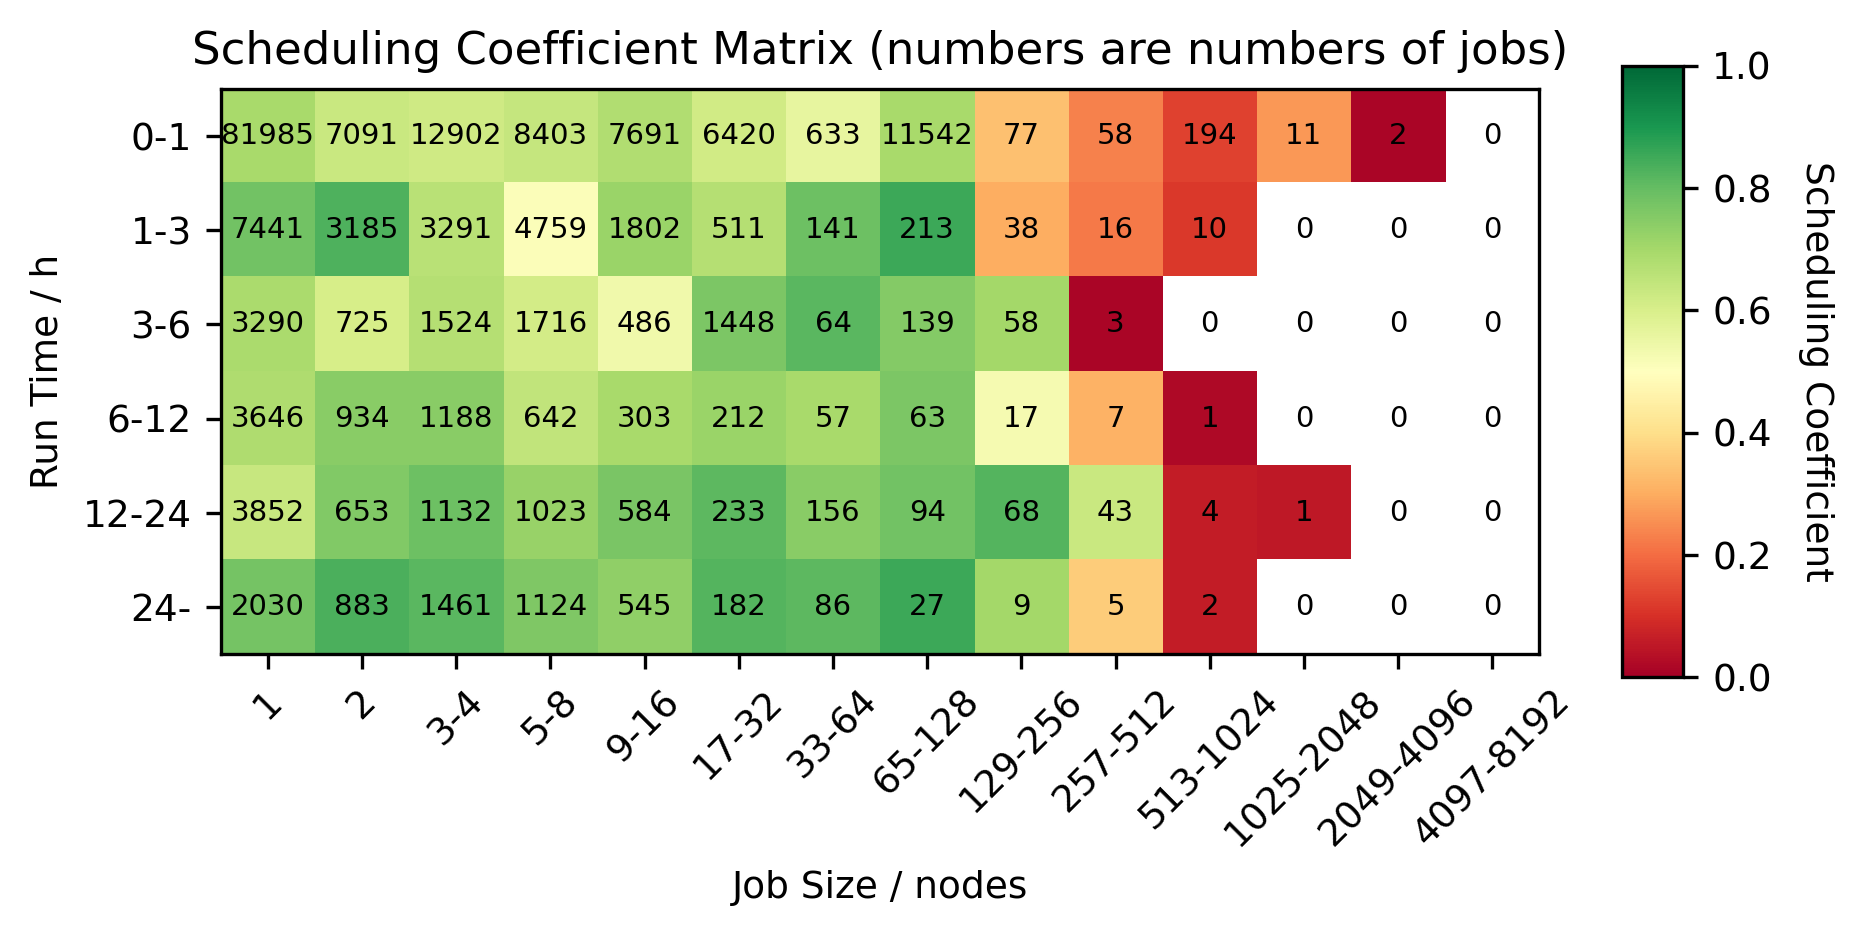
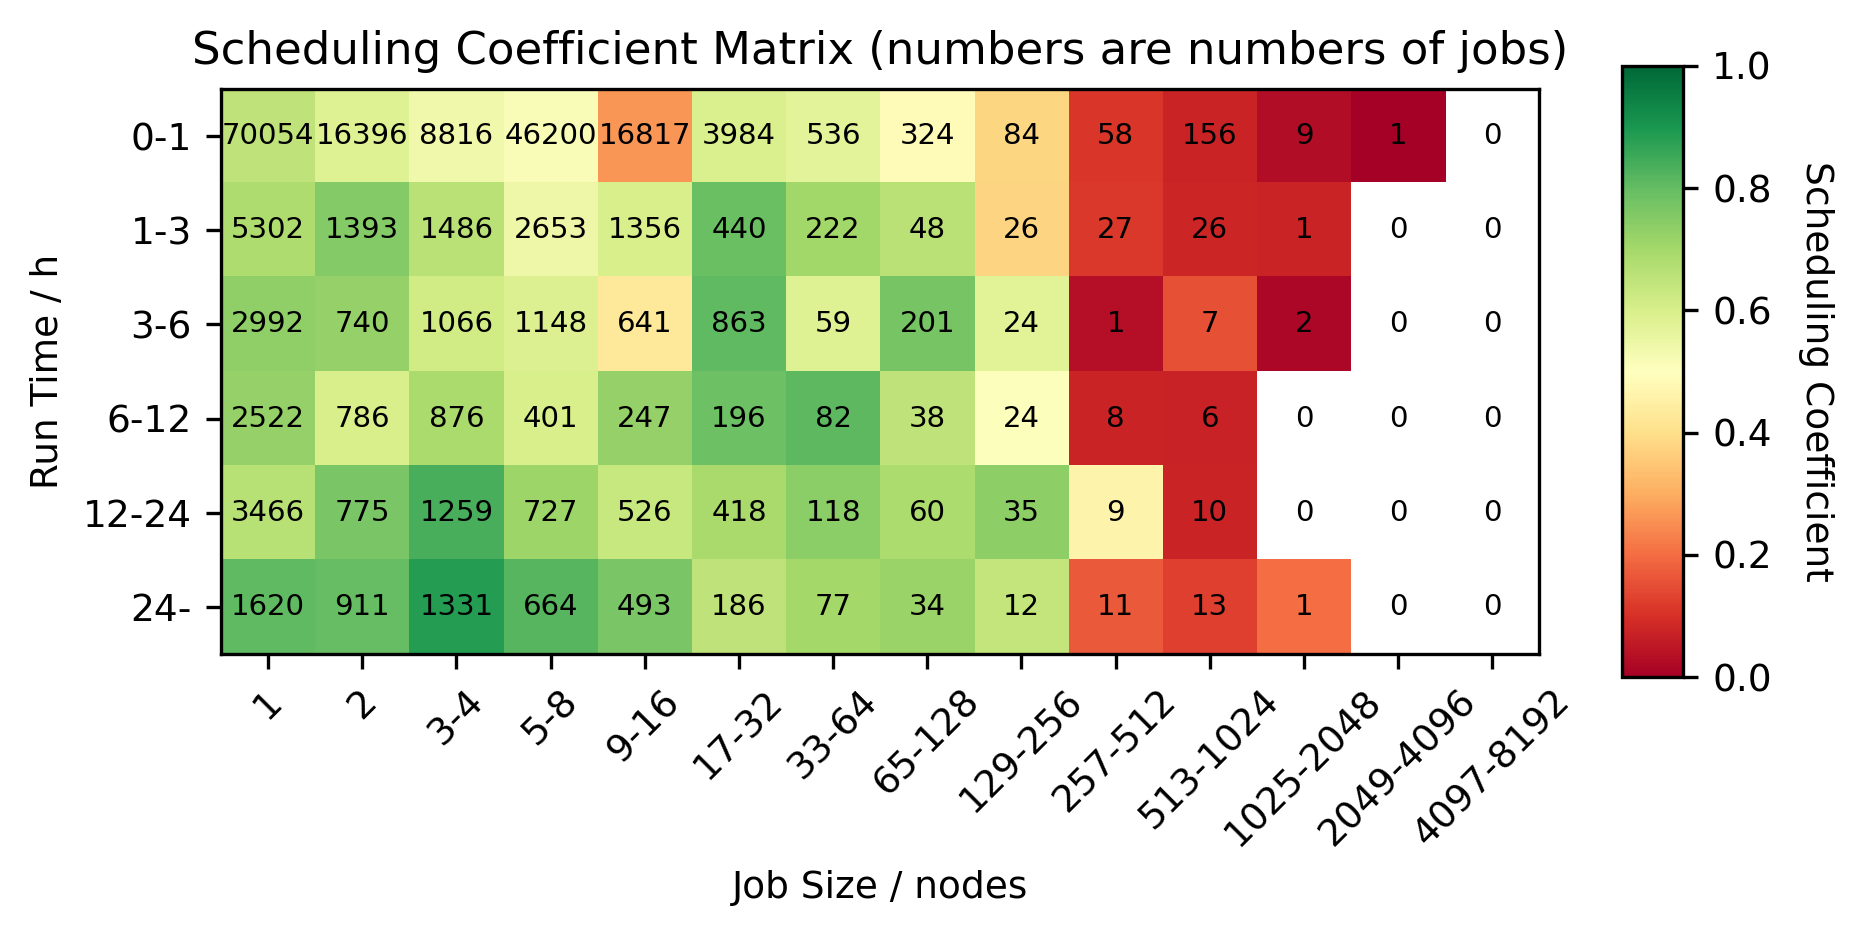
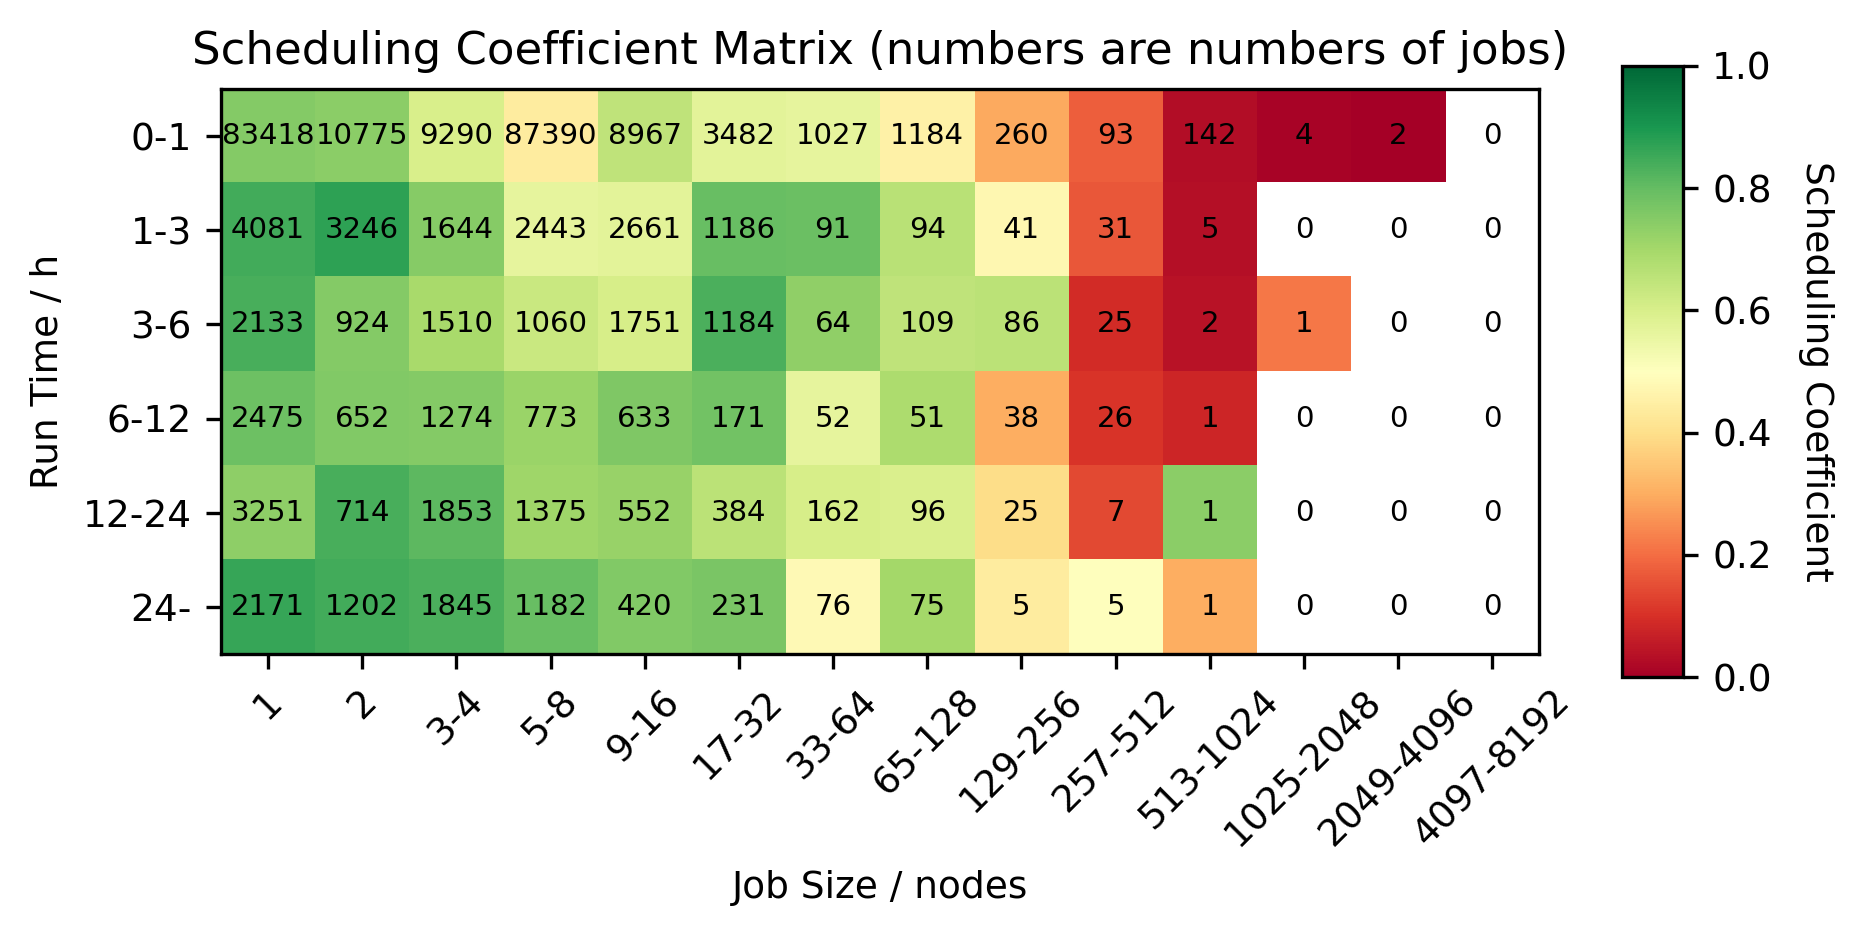
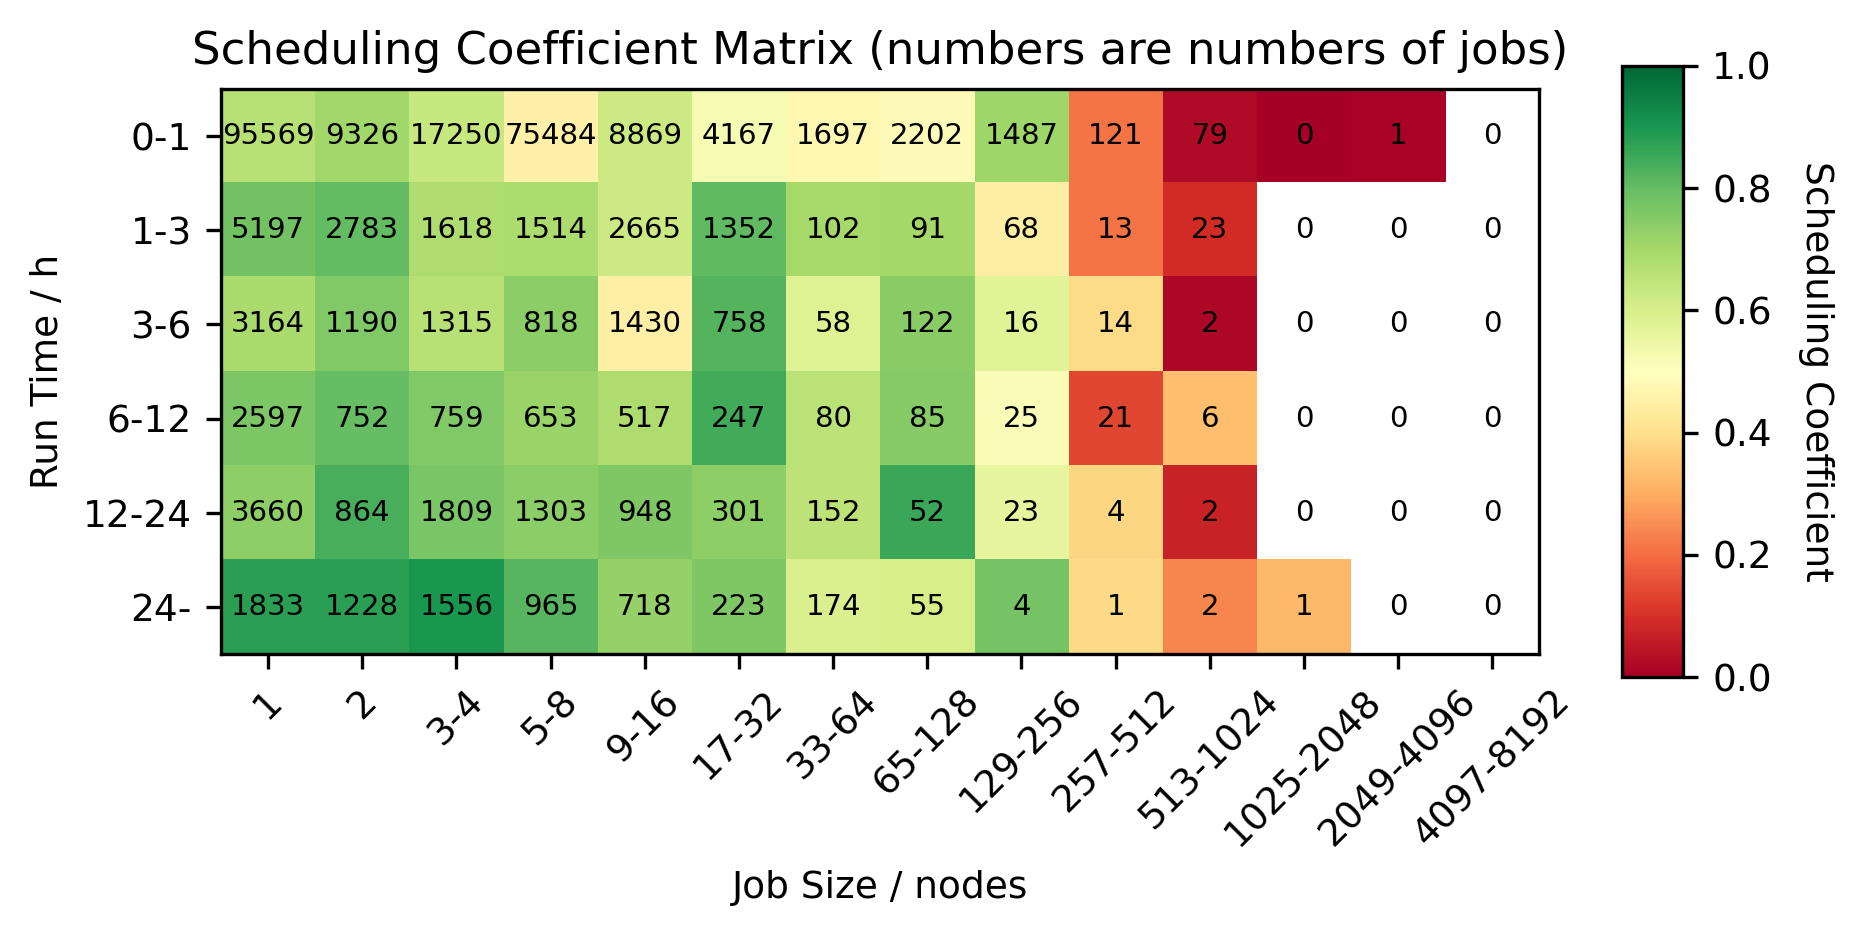
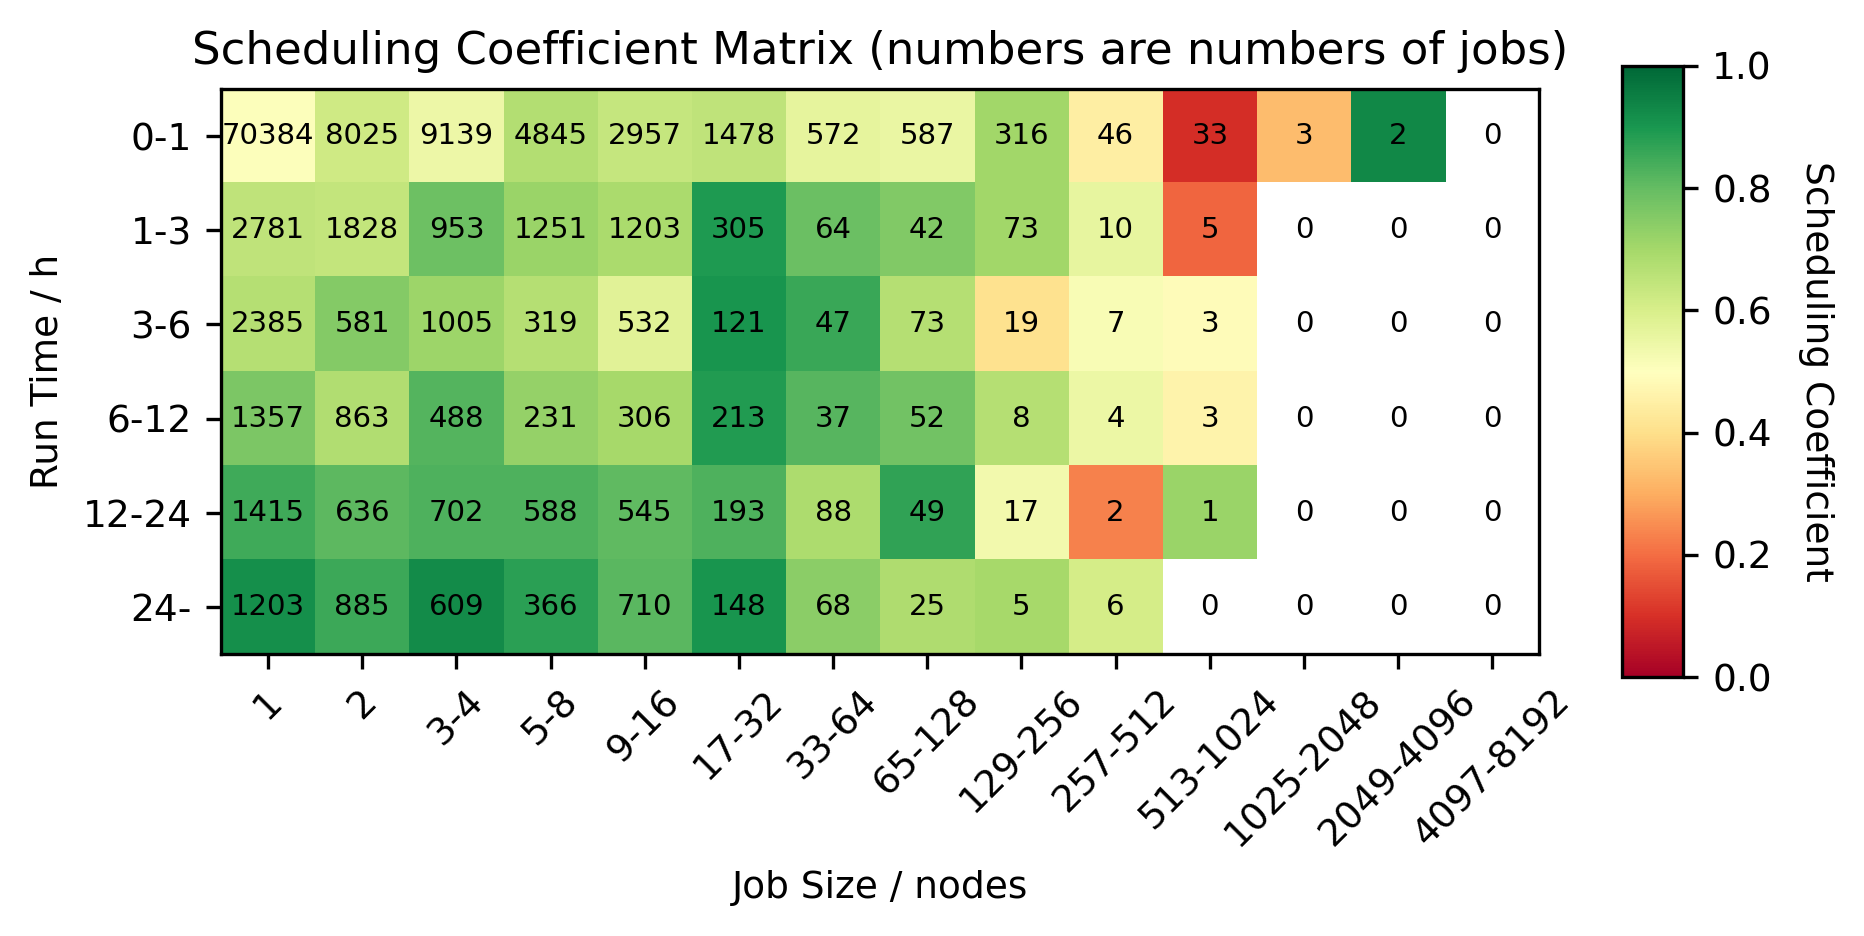
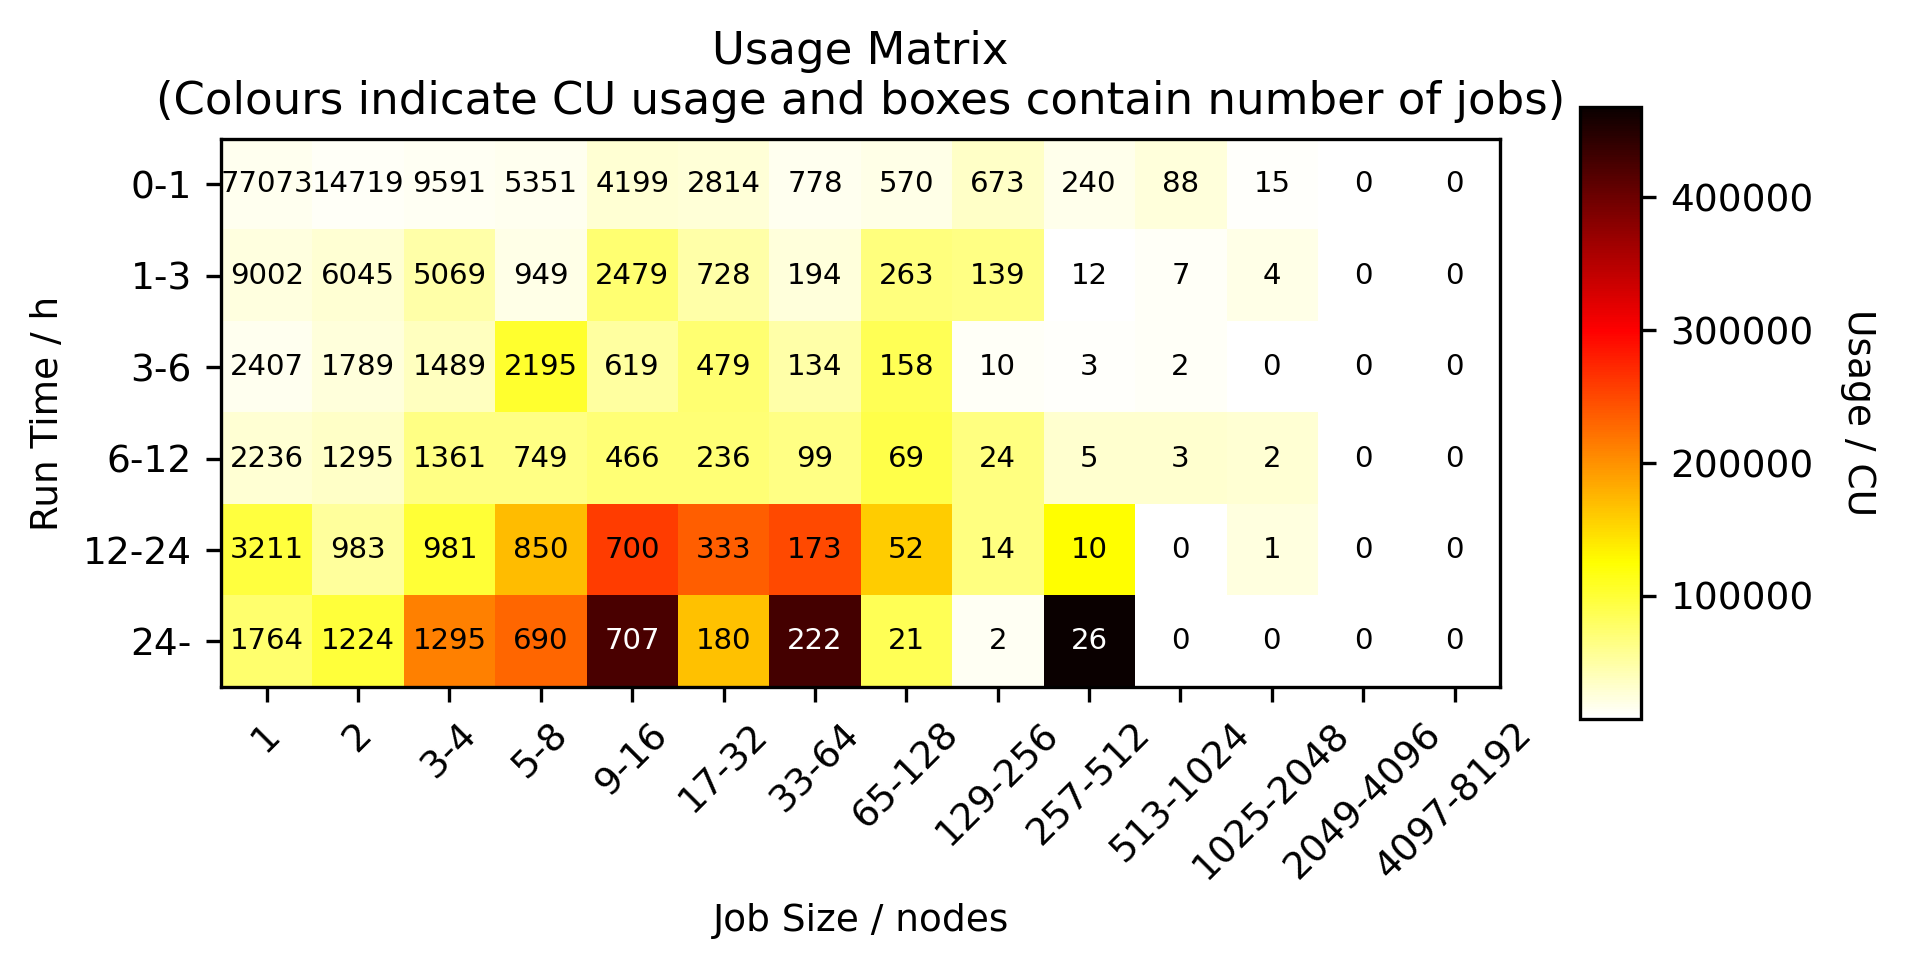
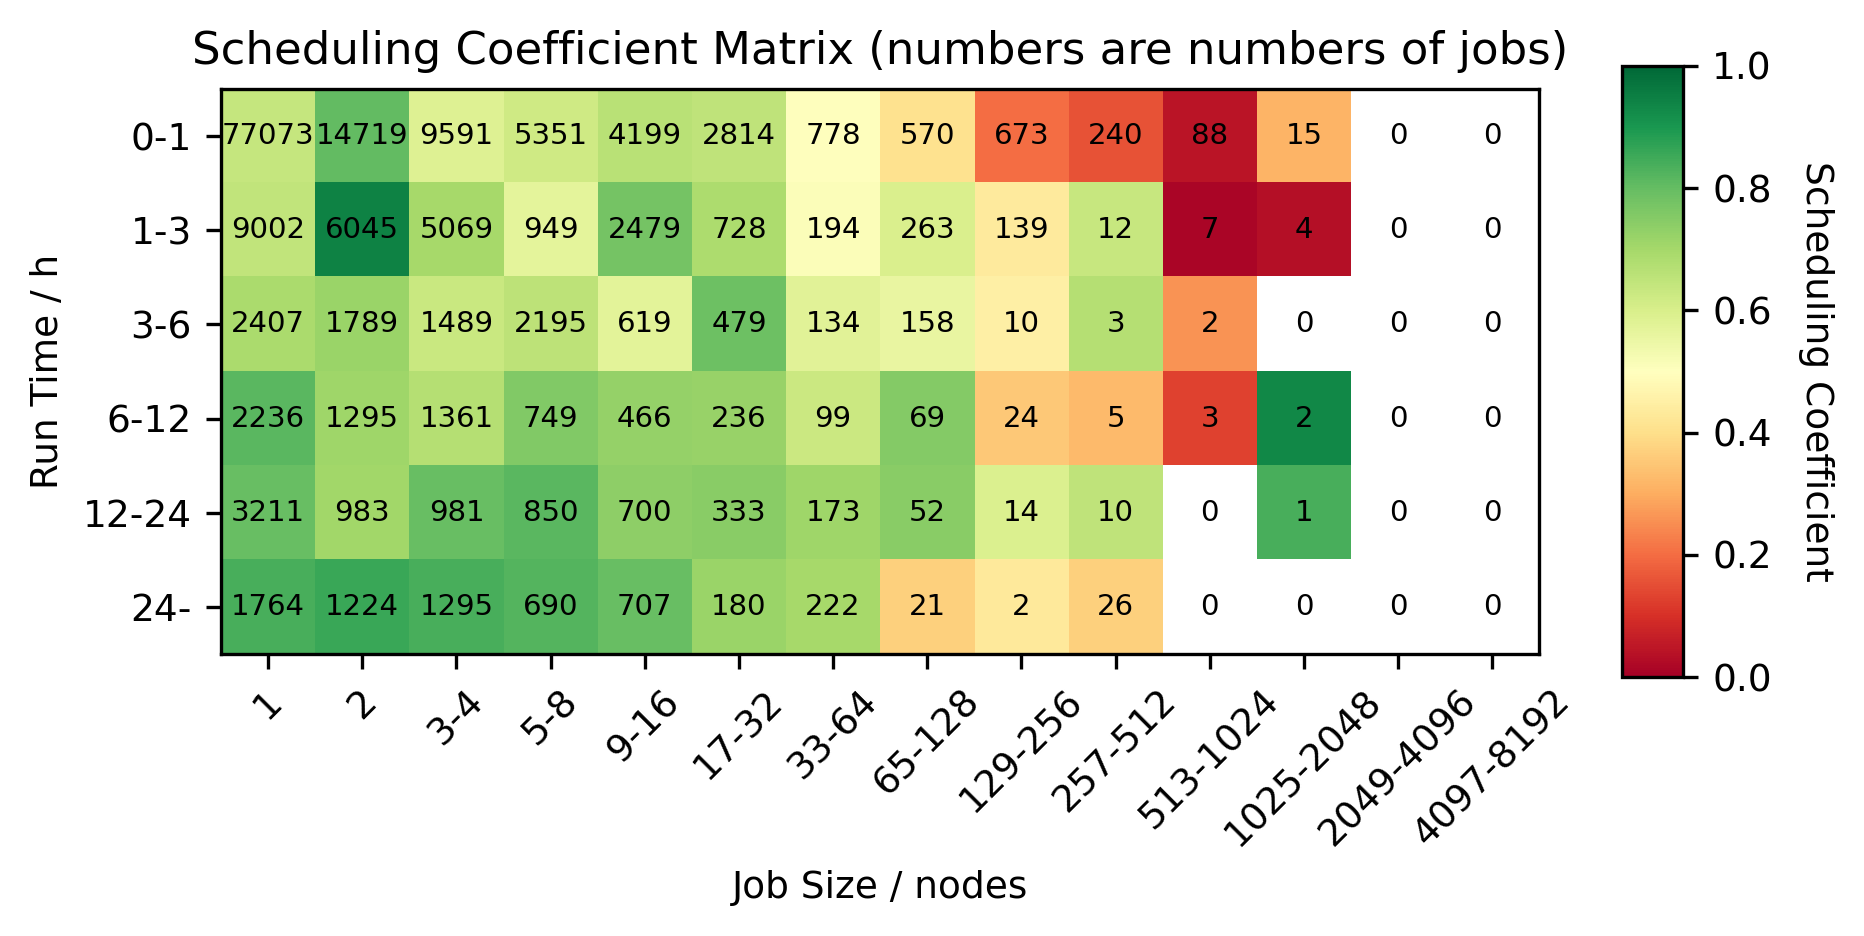
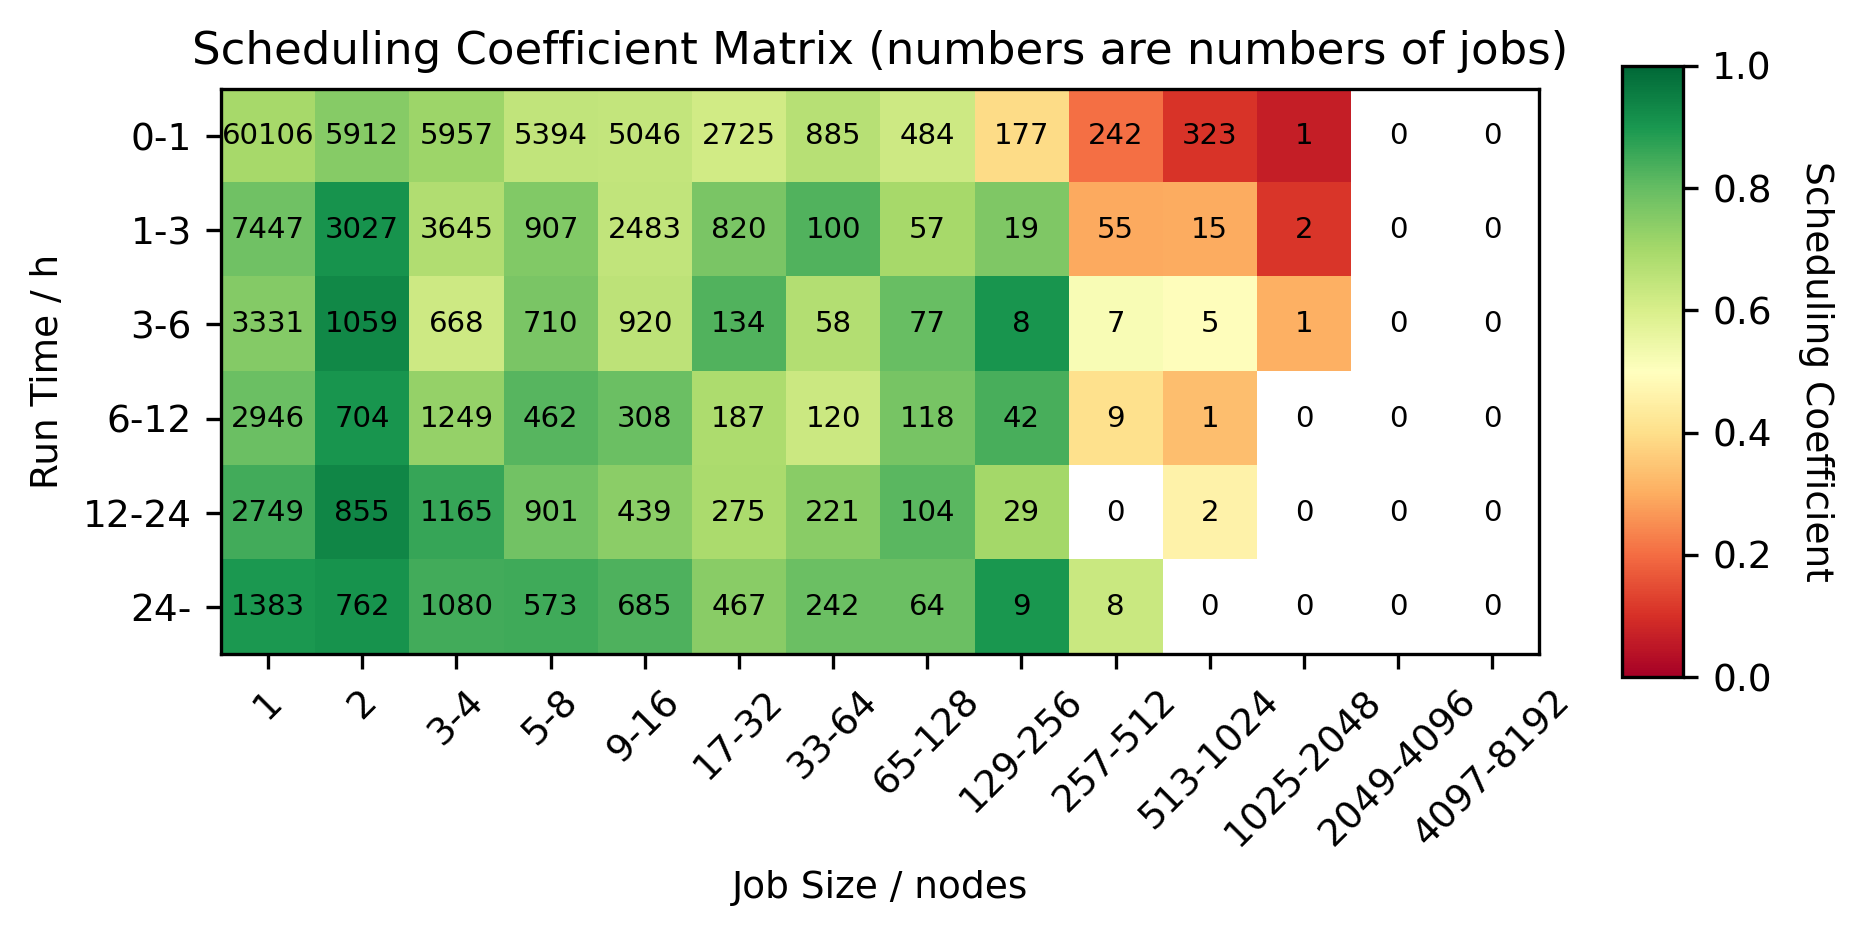
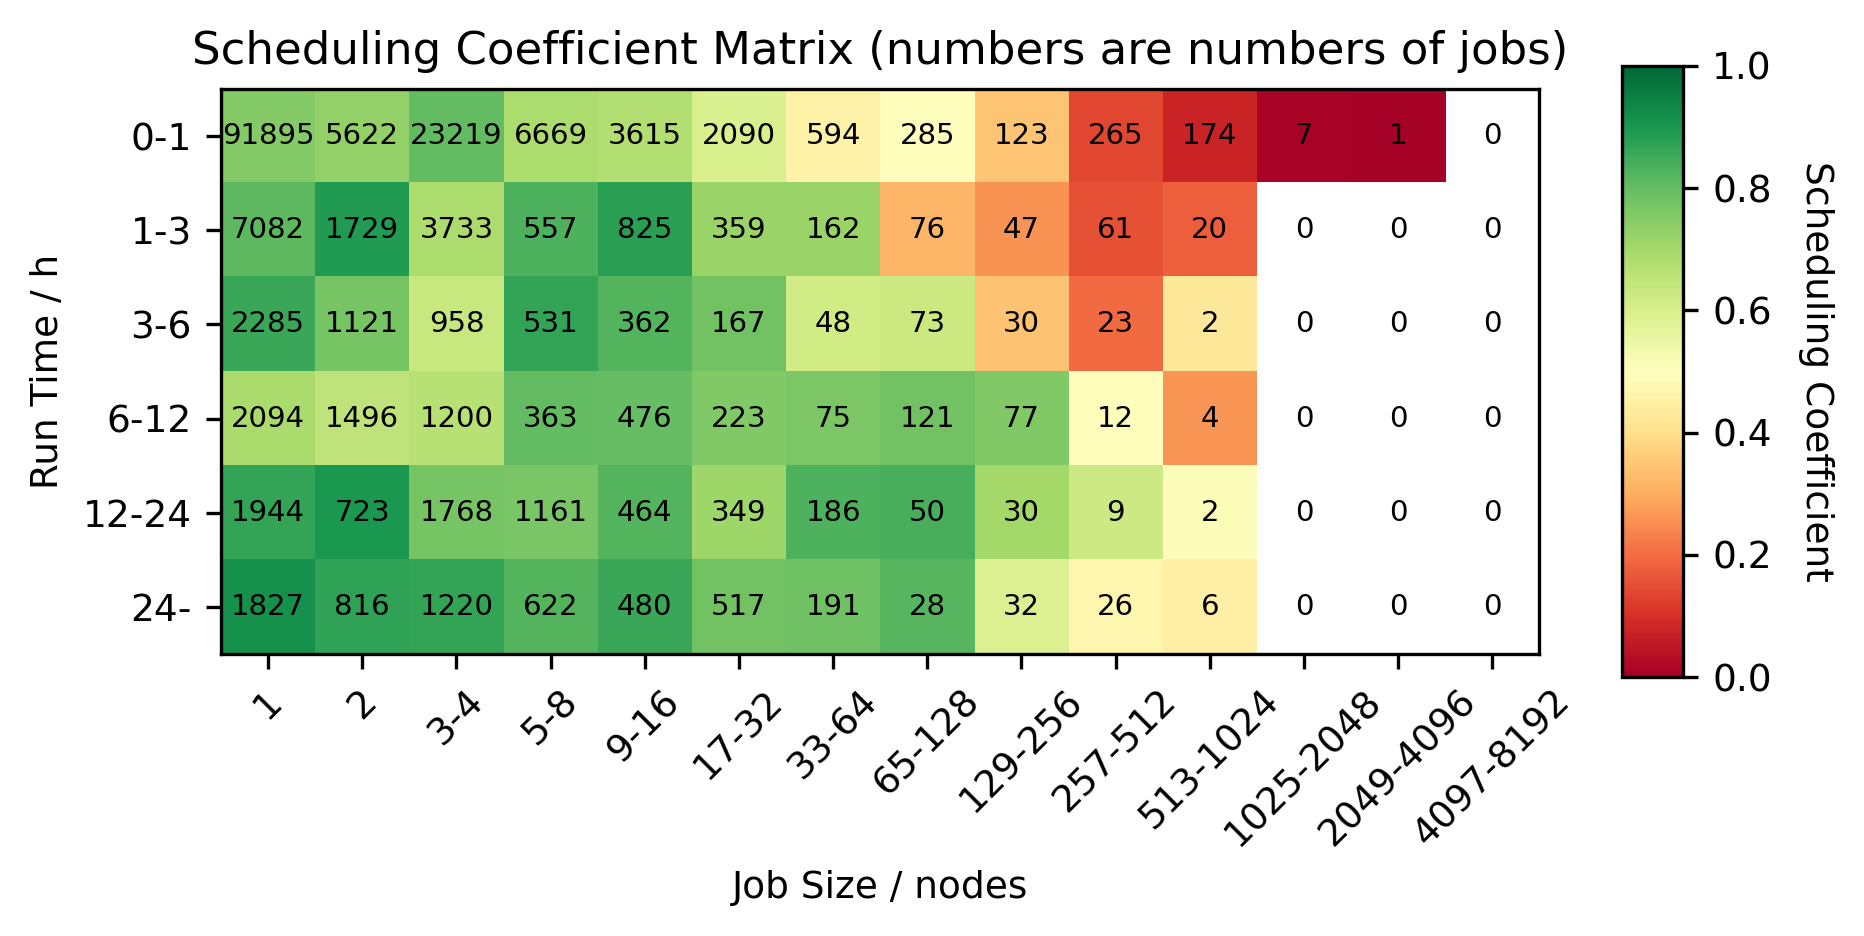
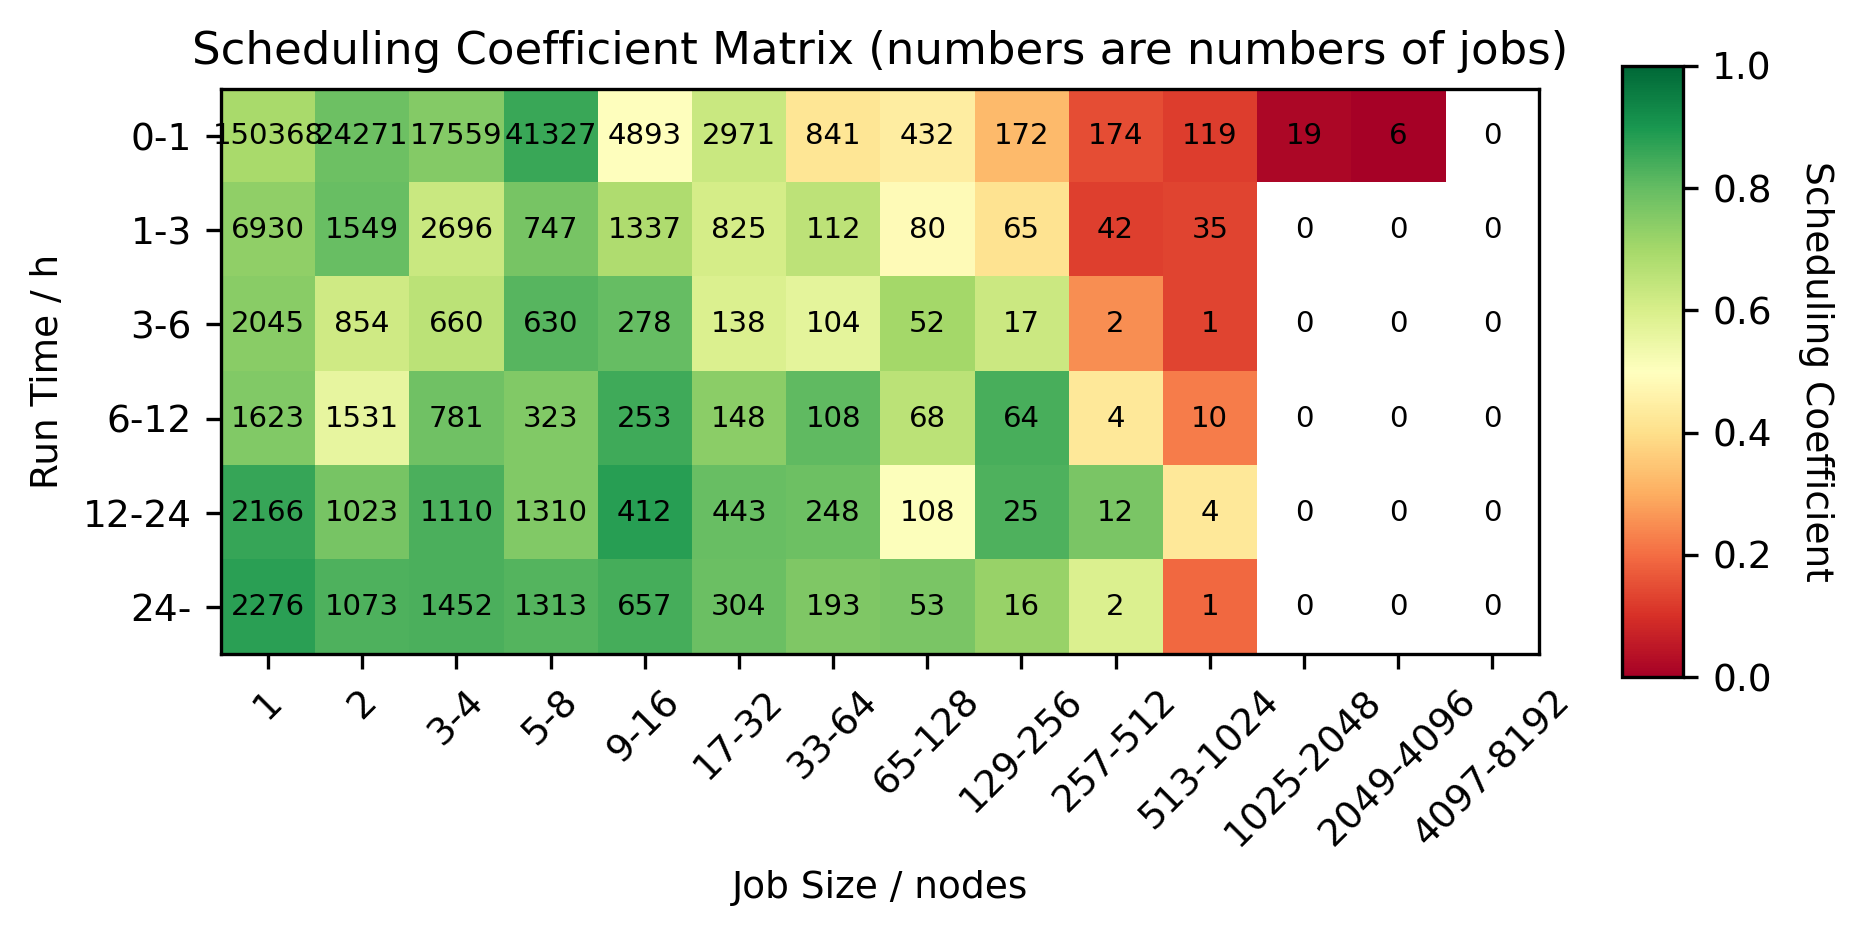
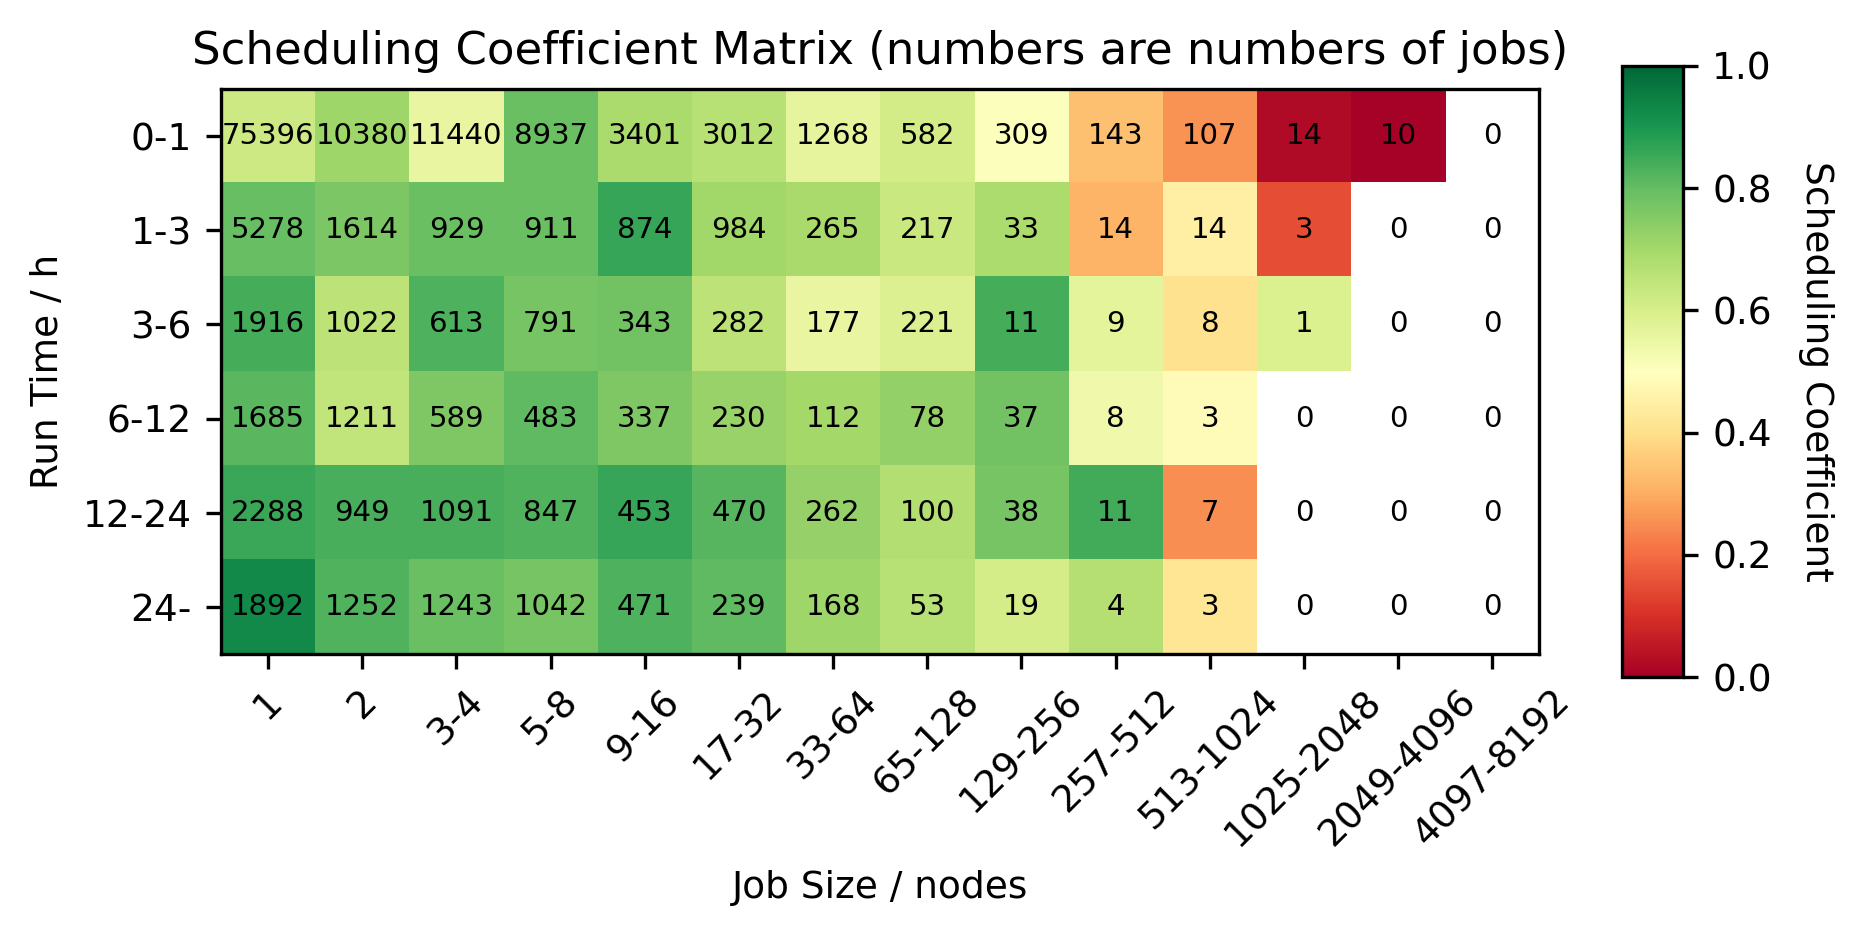
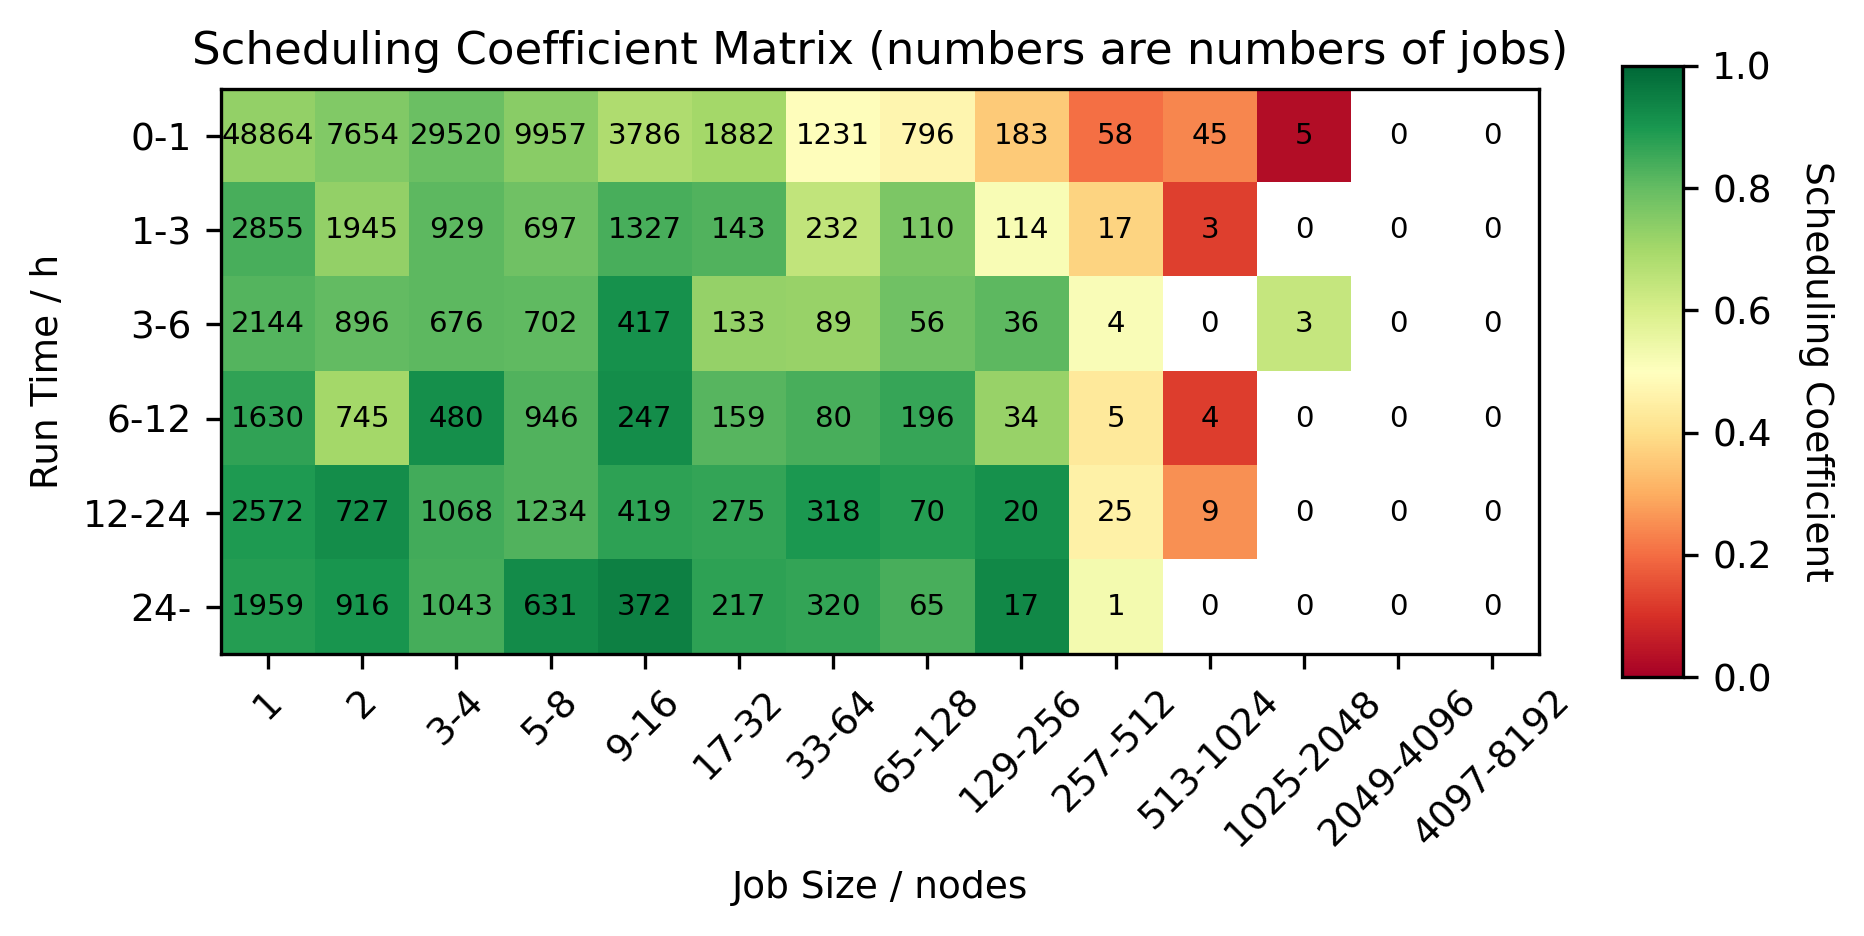
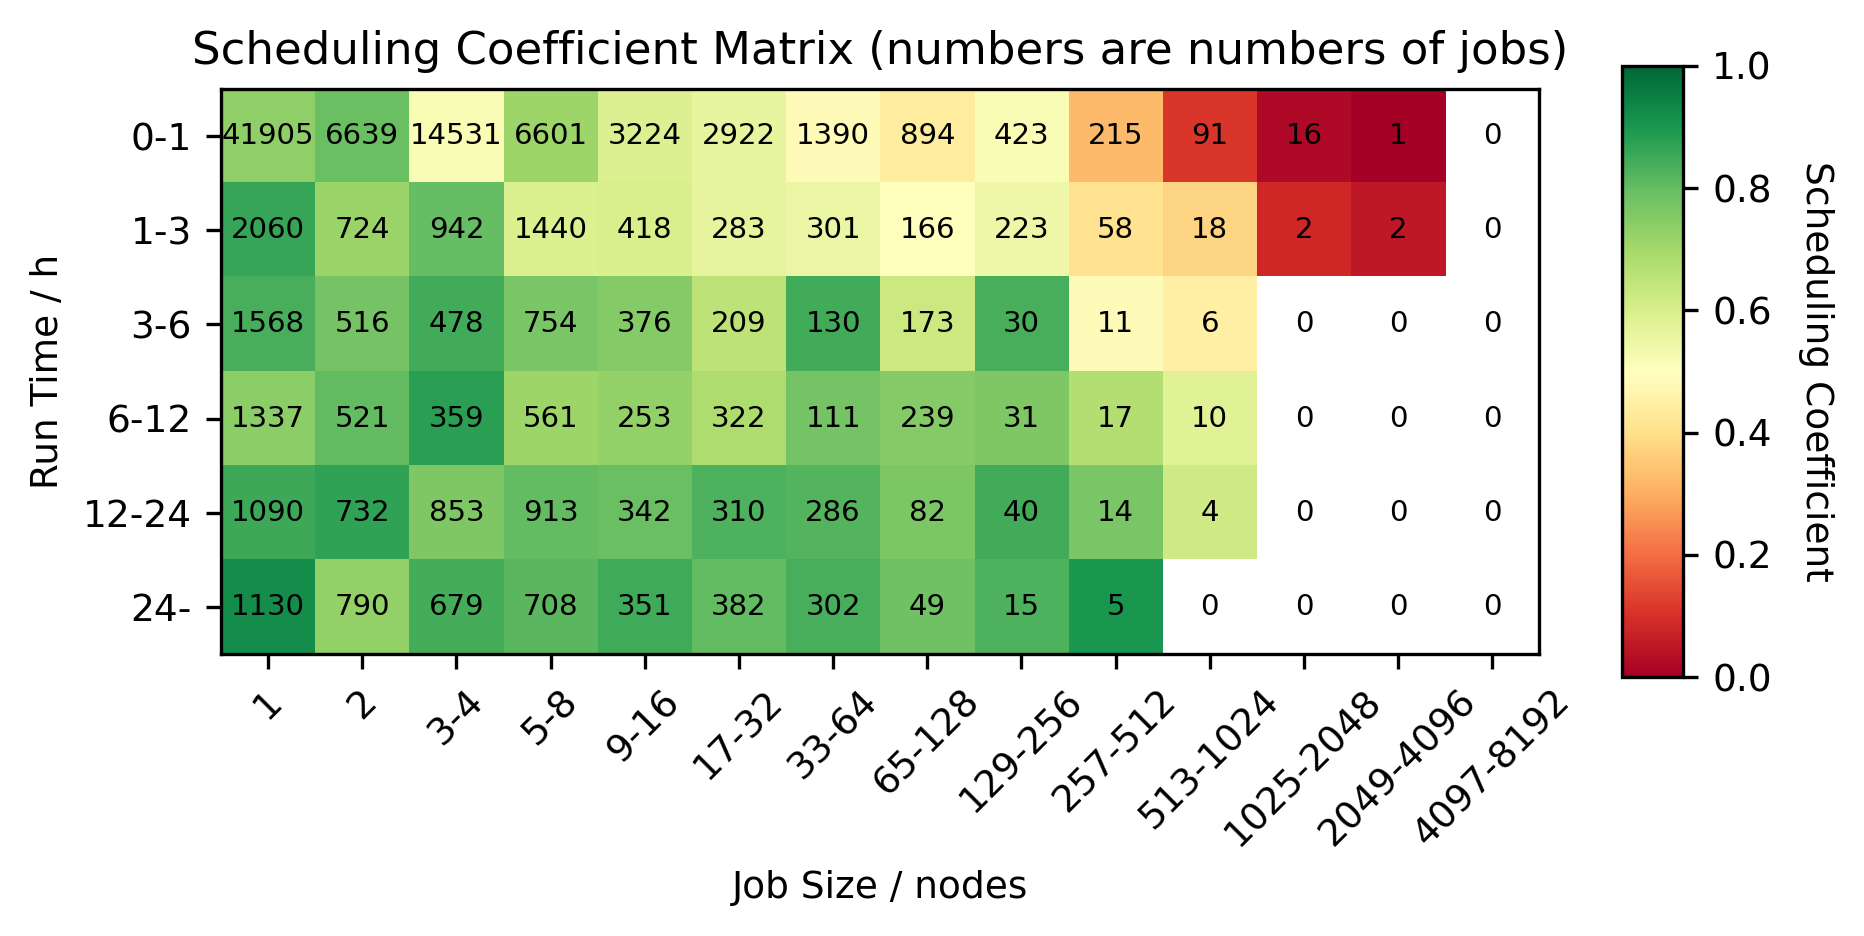
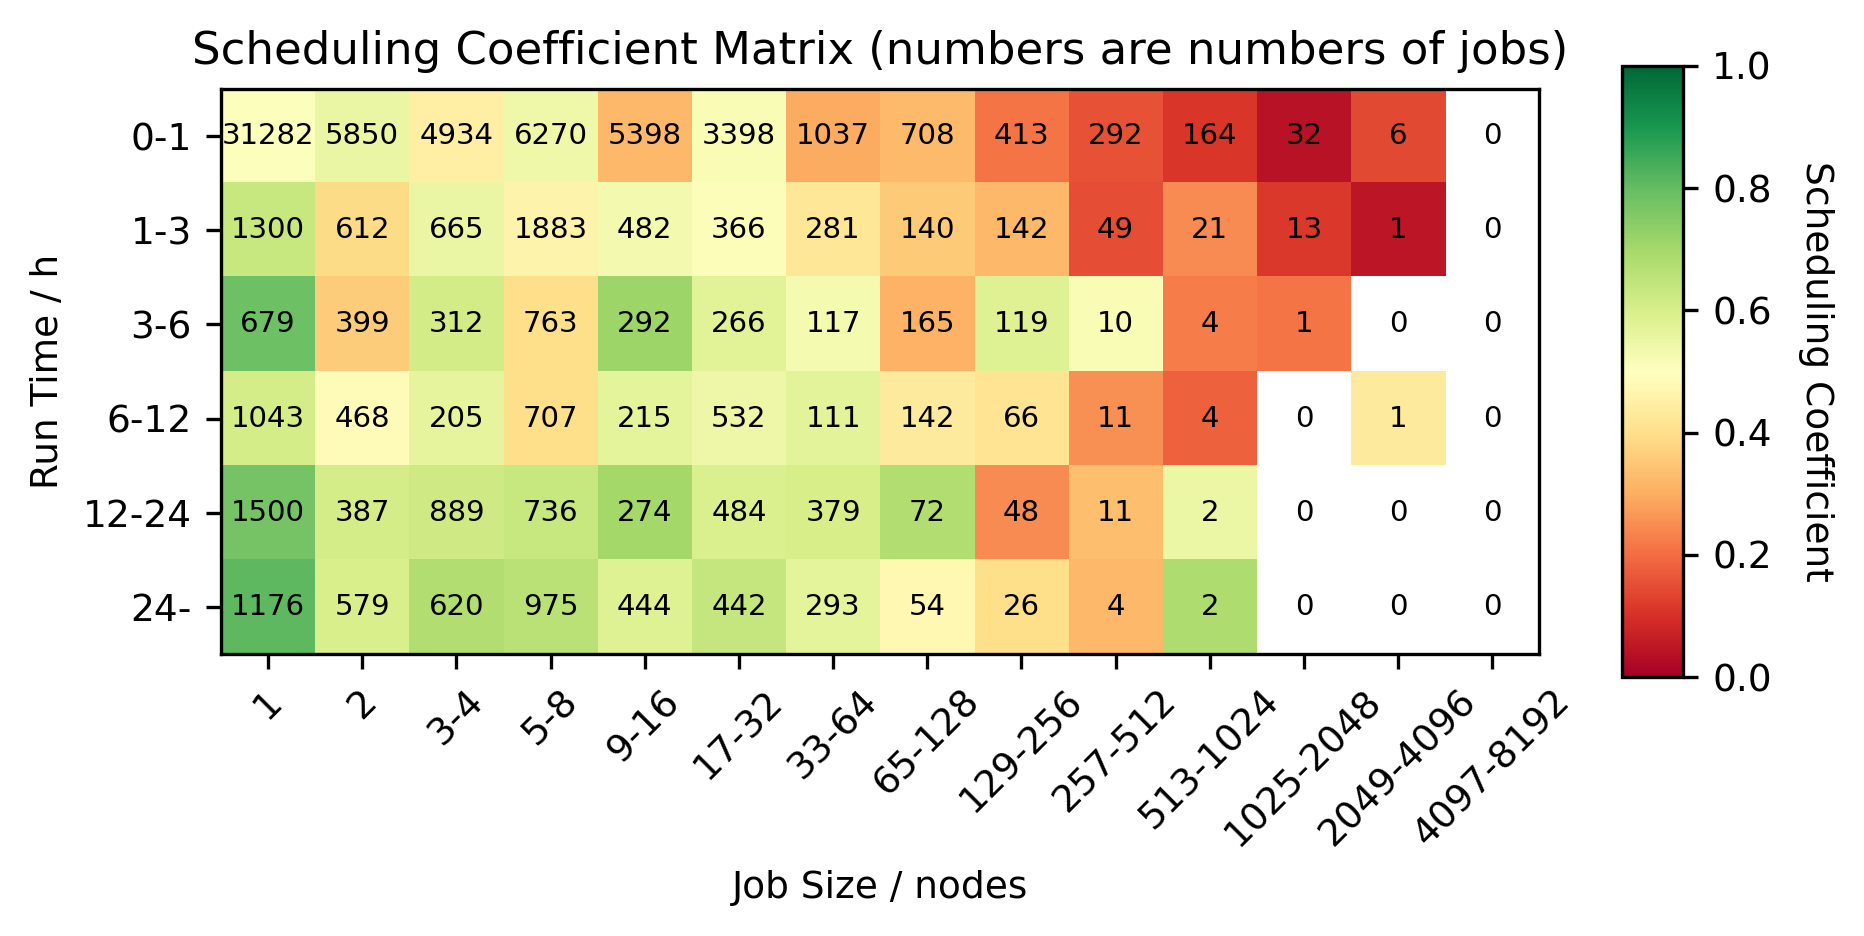
Queue length data
The colour indicates scheduling coefficient which is computed as [run time] divided by [run time + queue time]. A scheduling coefficient of 1 indicates that there was zero time queuing, a scheduling coefficient of 0.5 means that the job spent as long queuing as it did running.
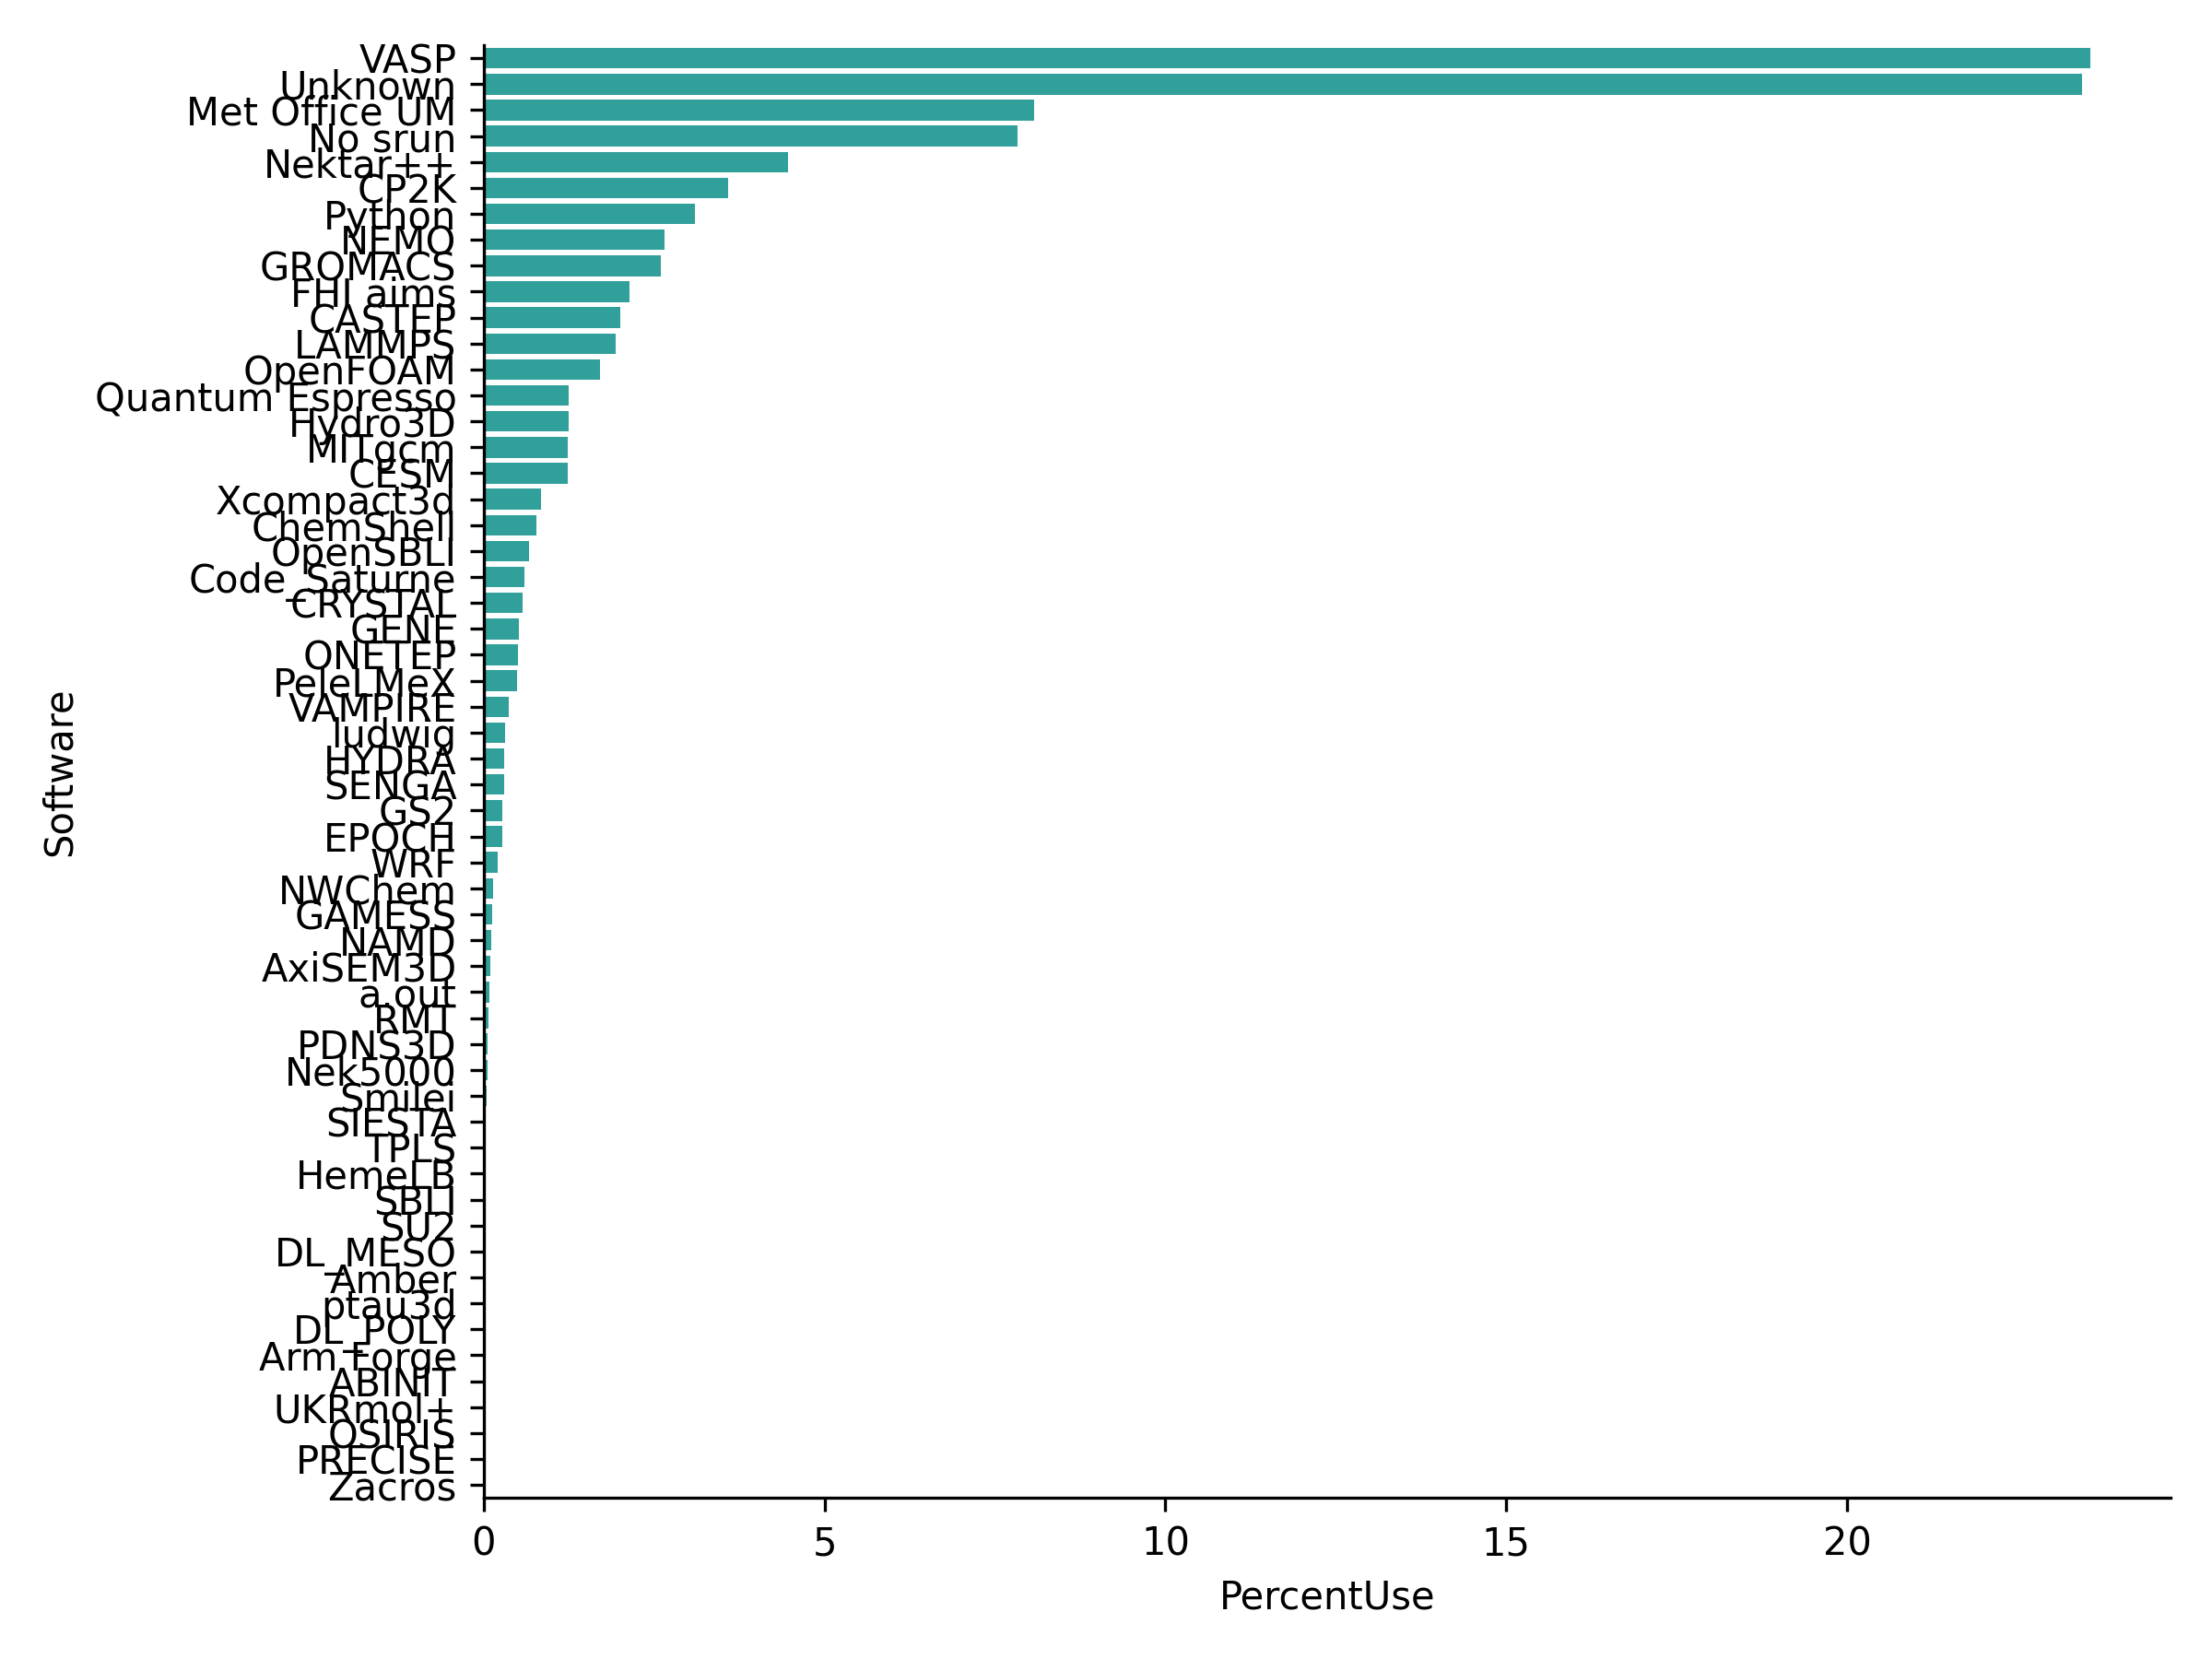
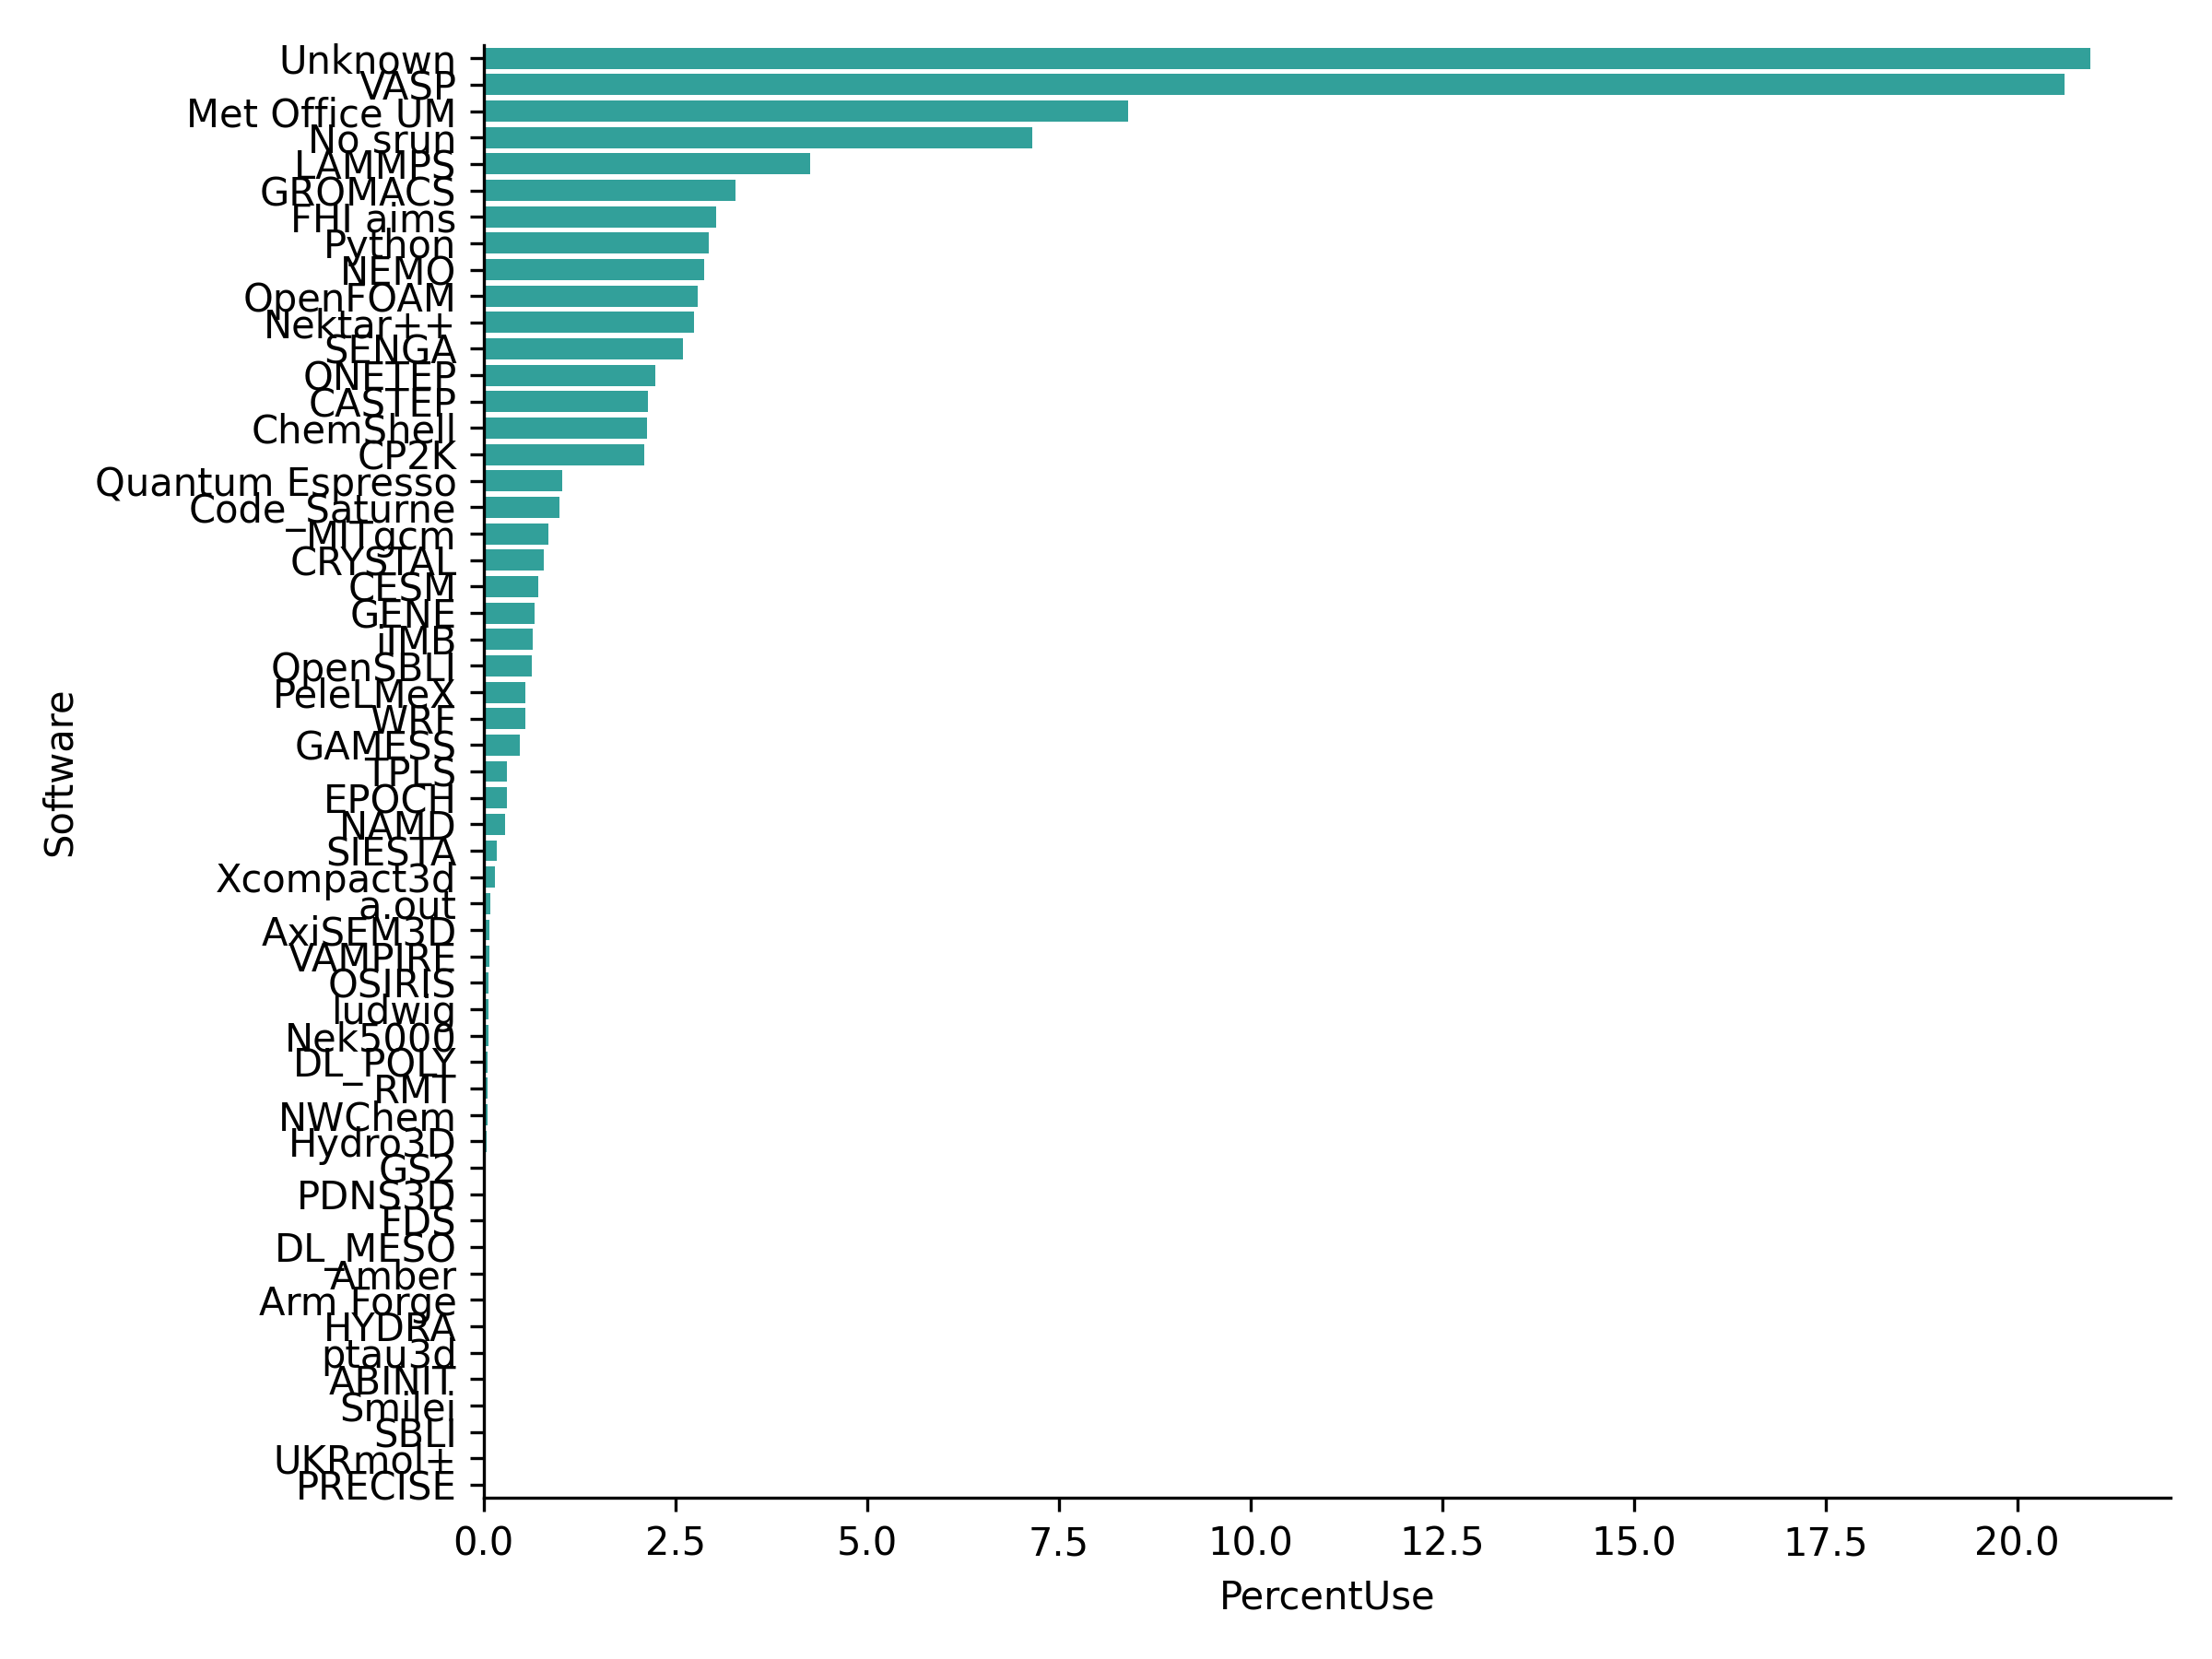
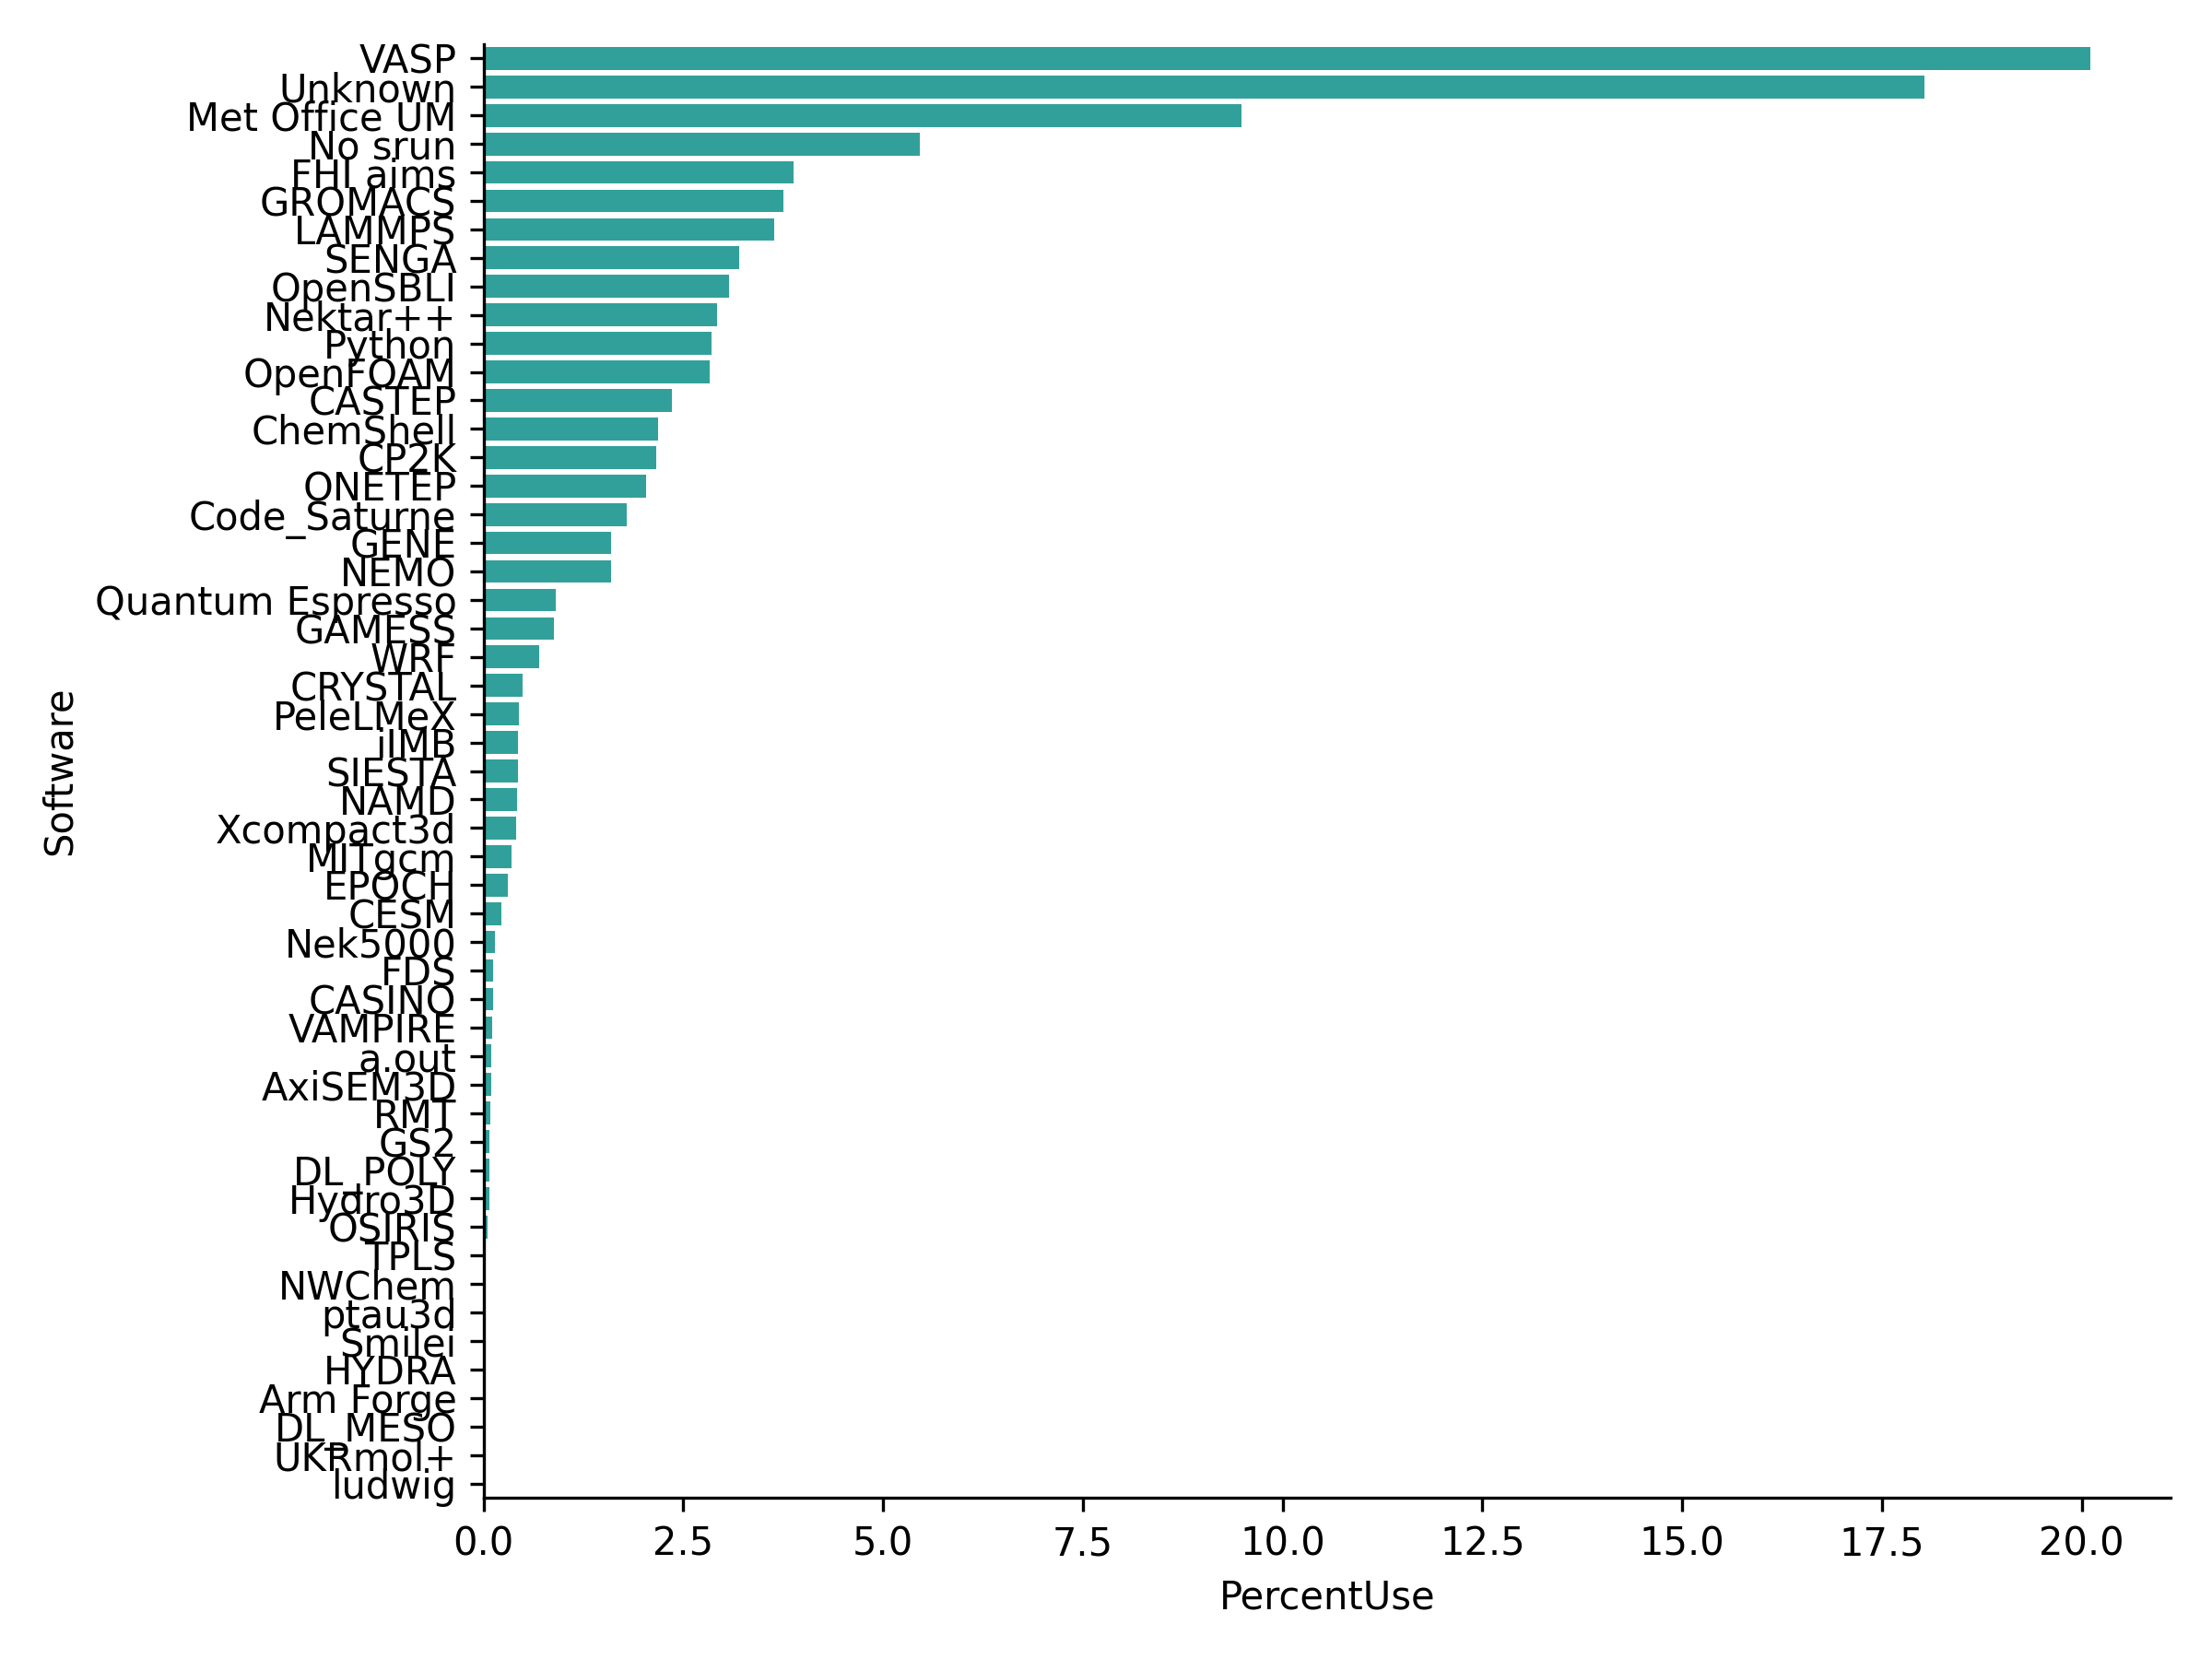
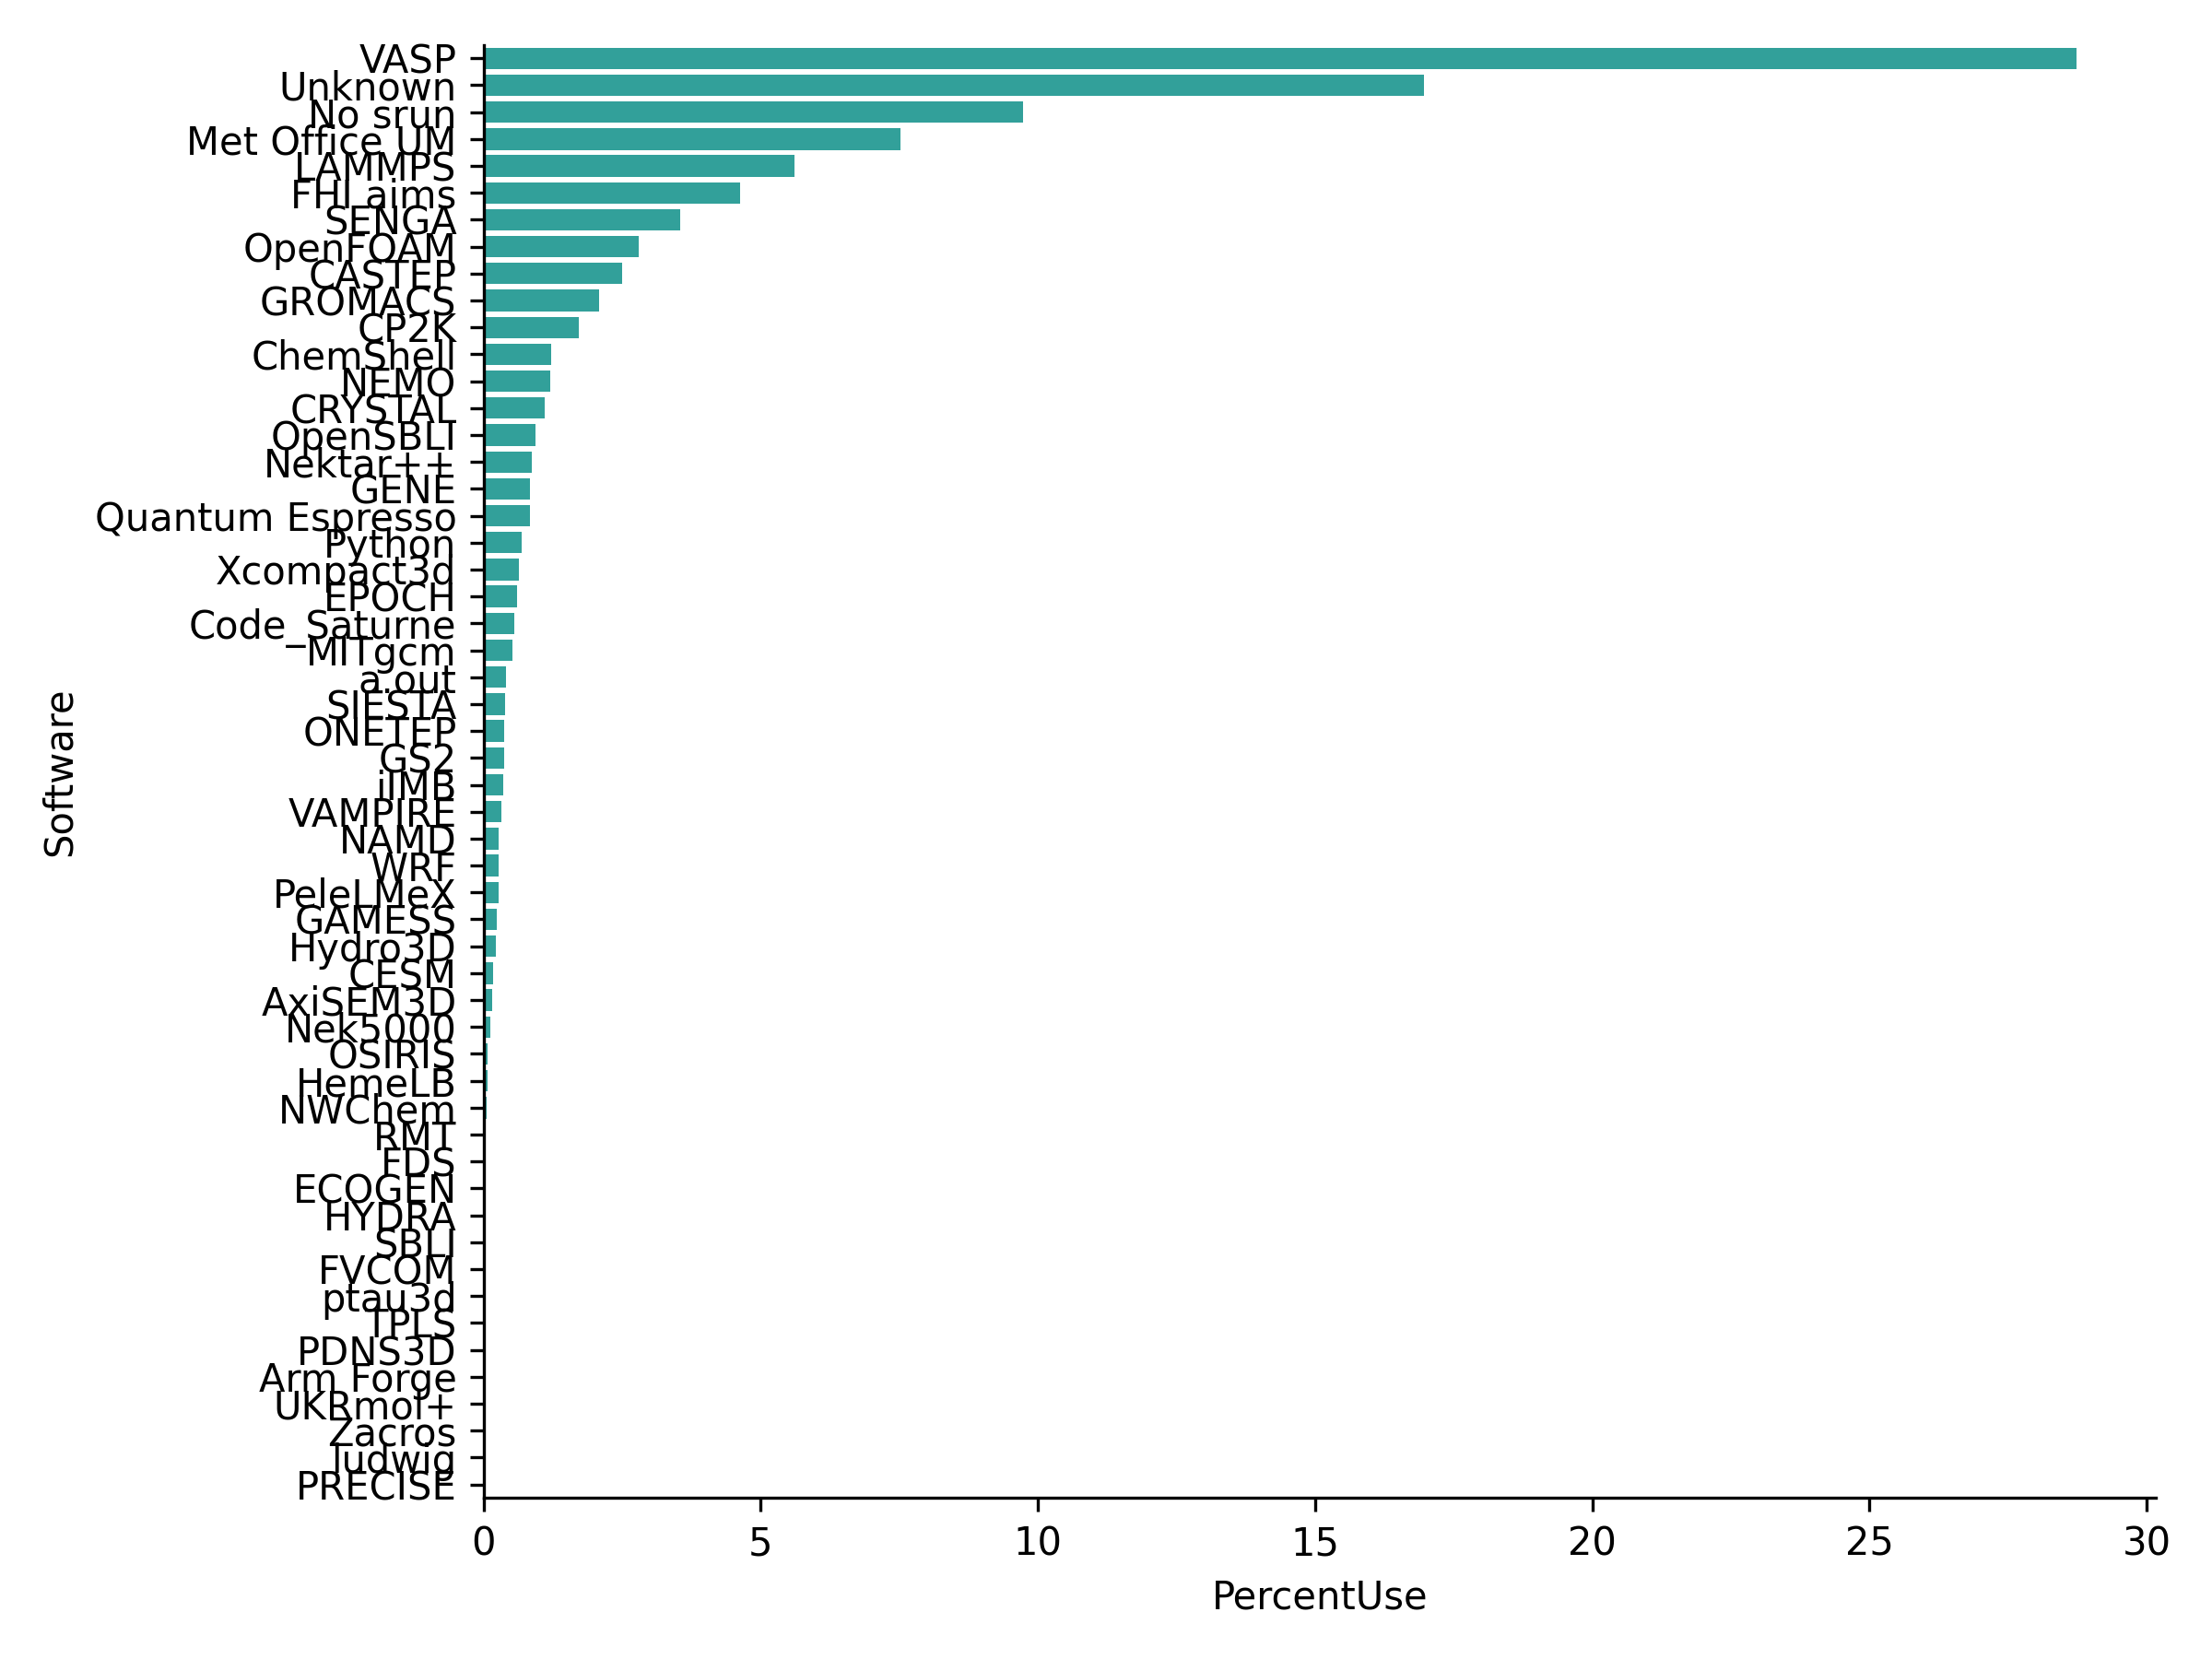
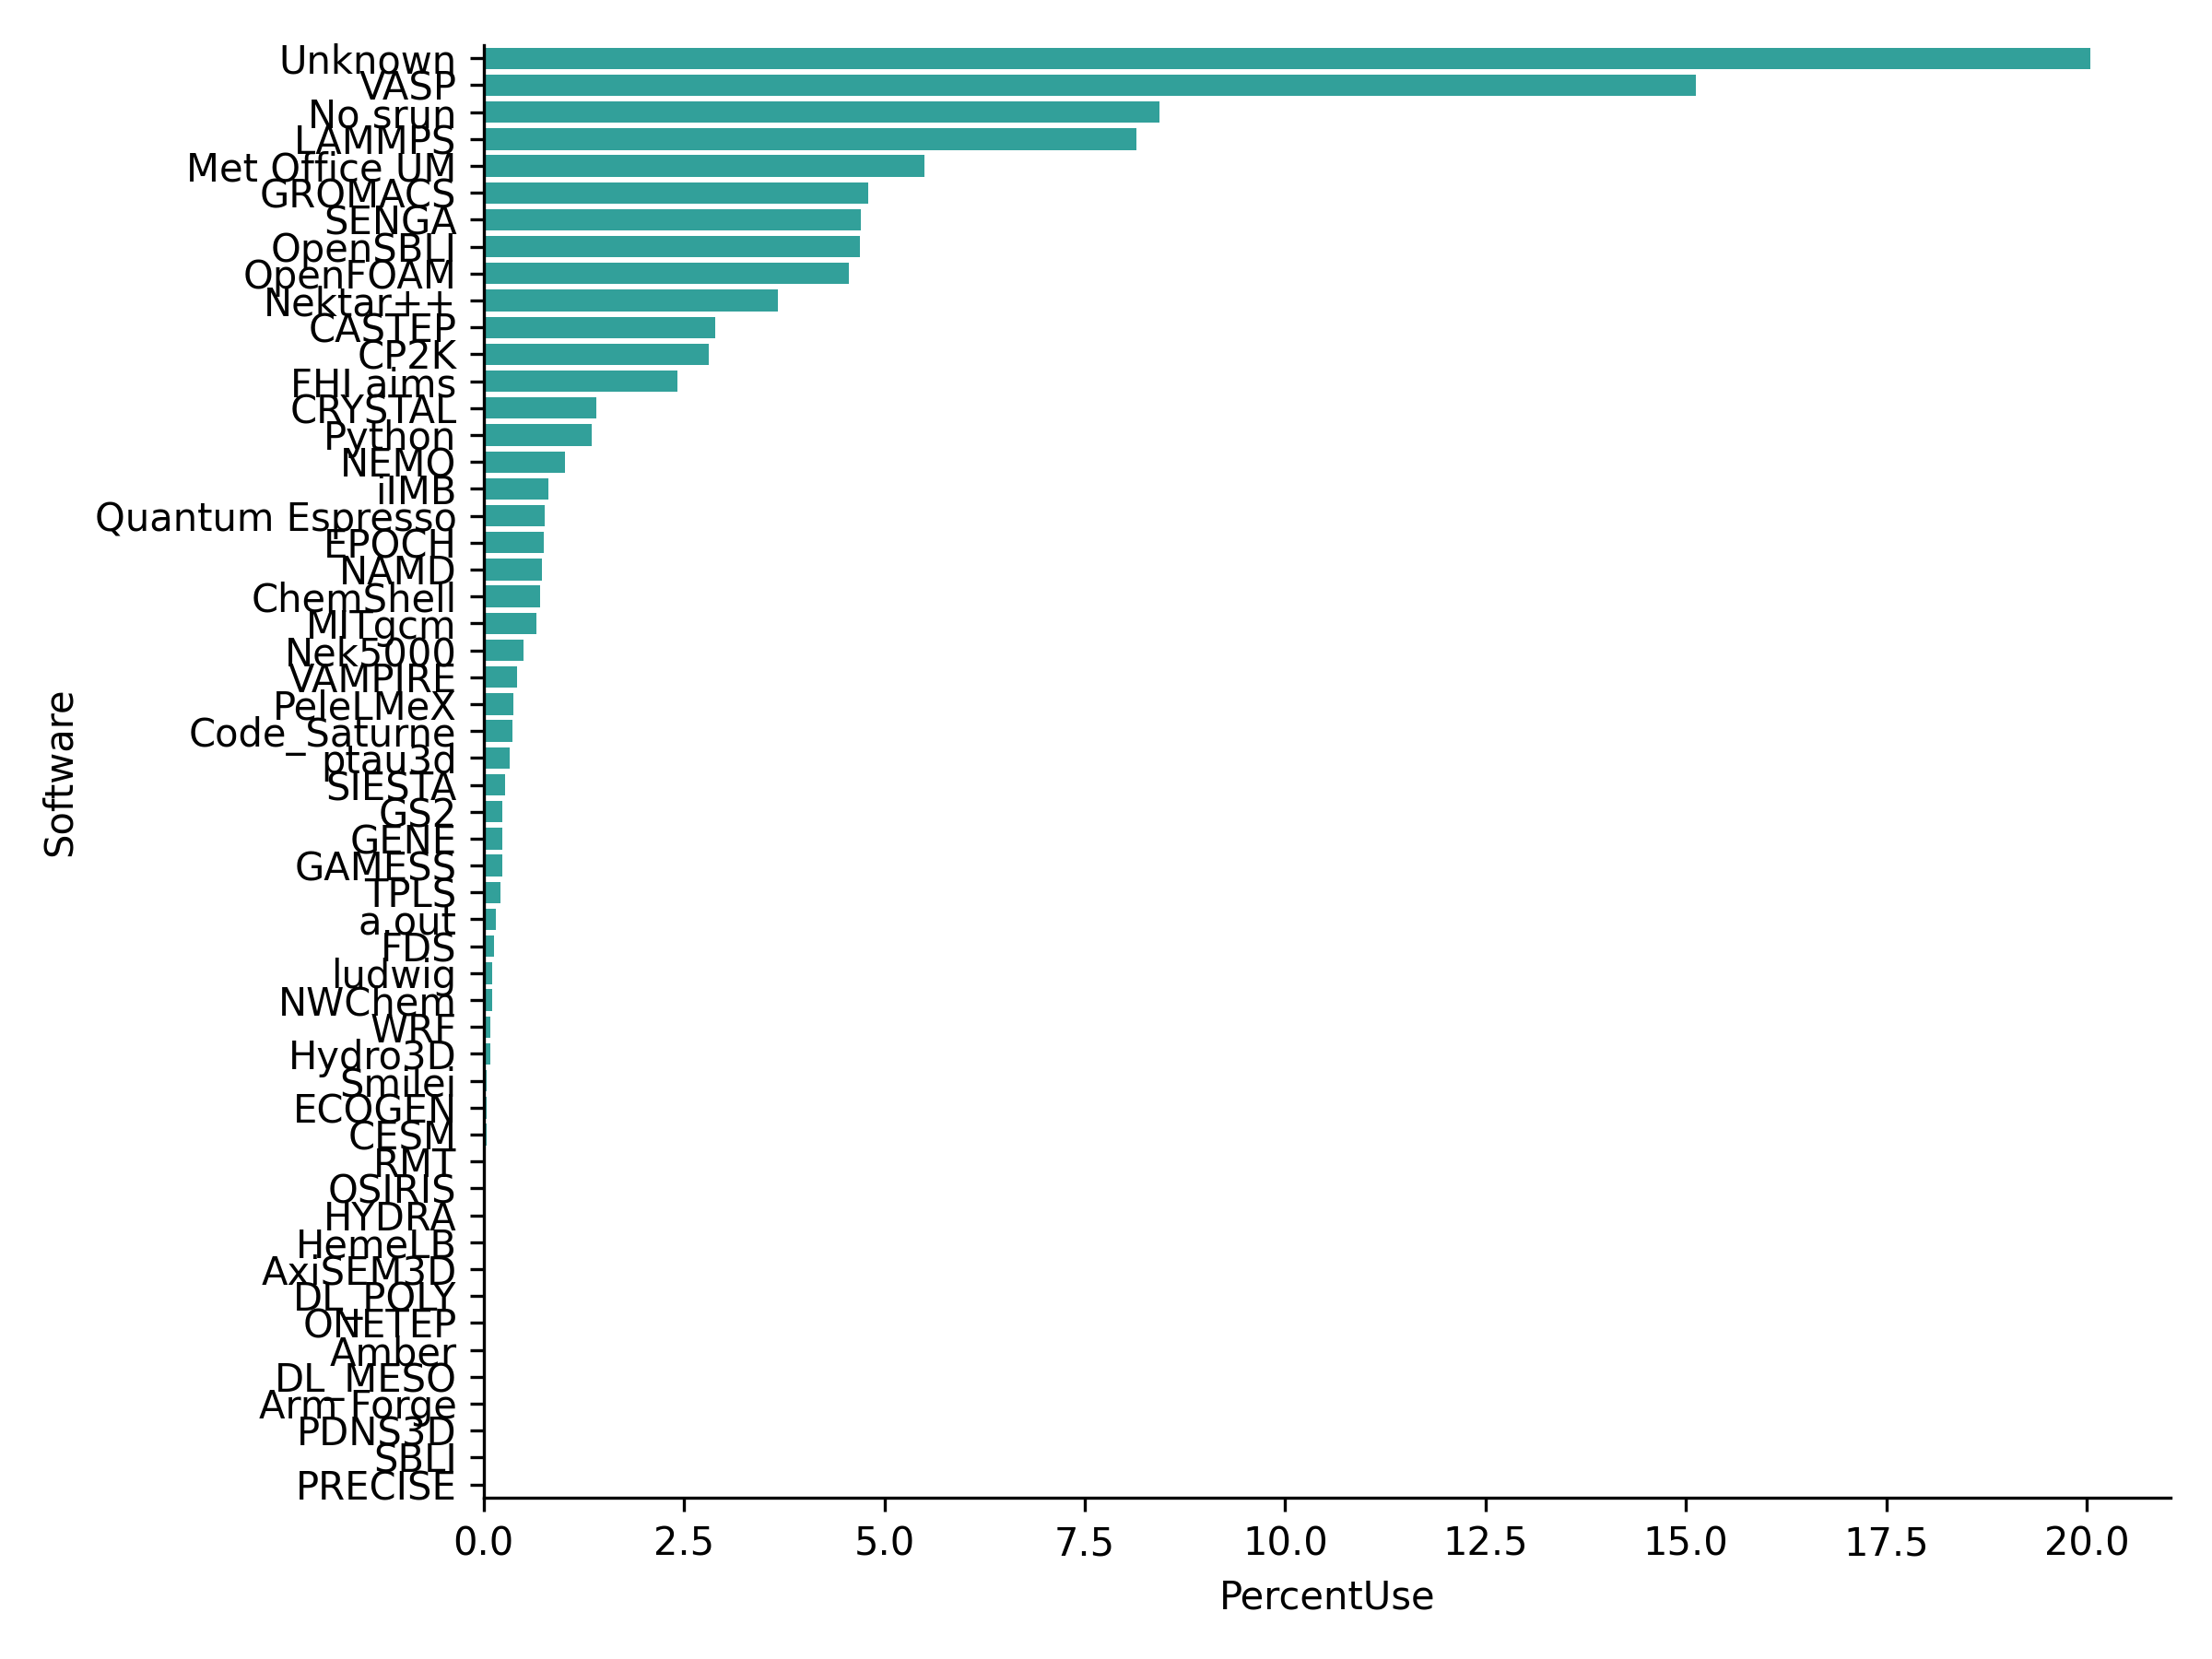
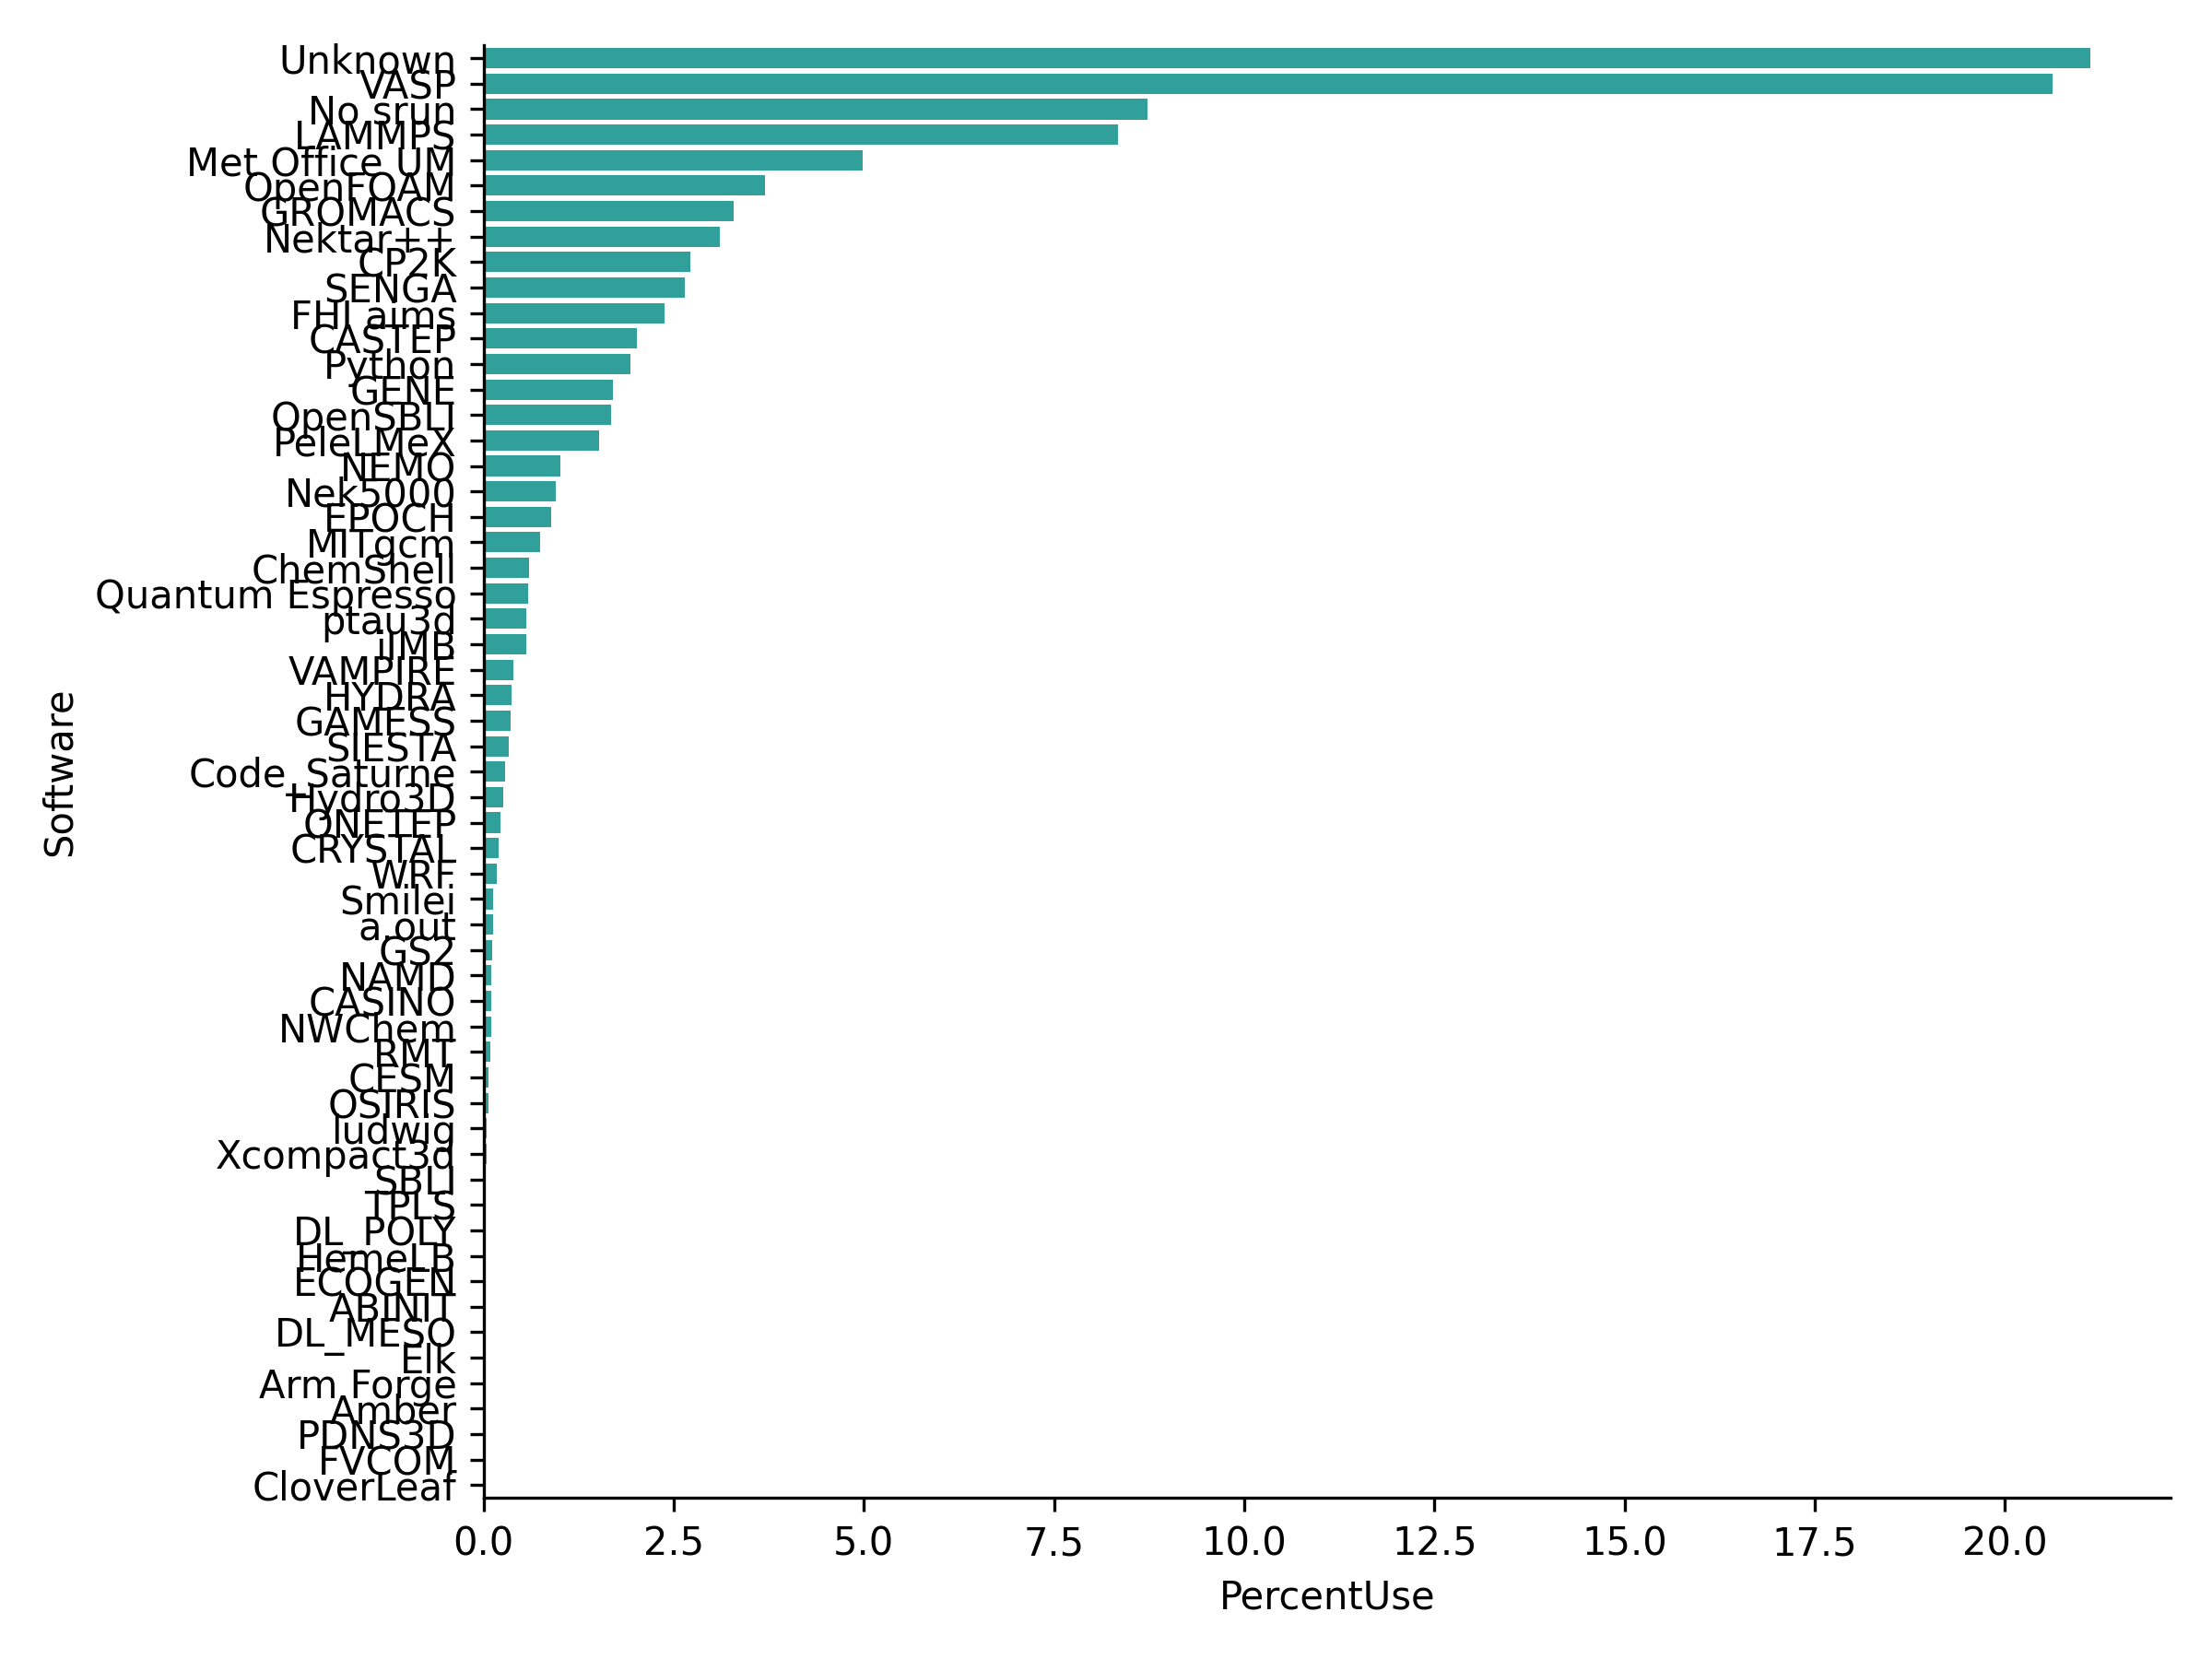
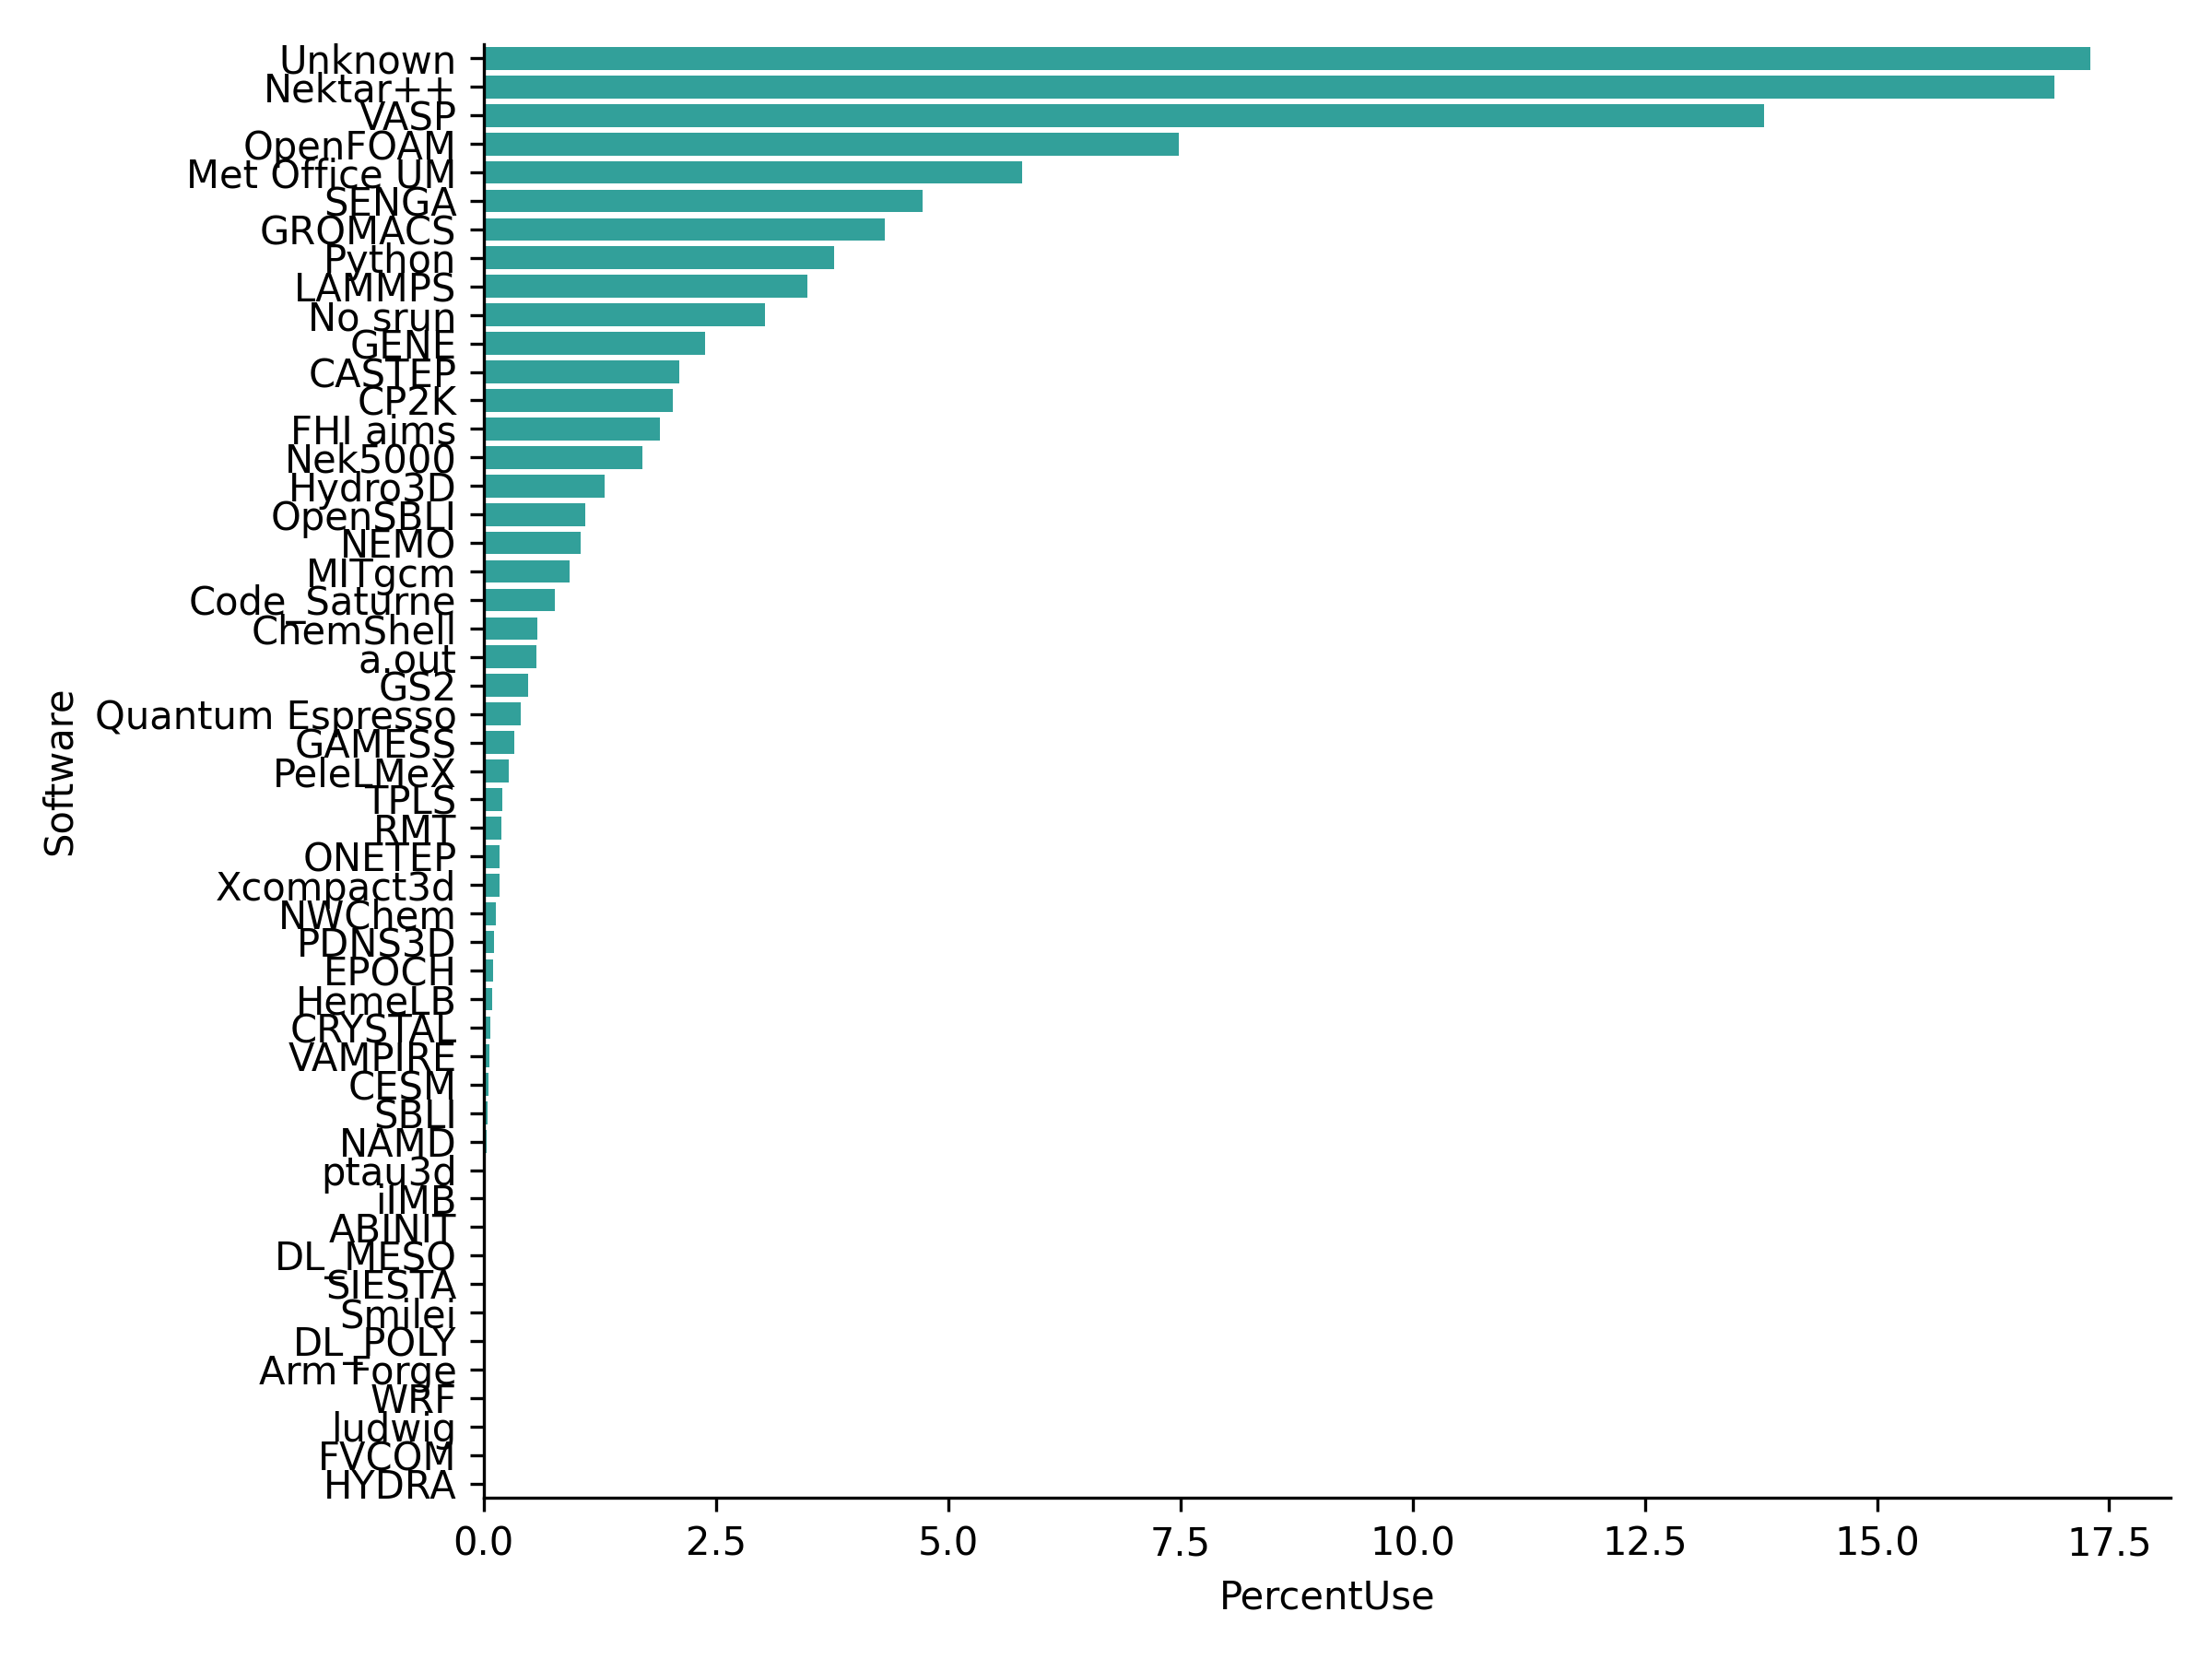
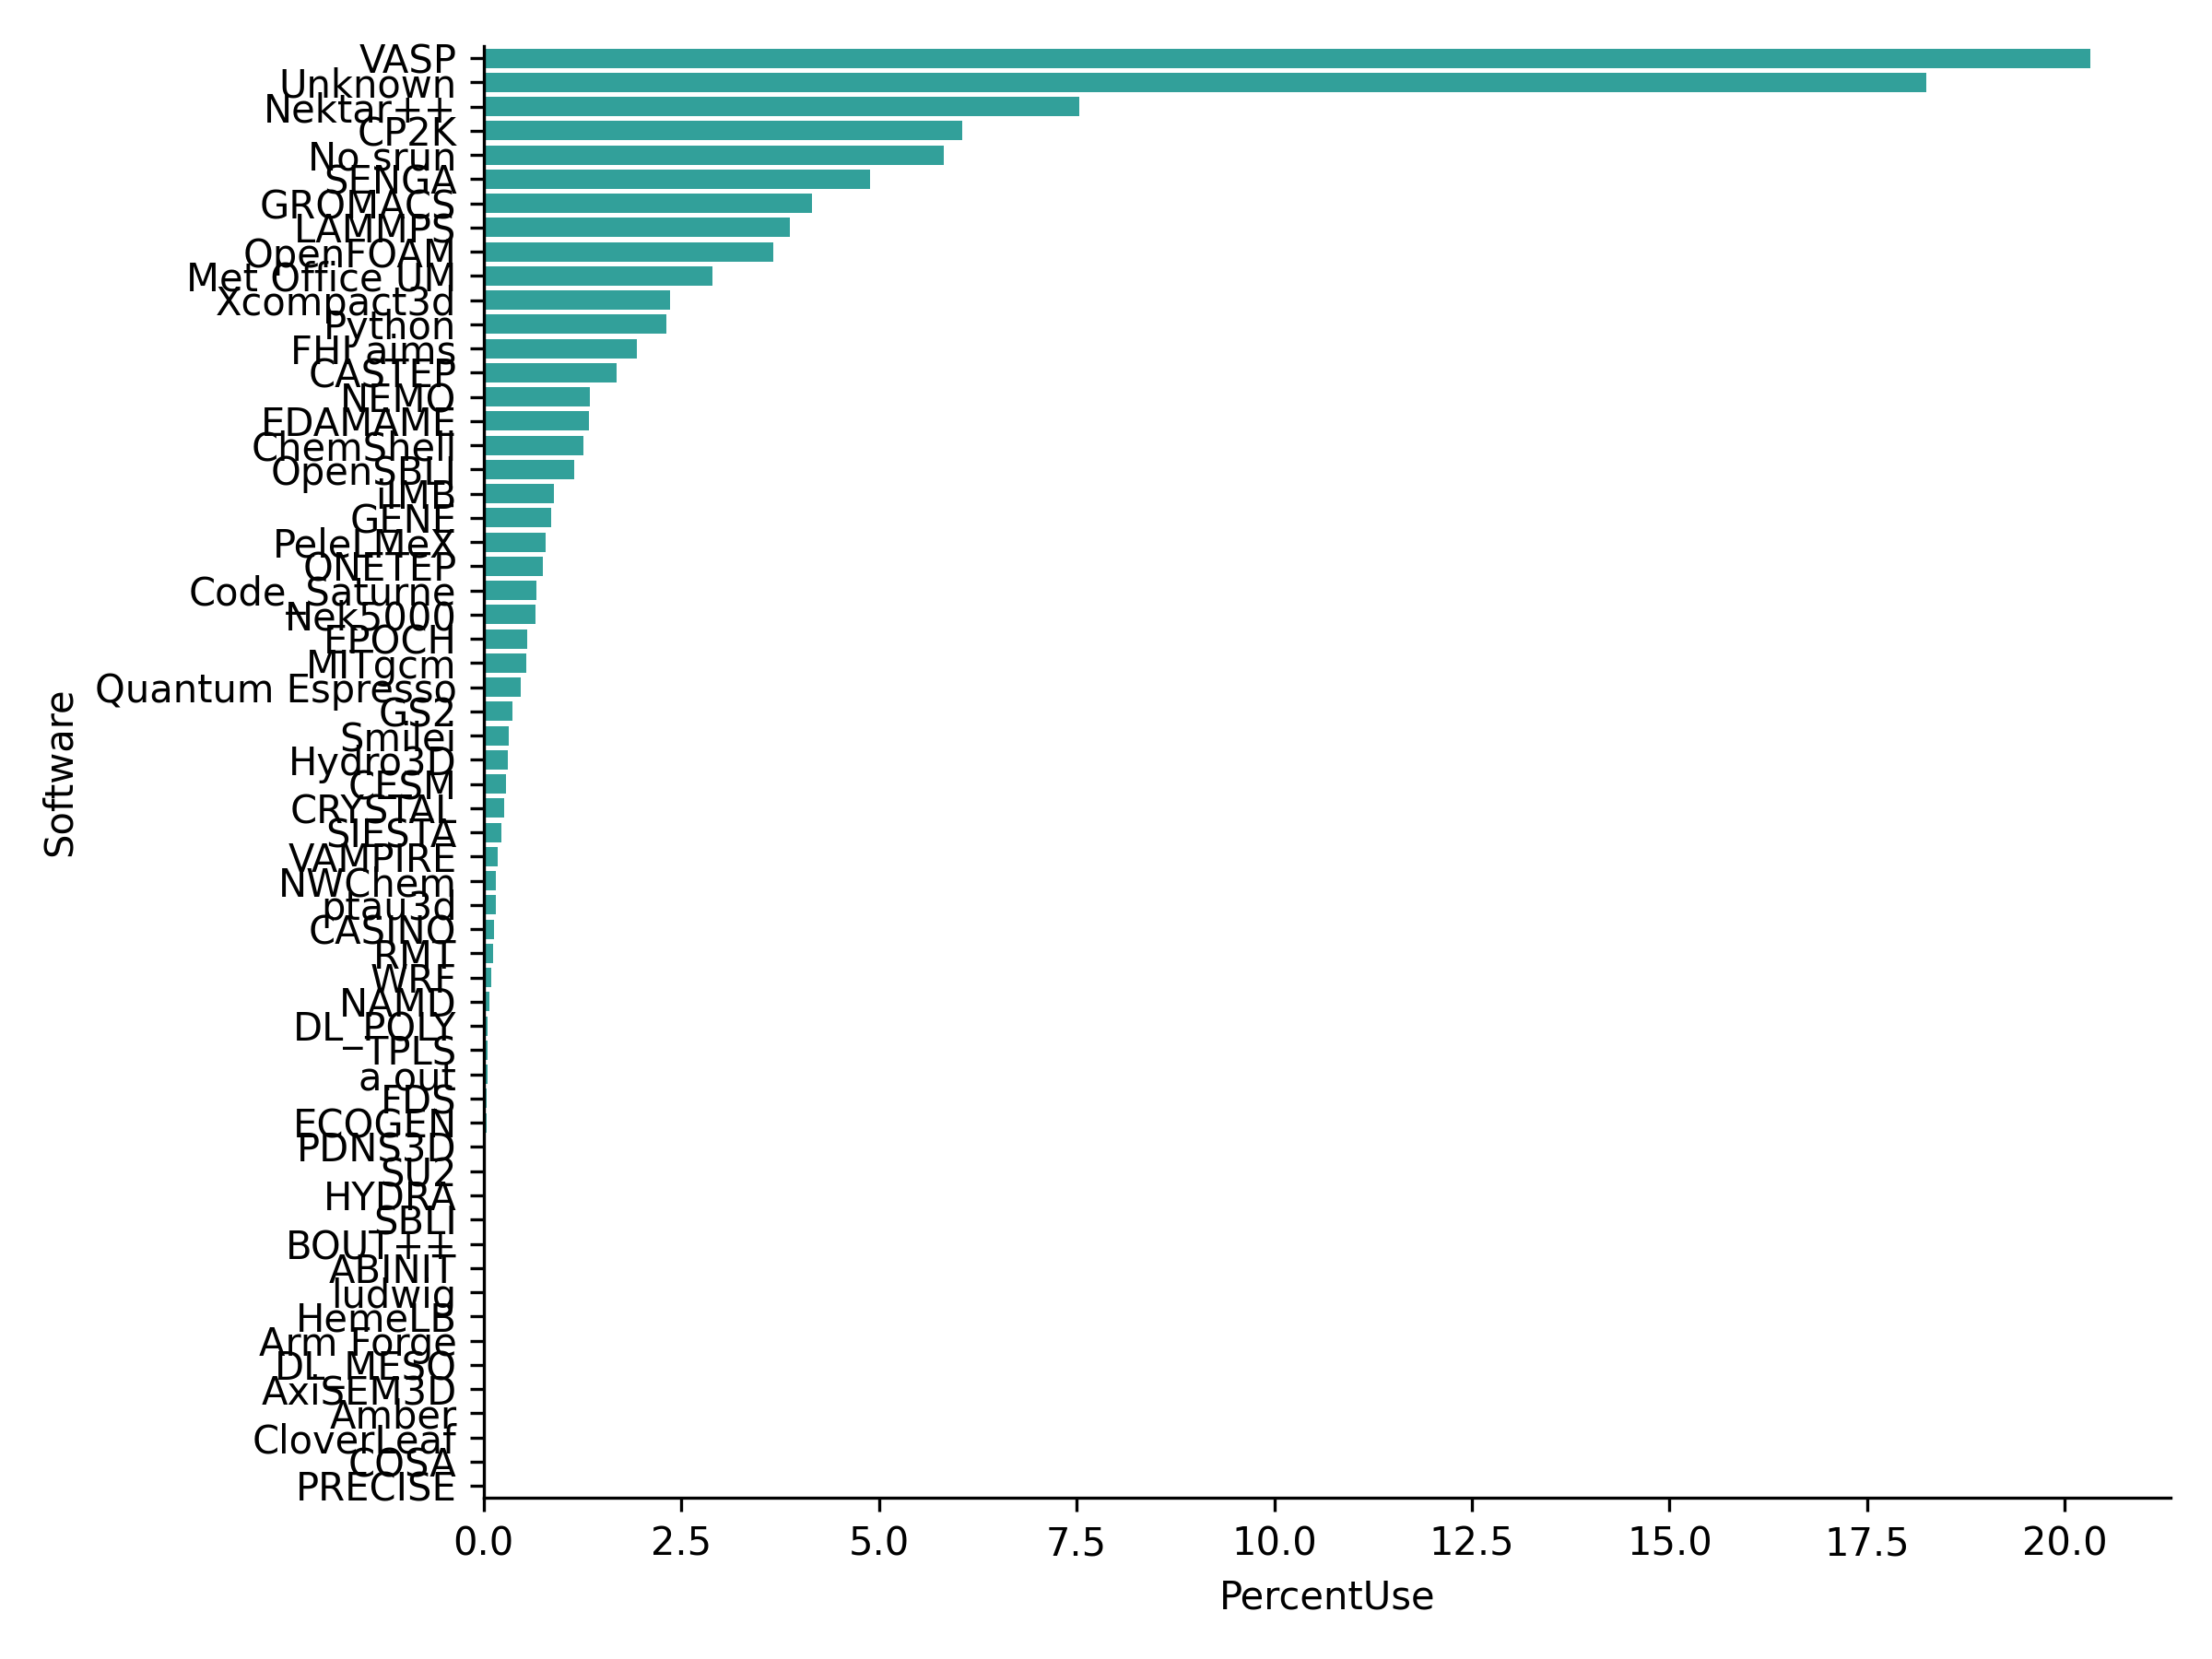
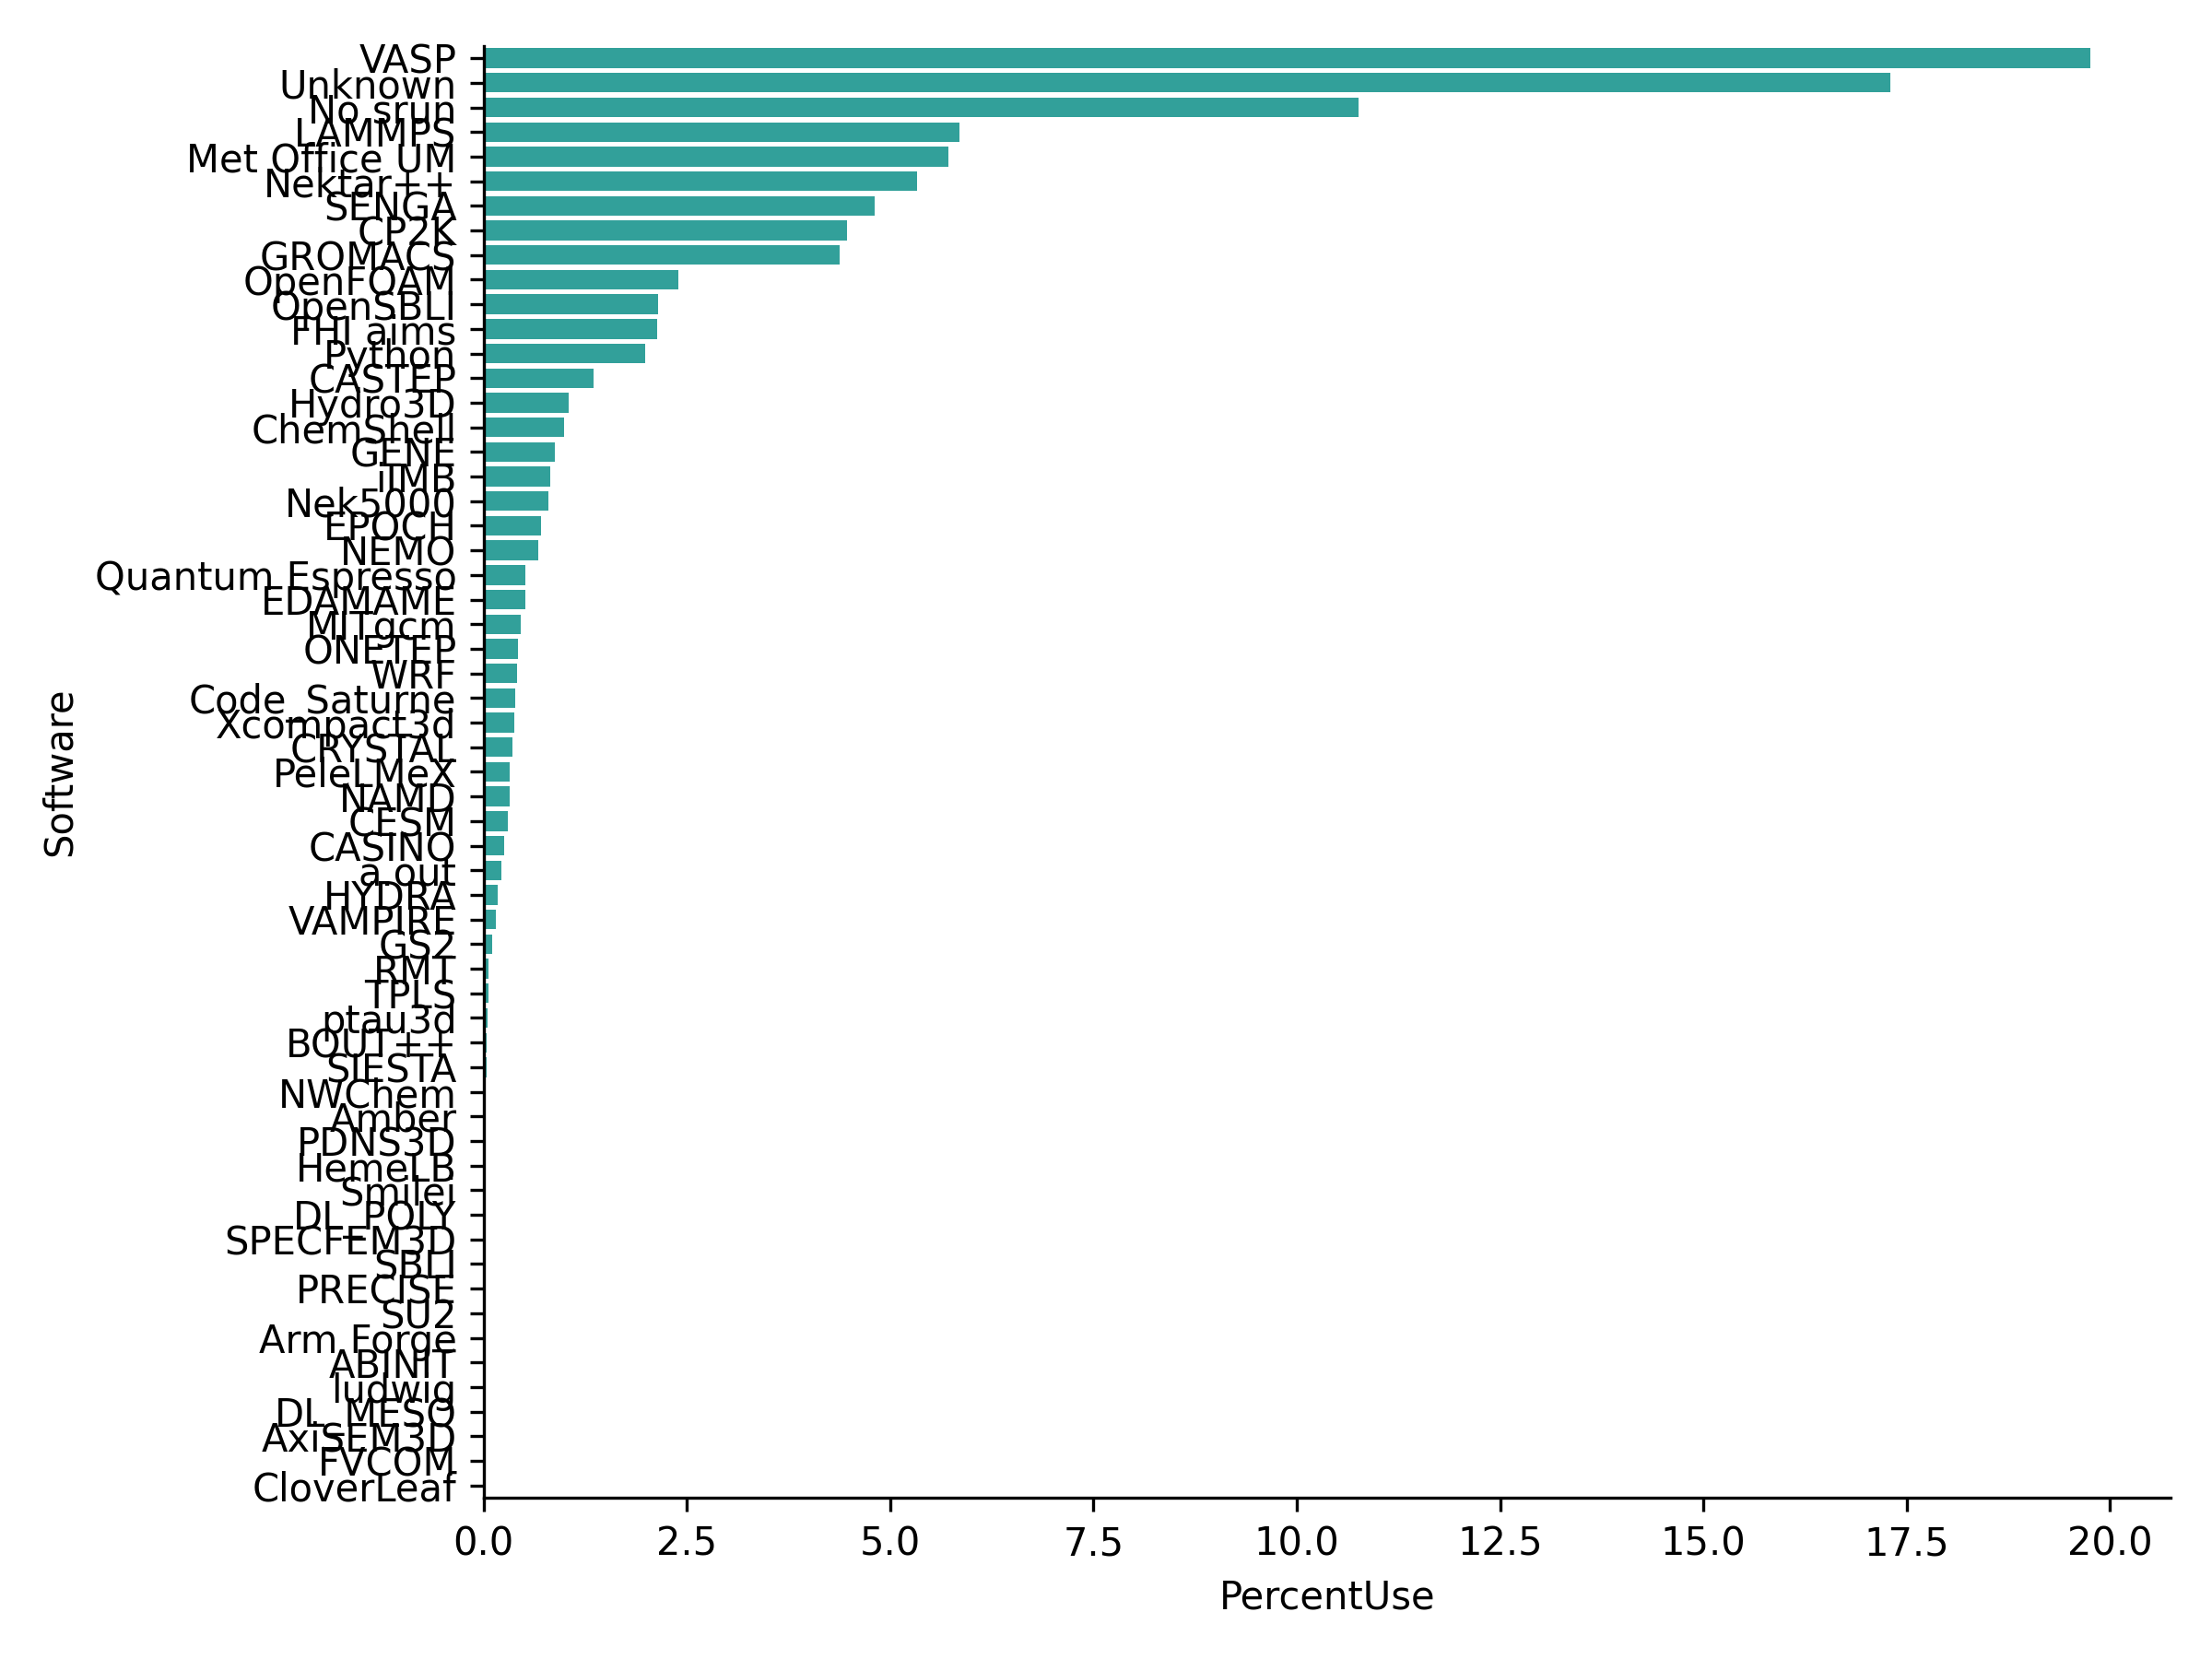
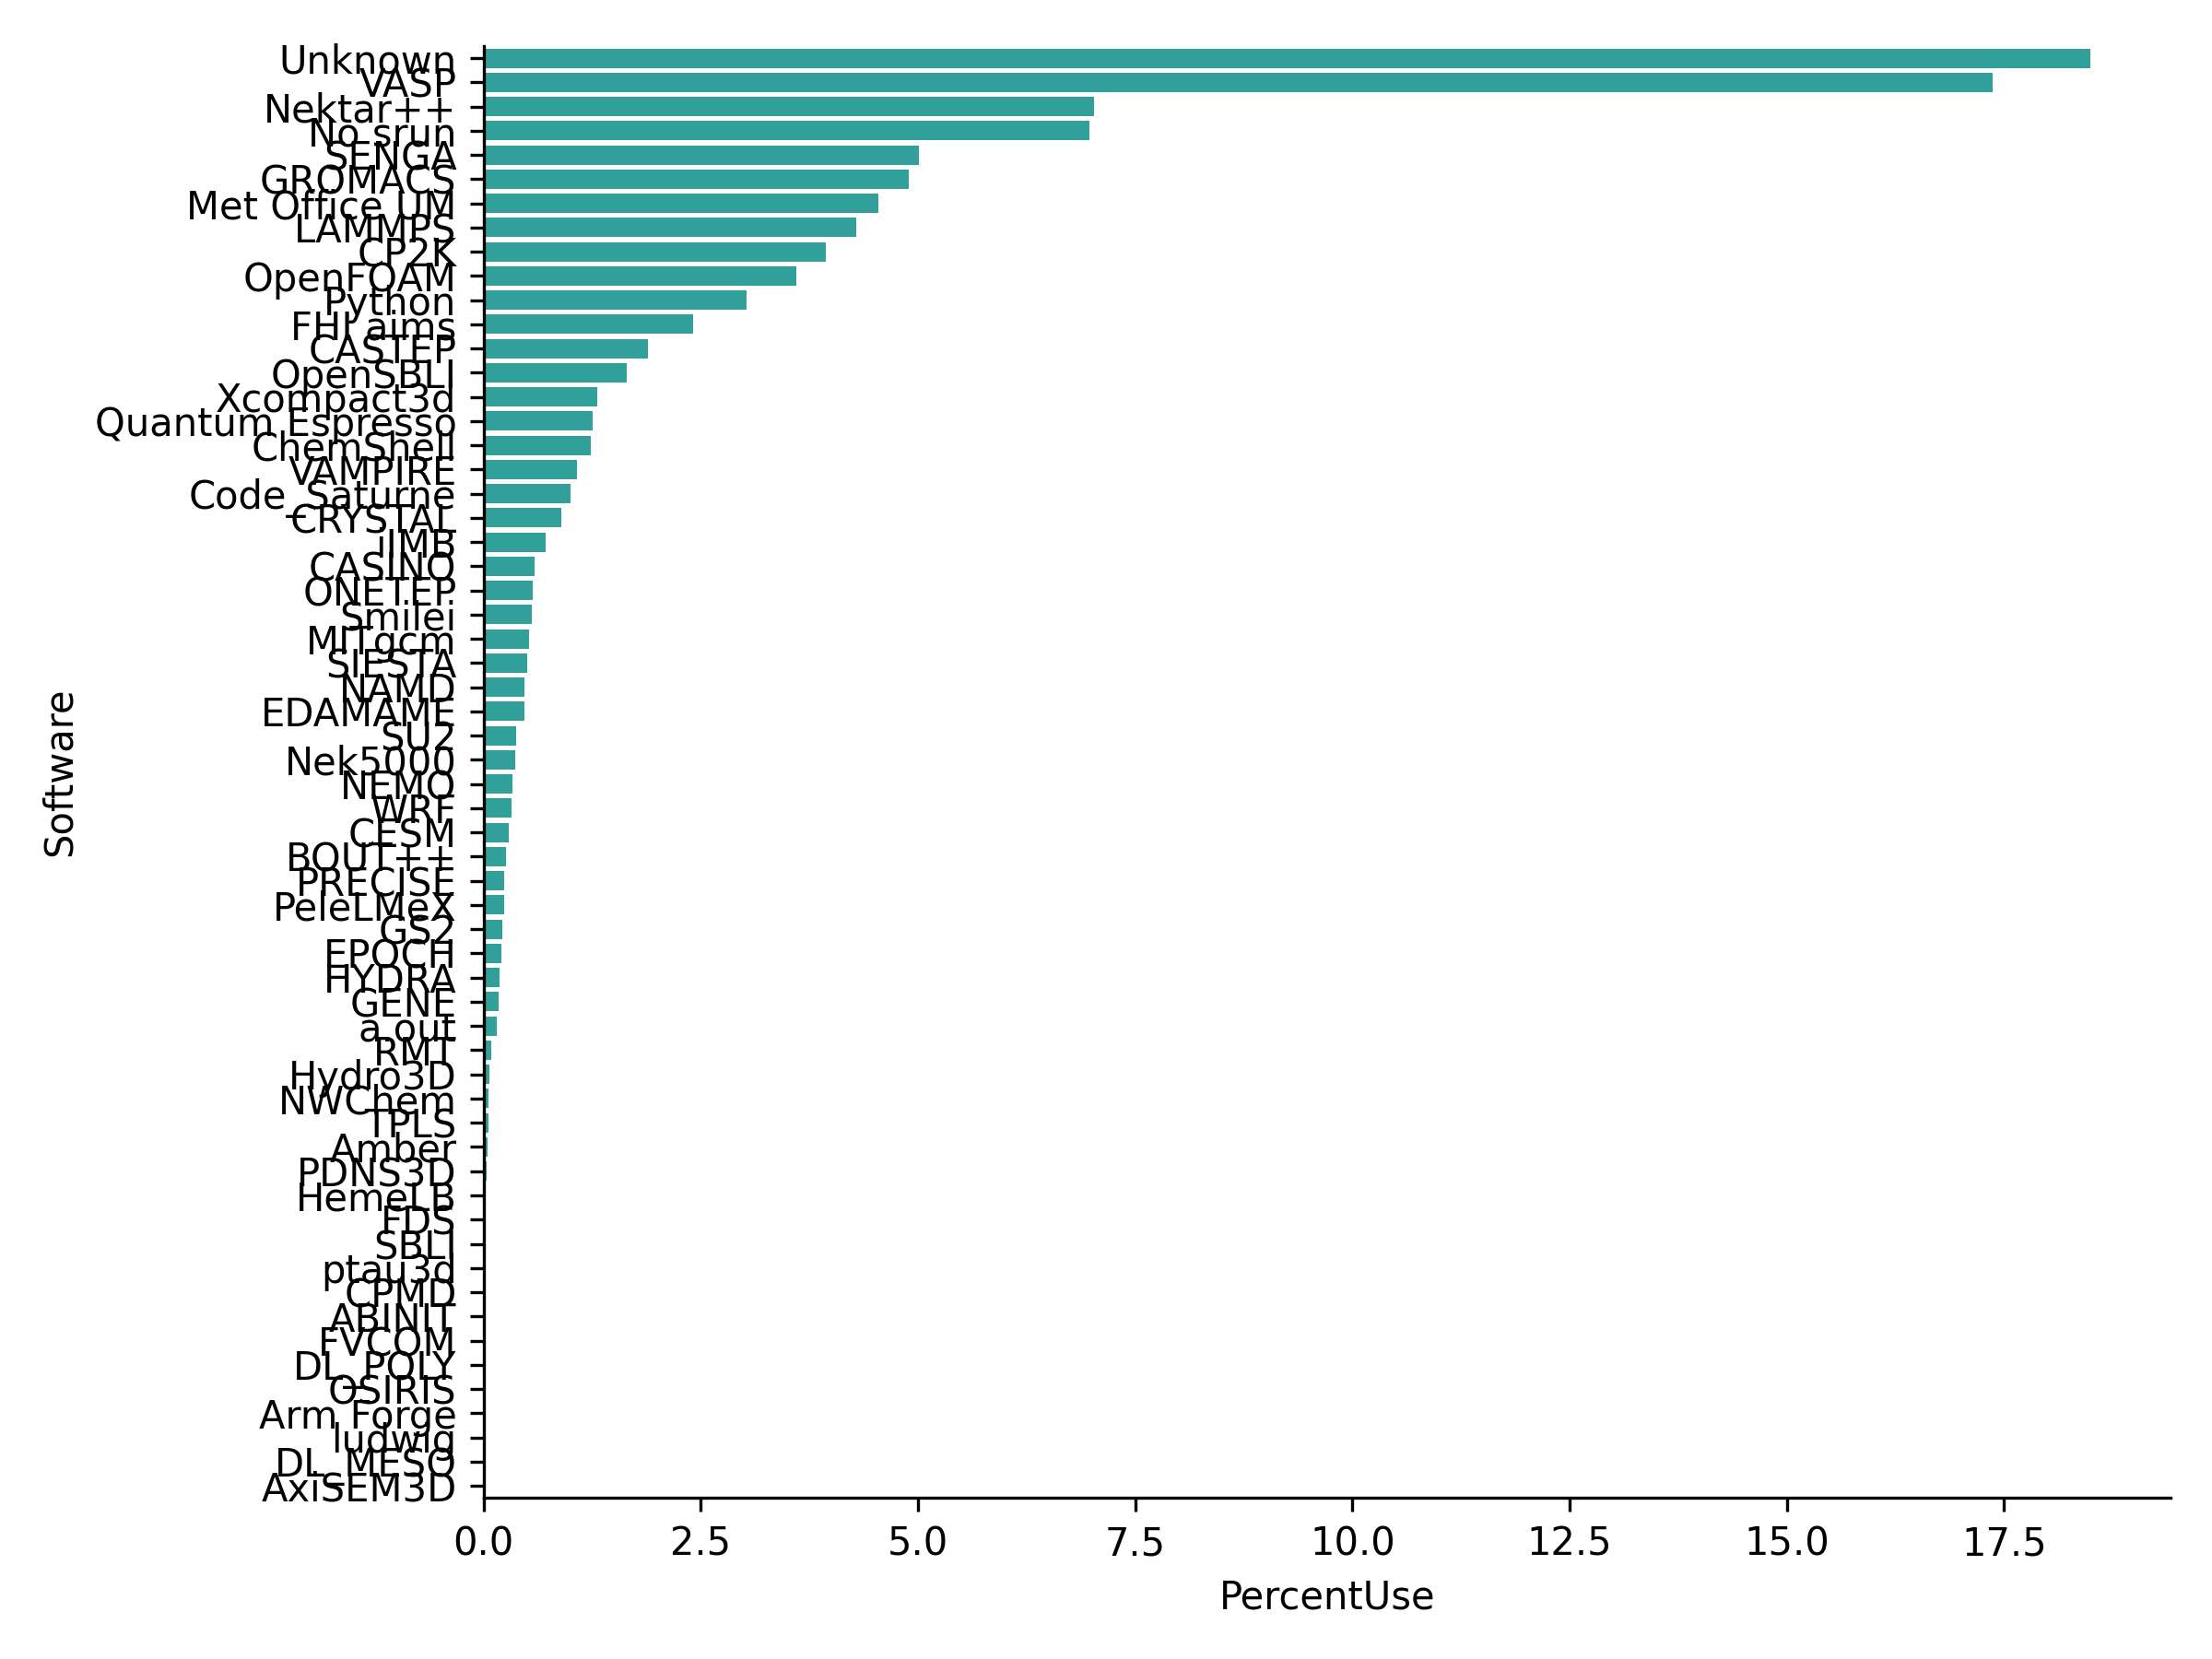
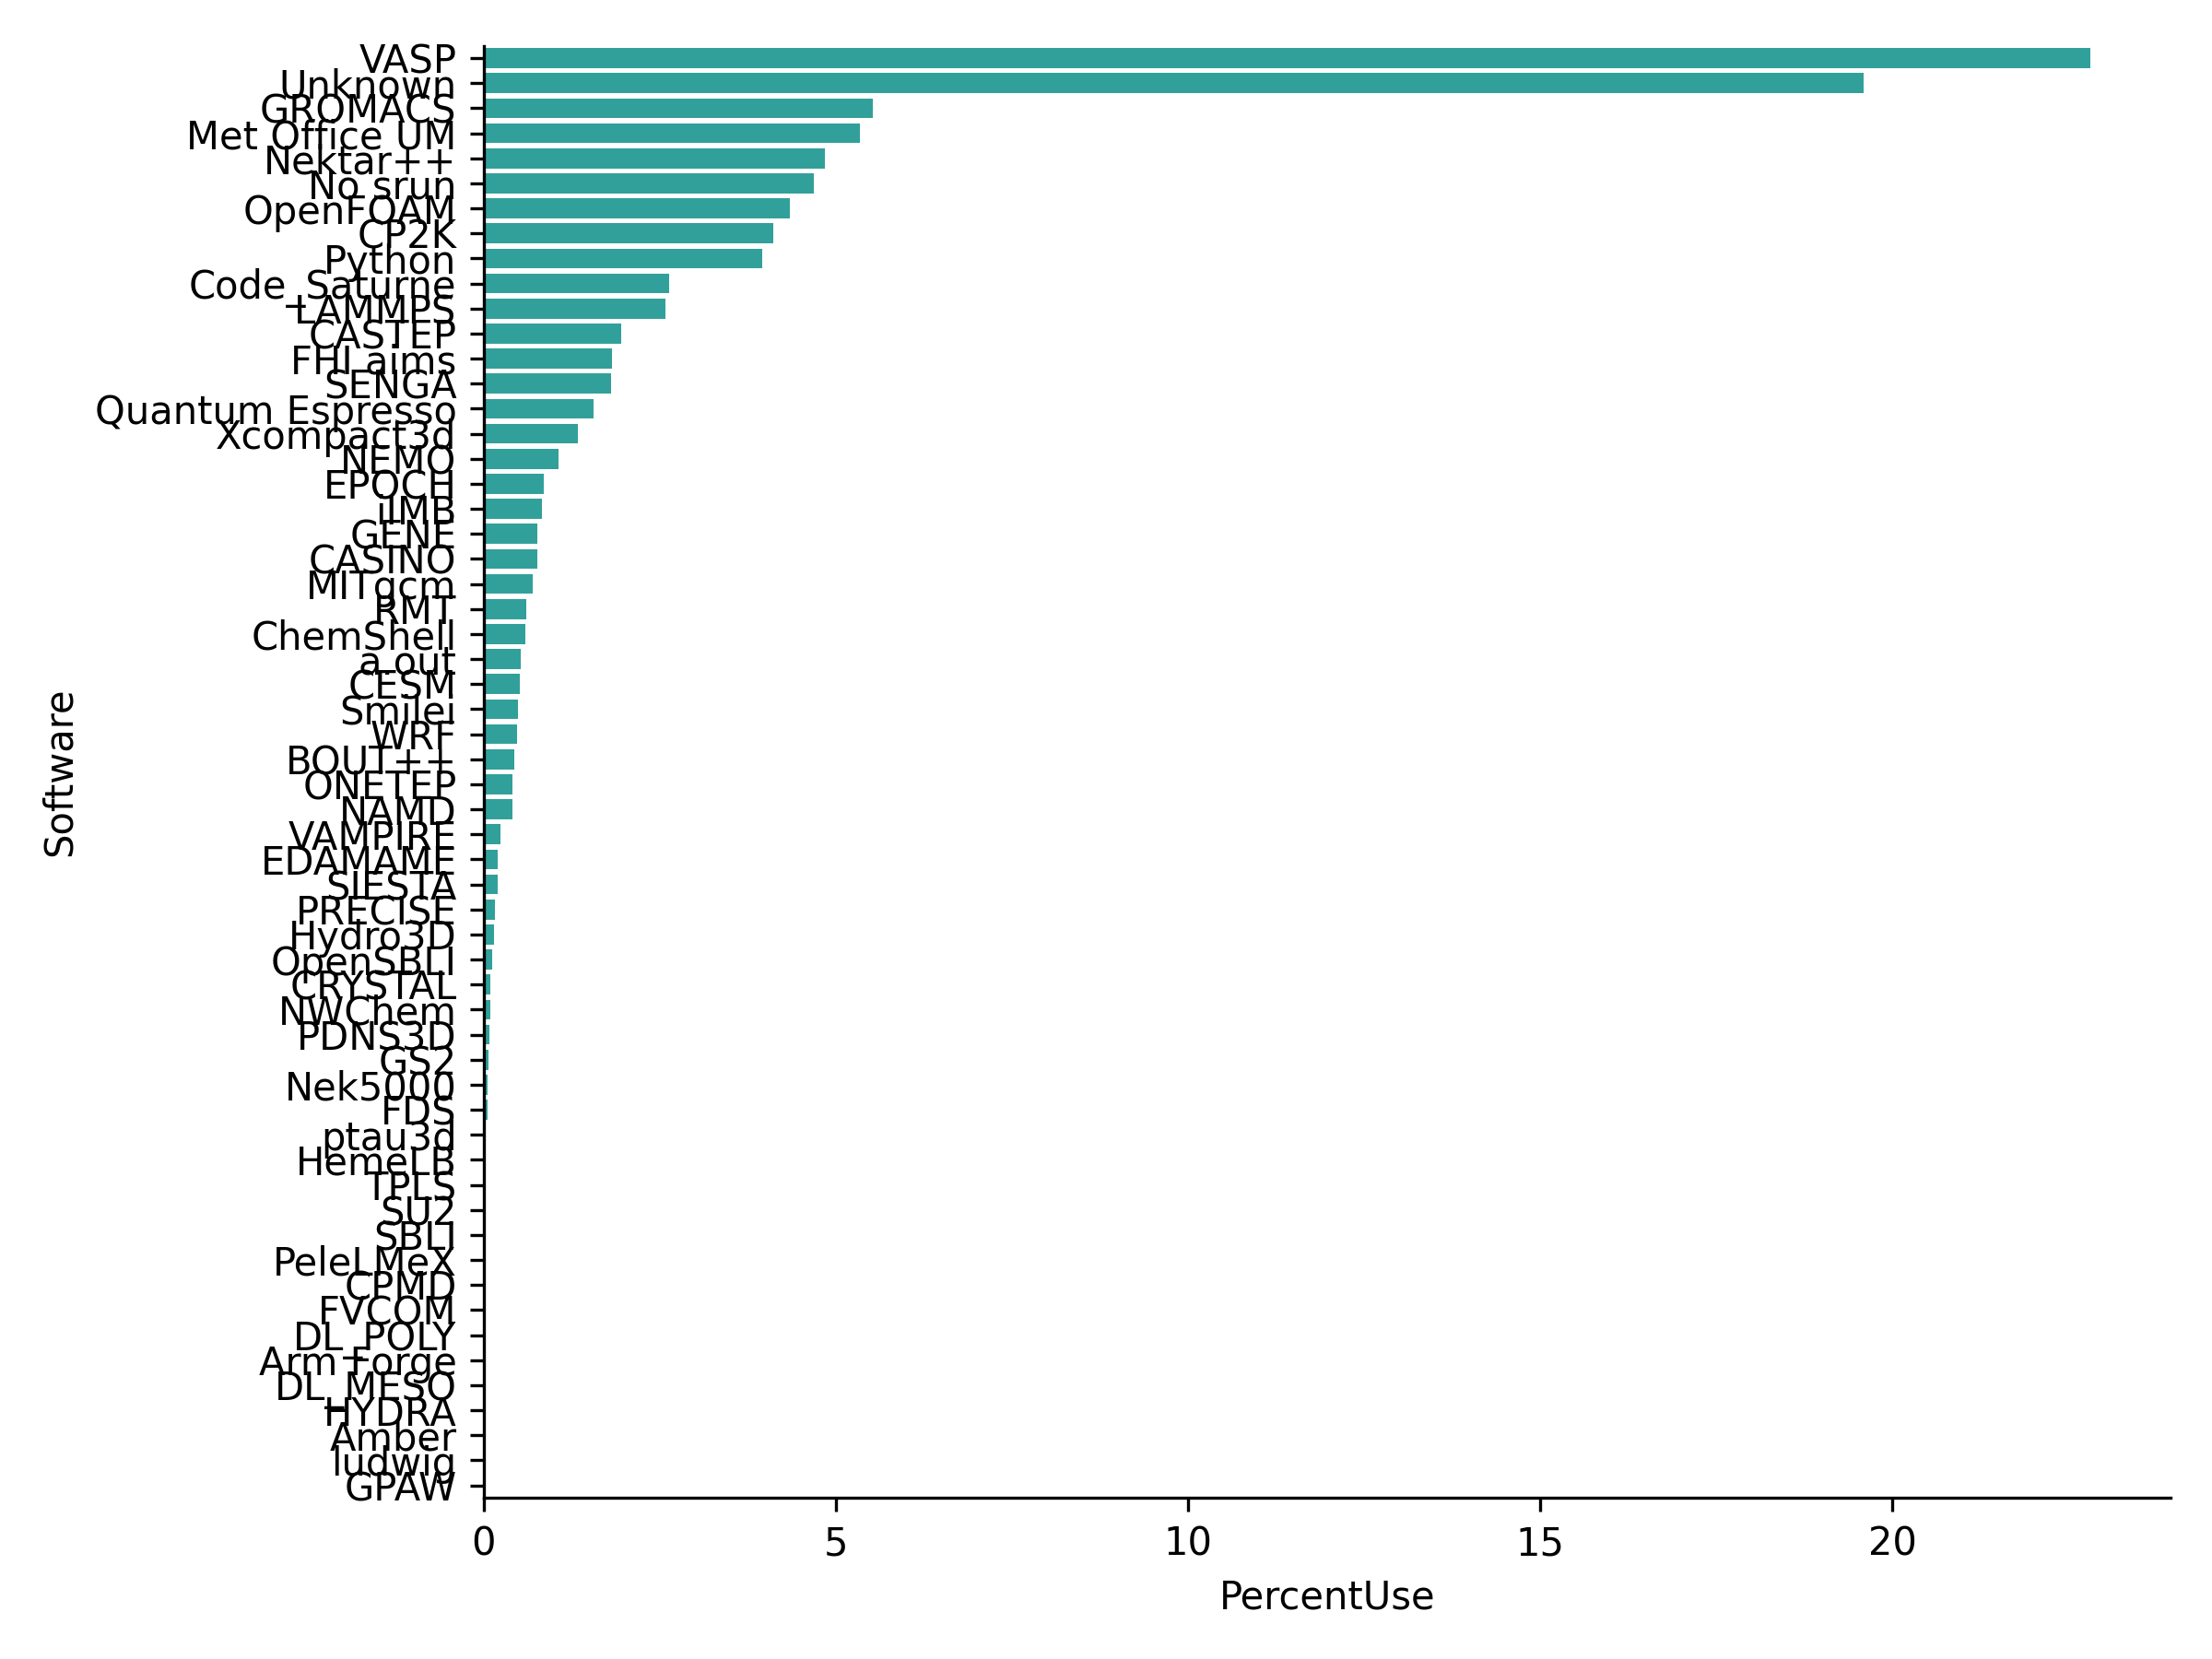
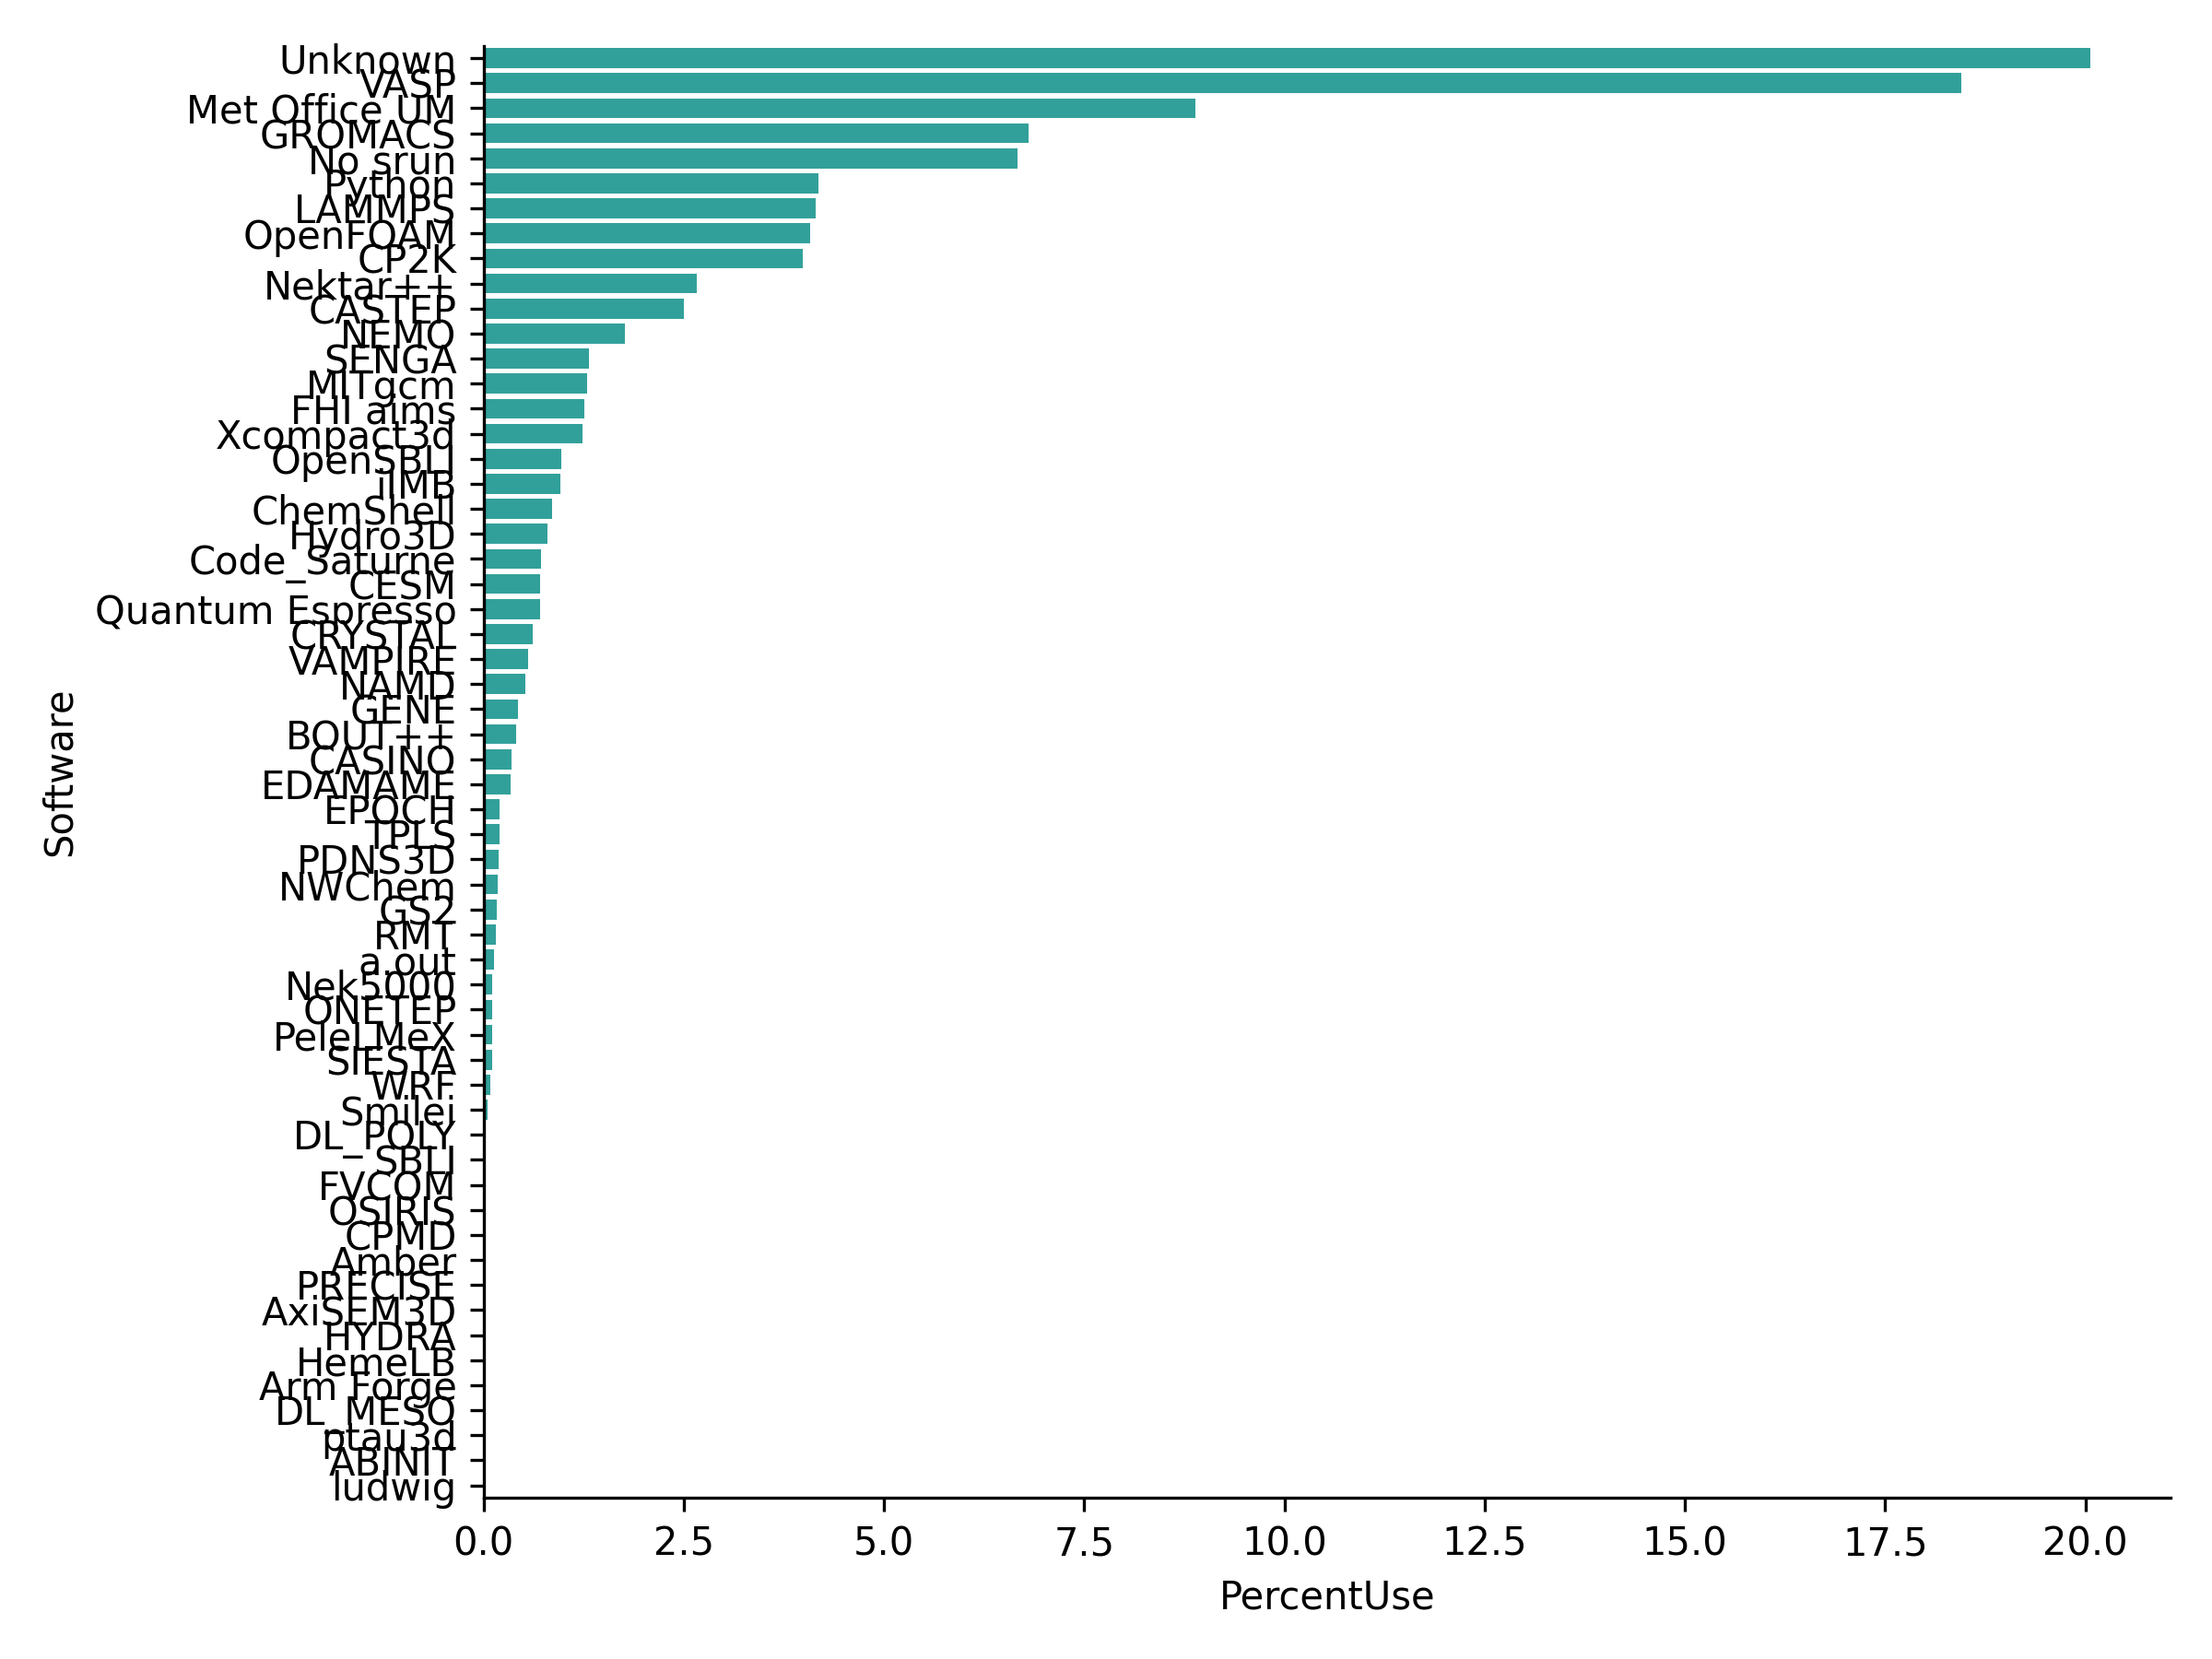
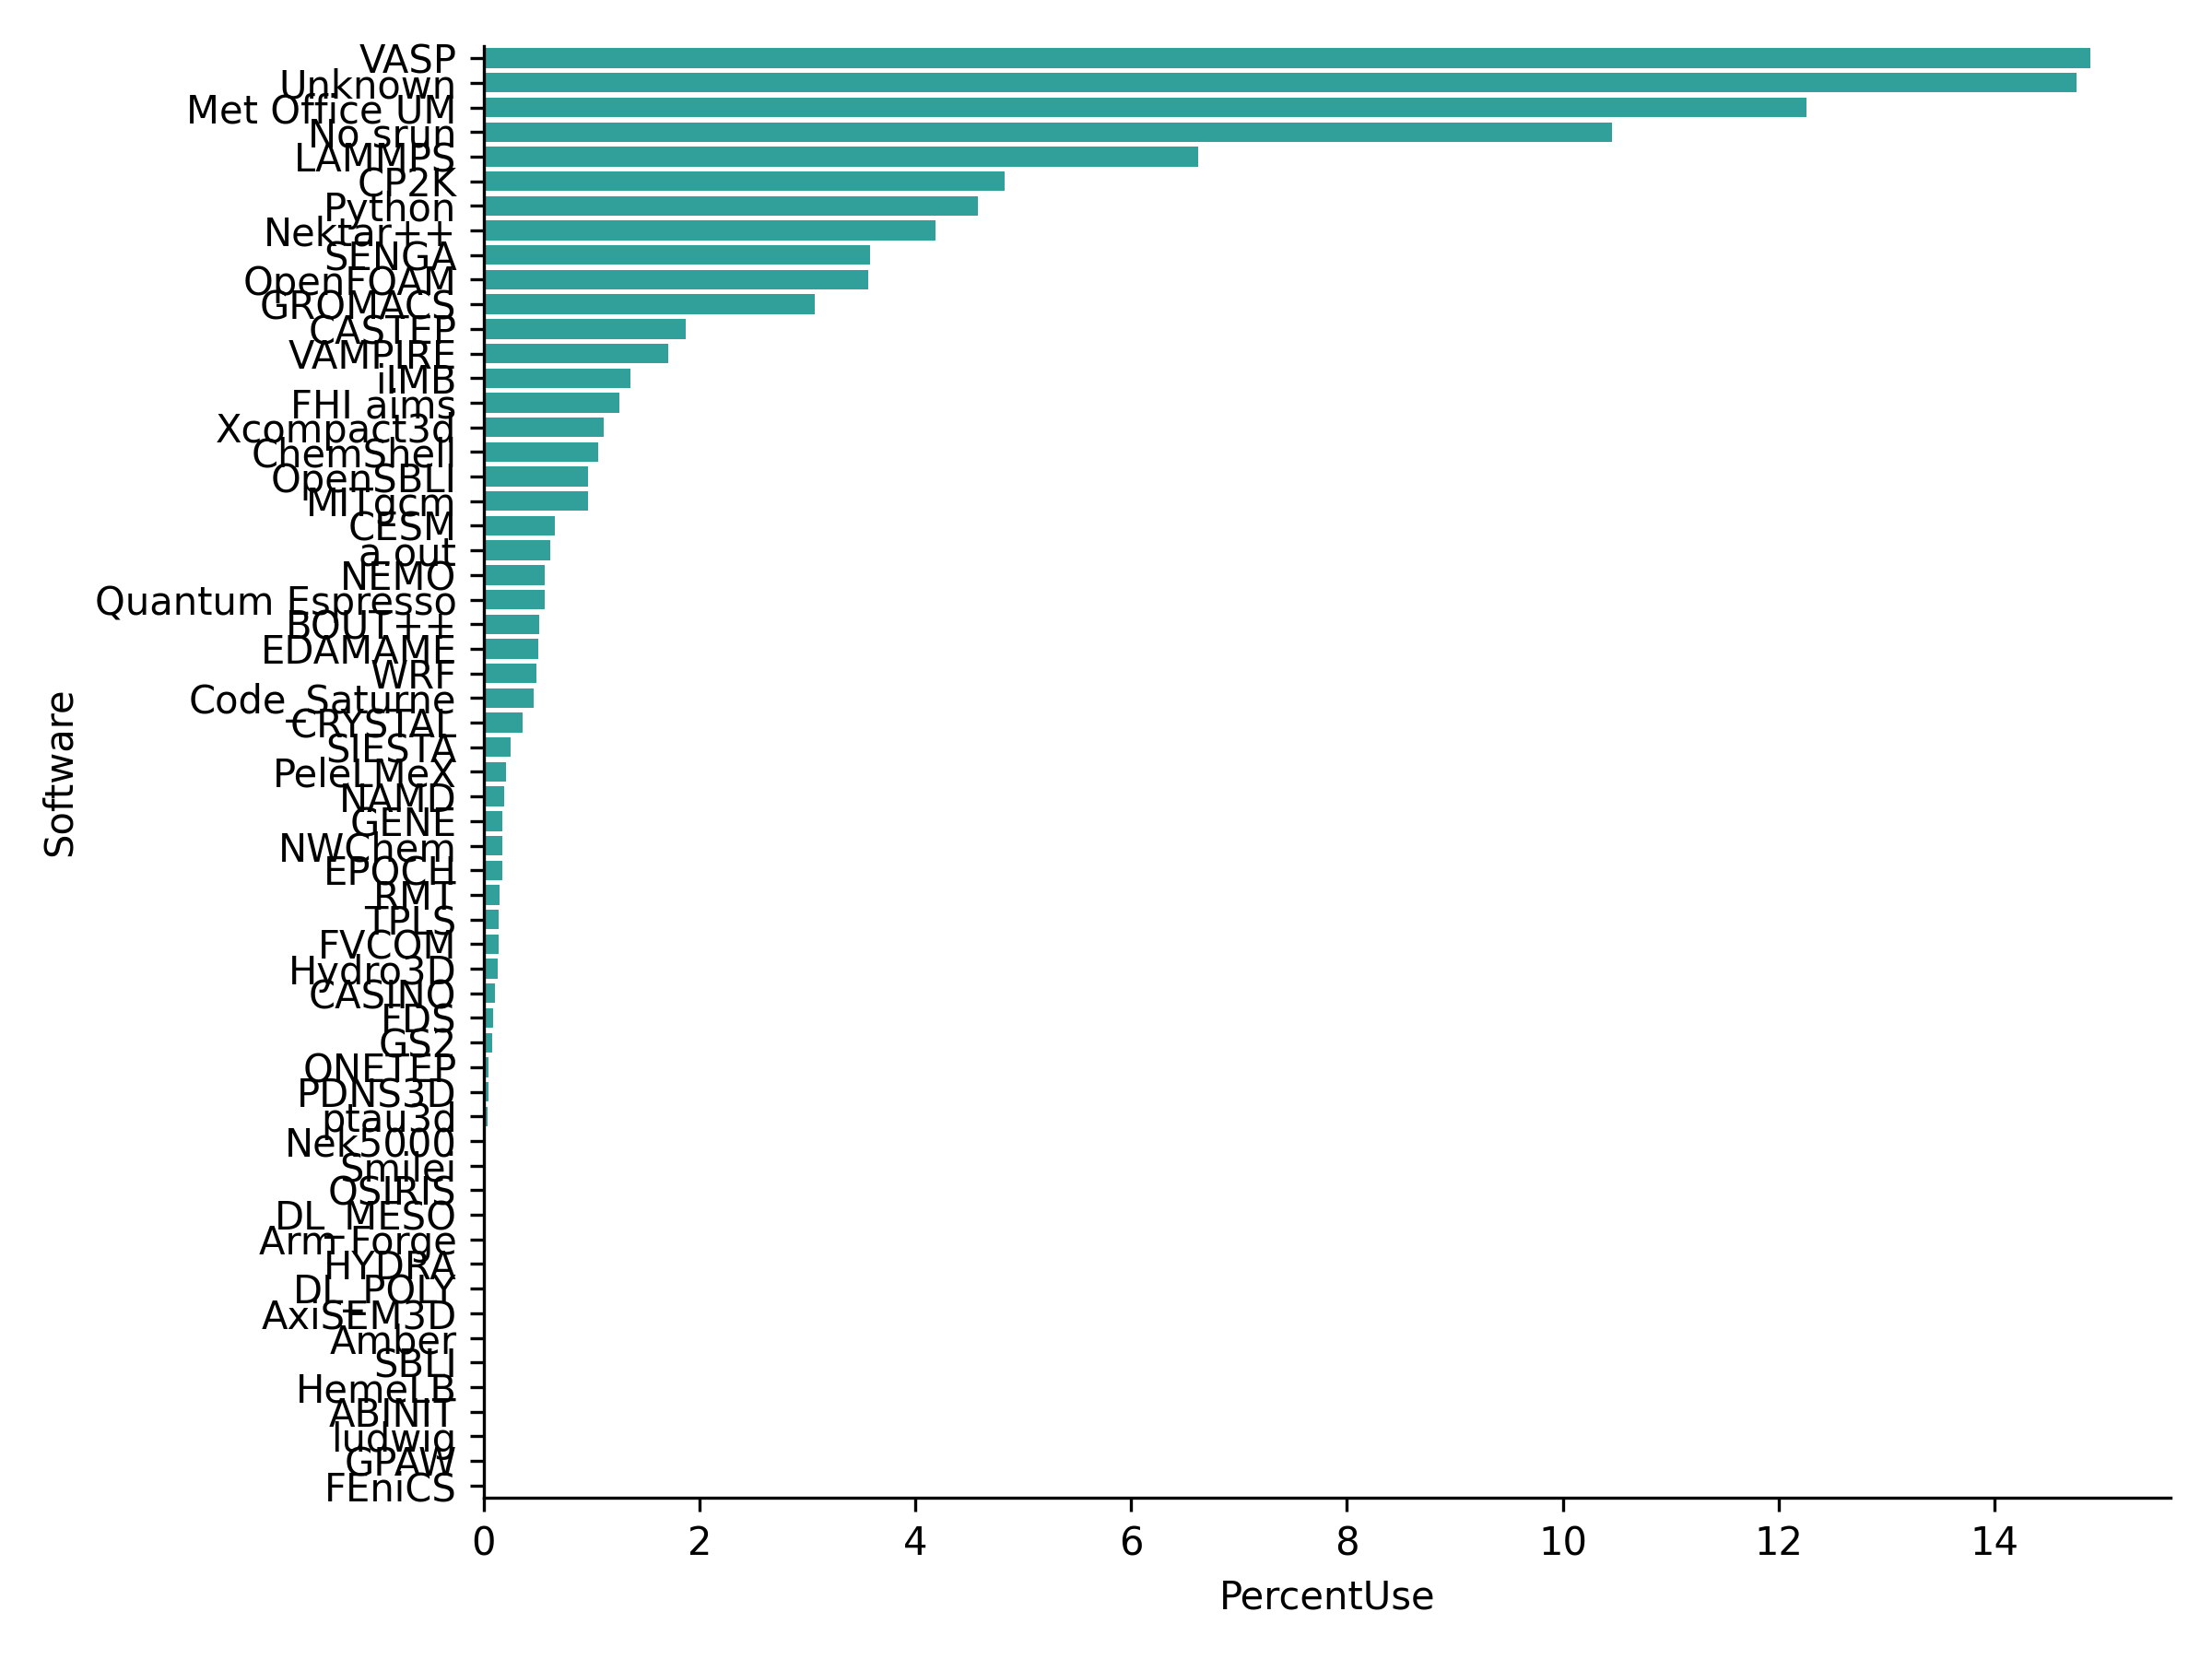
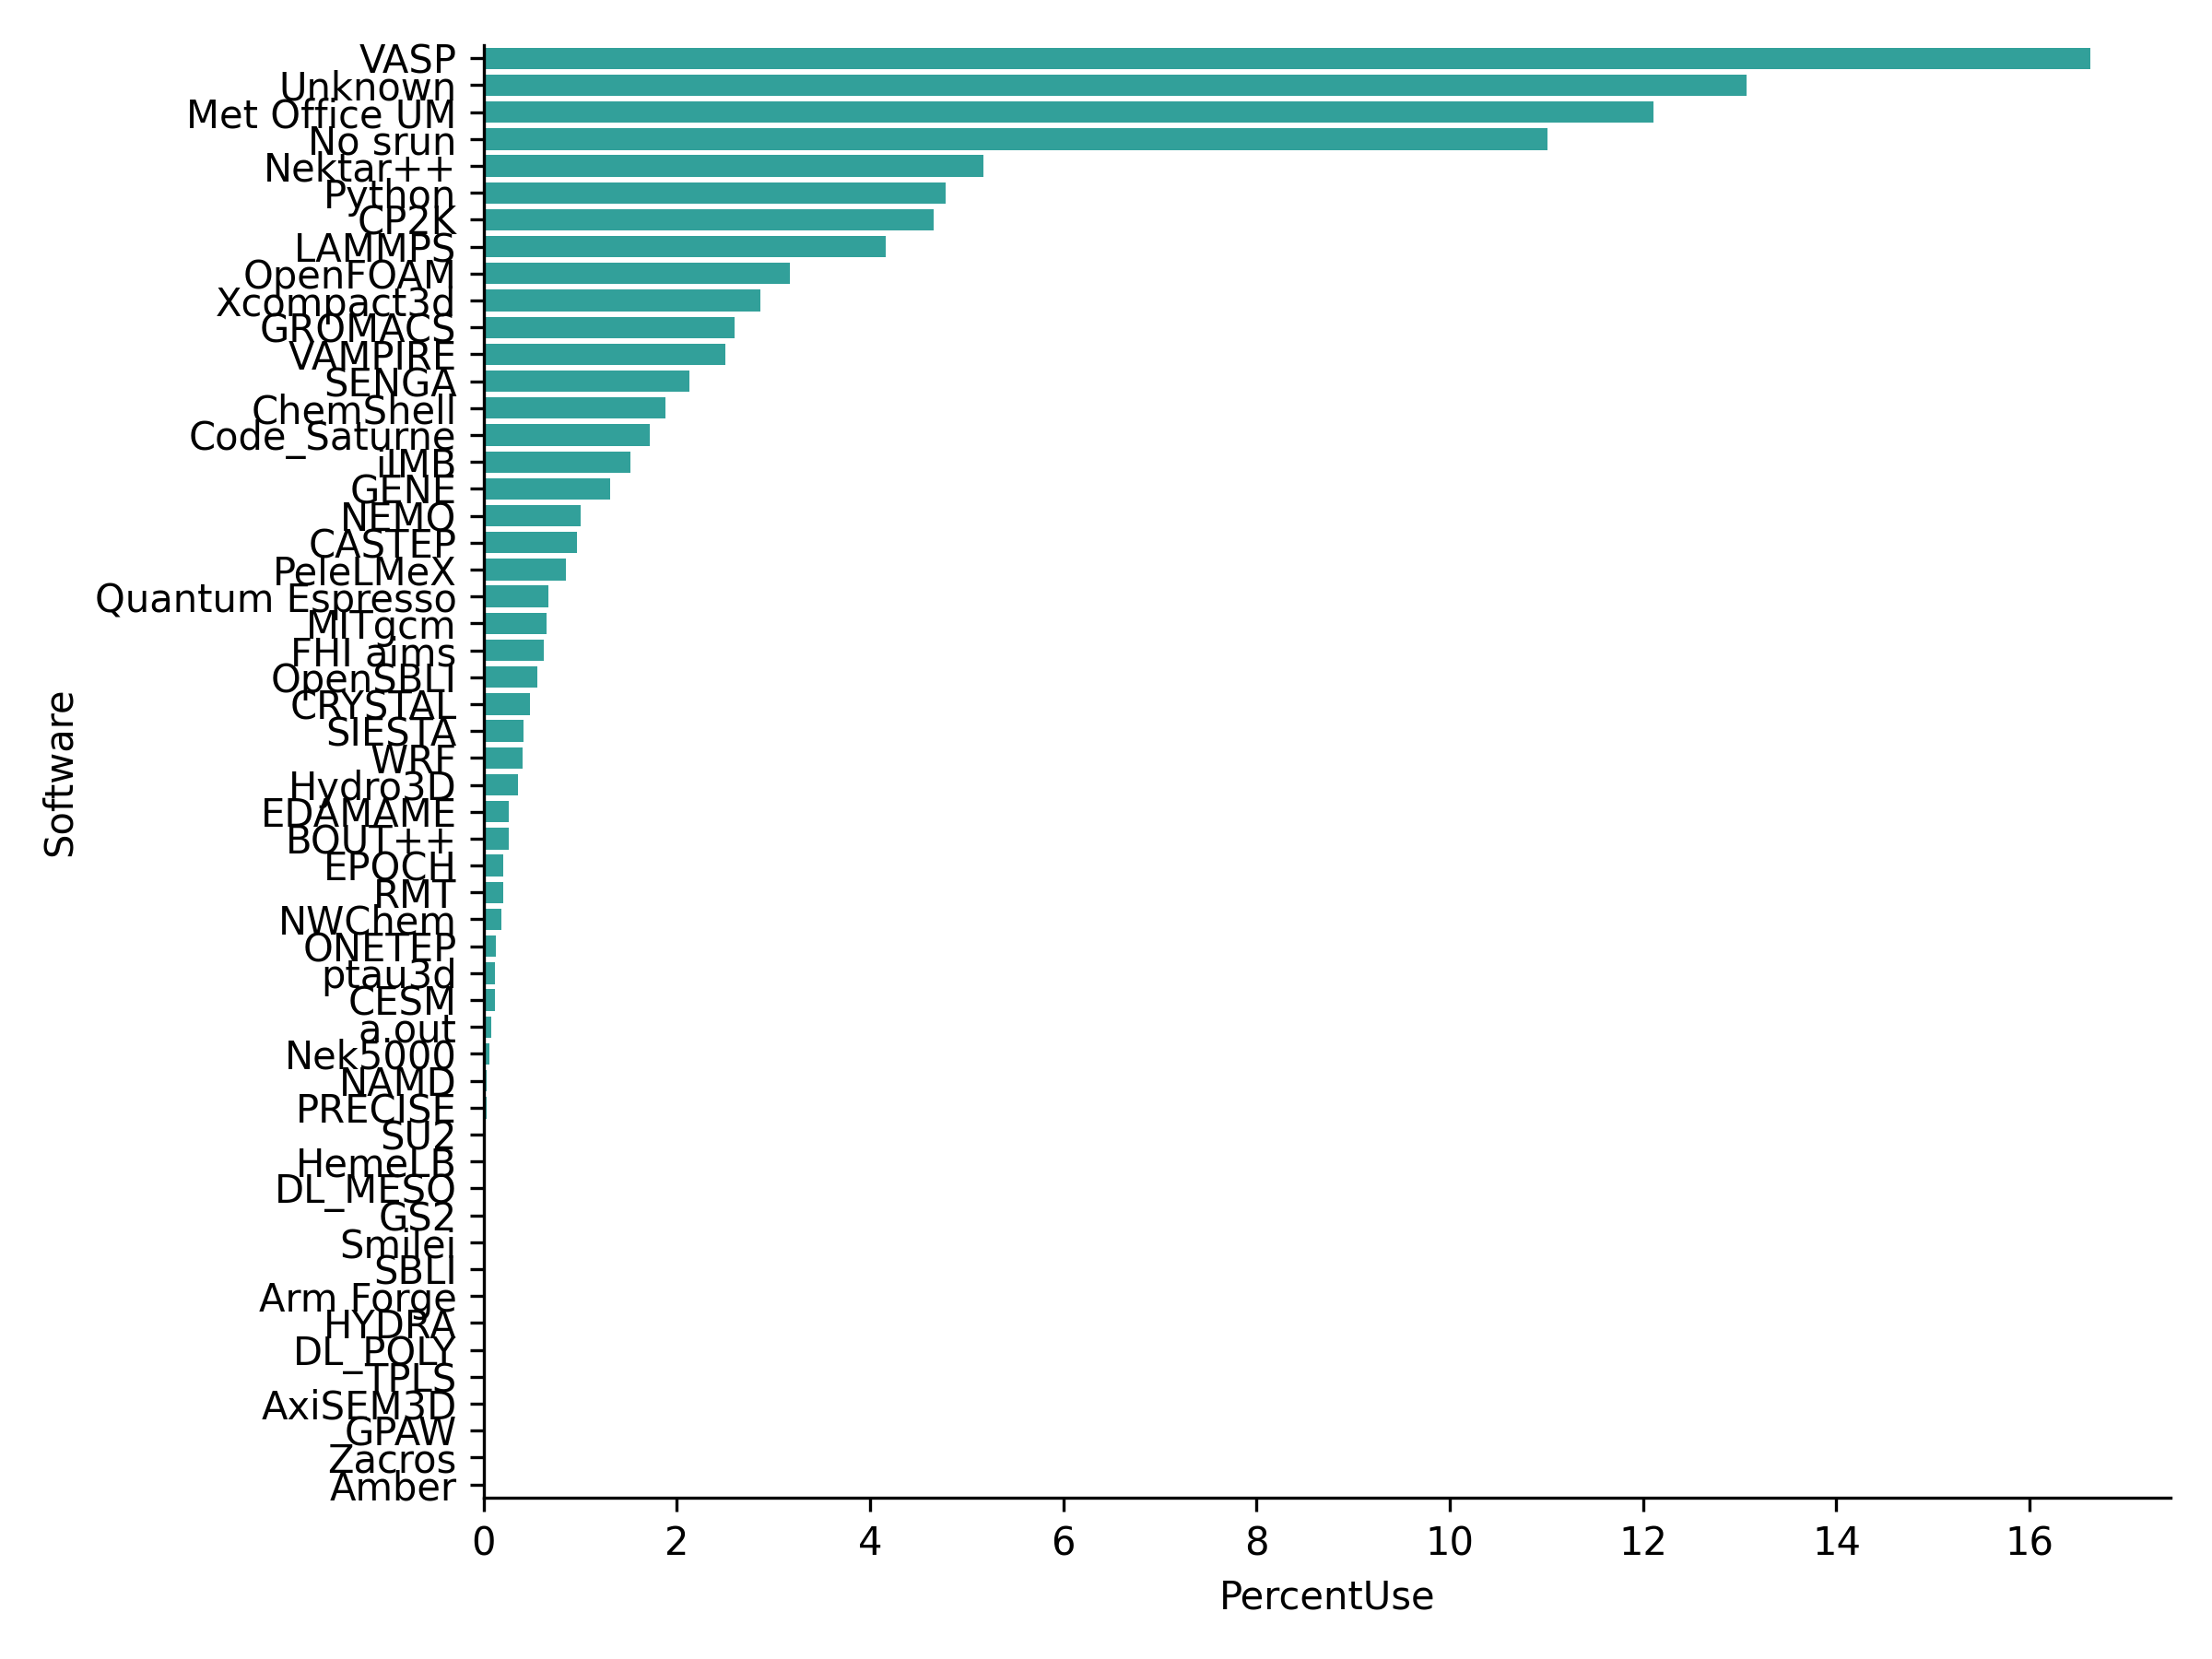
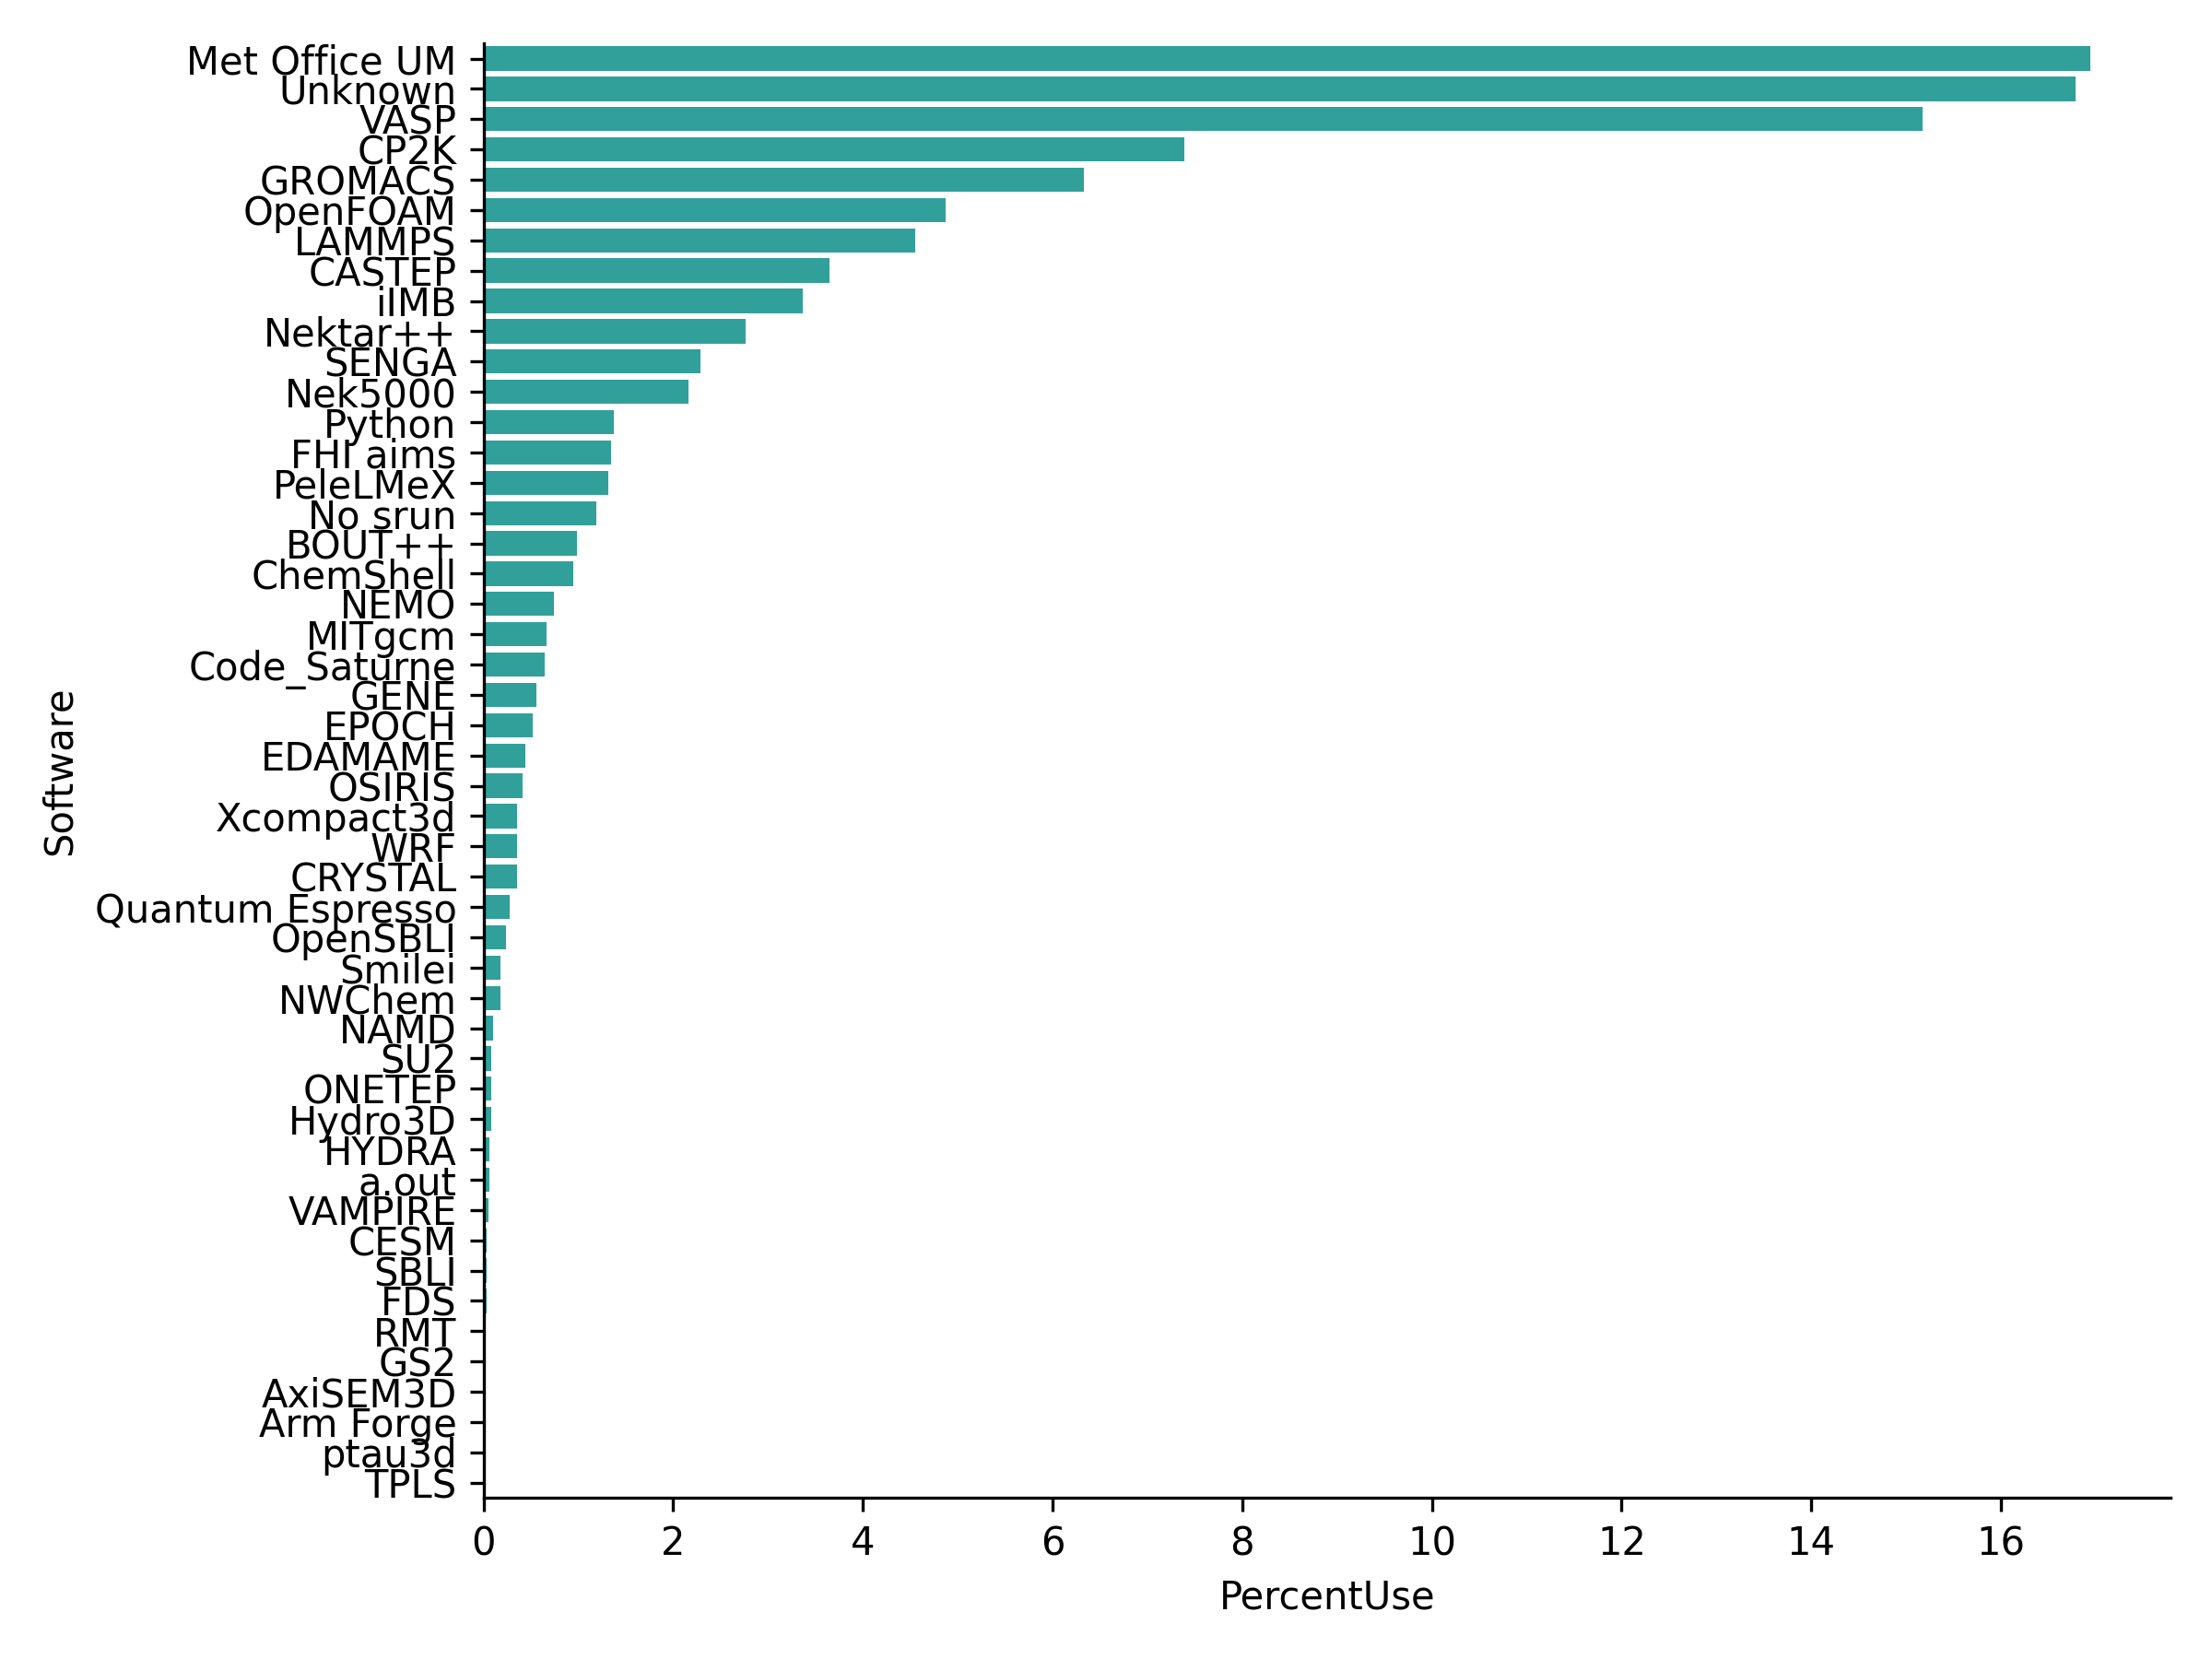
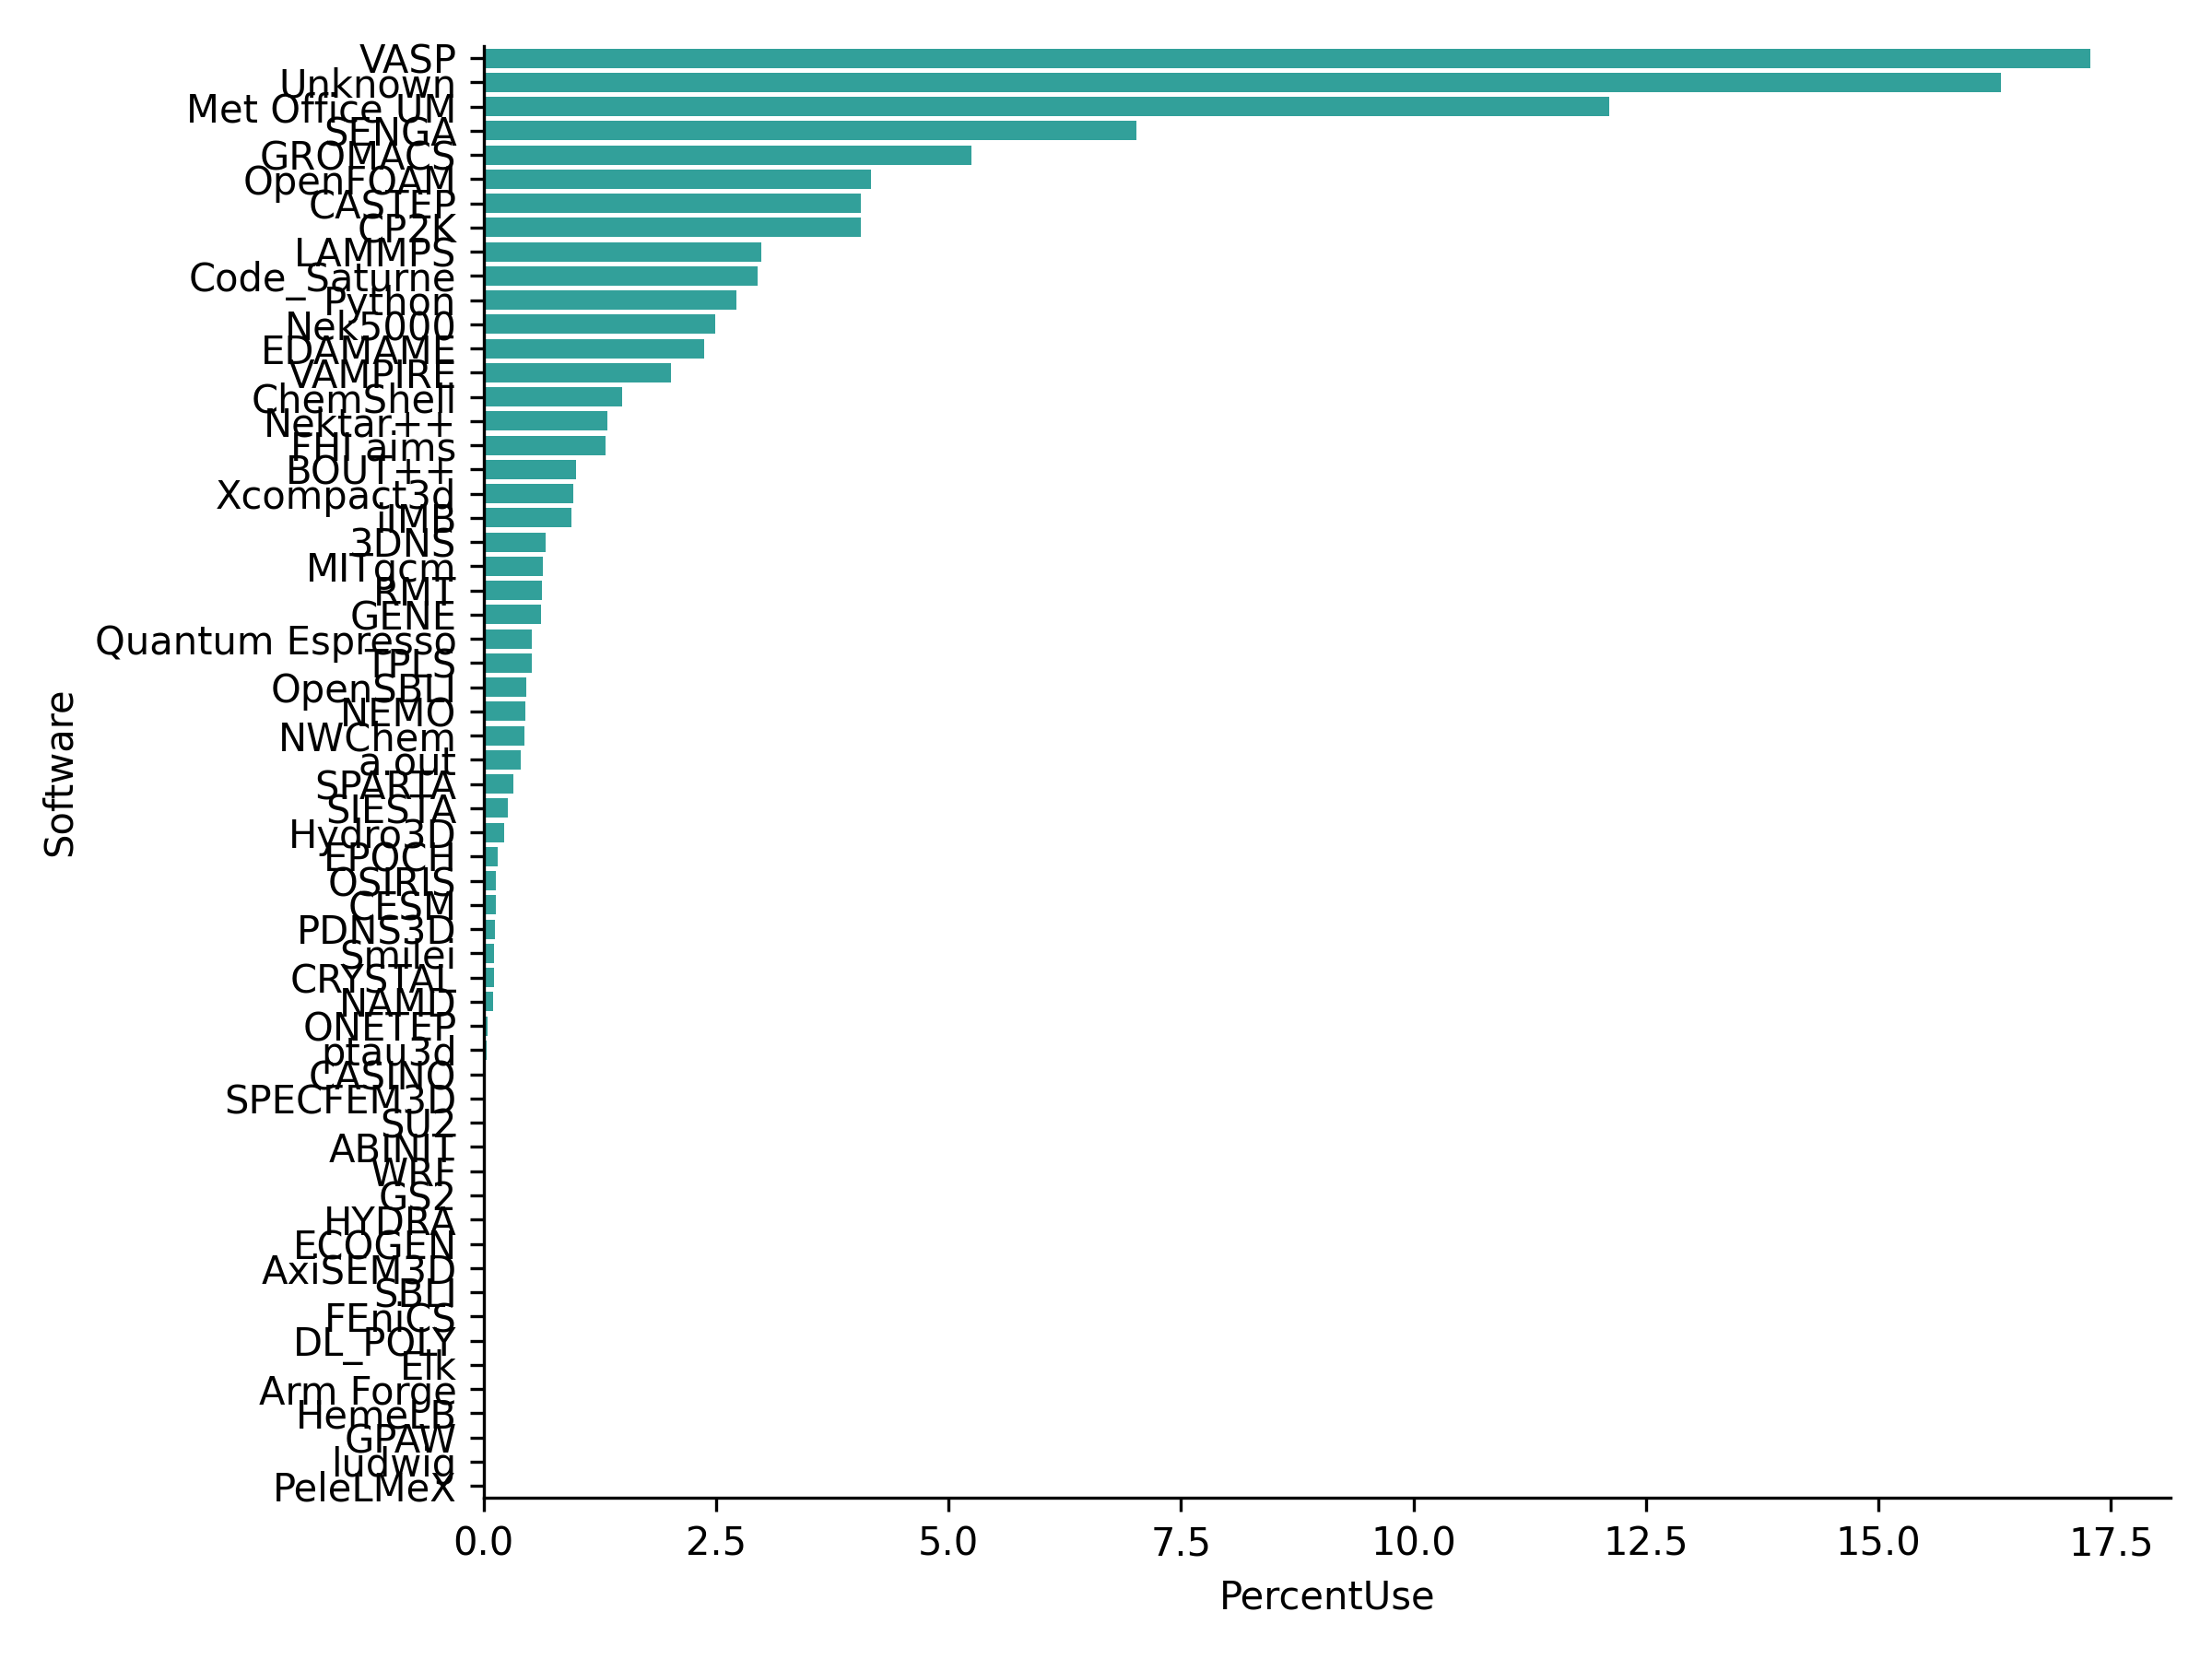
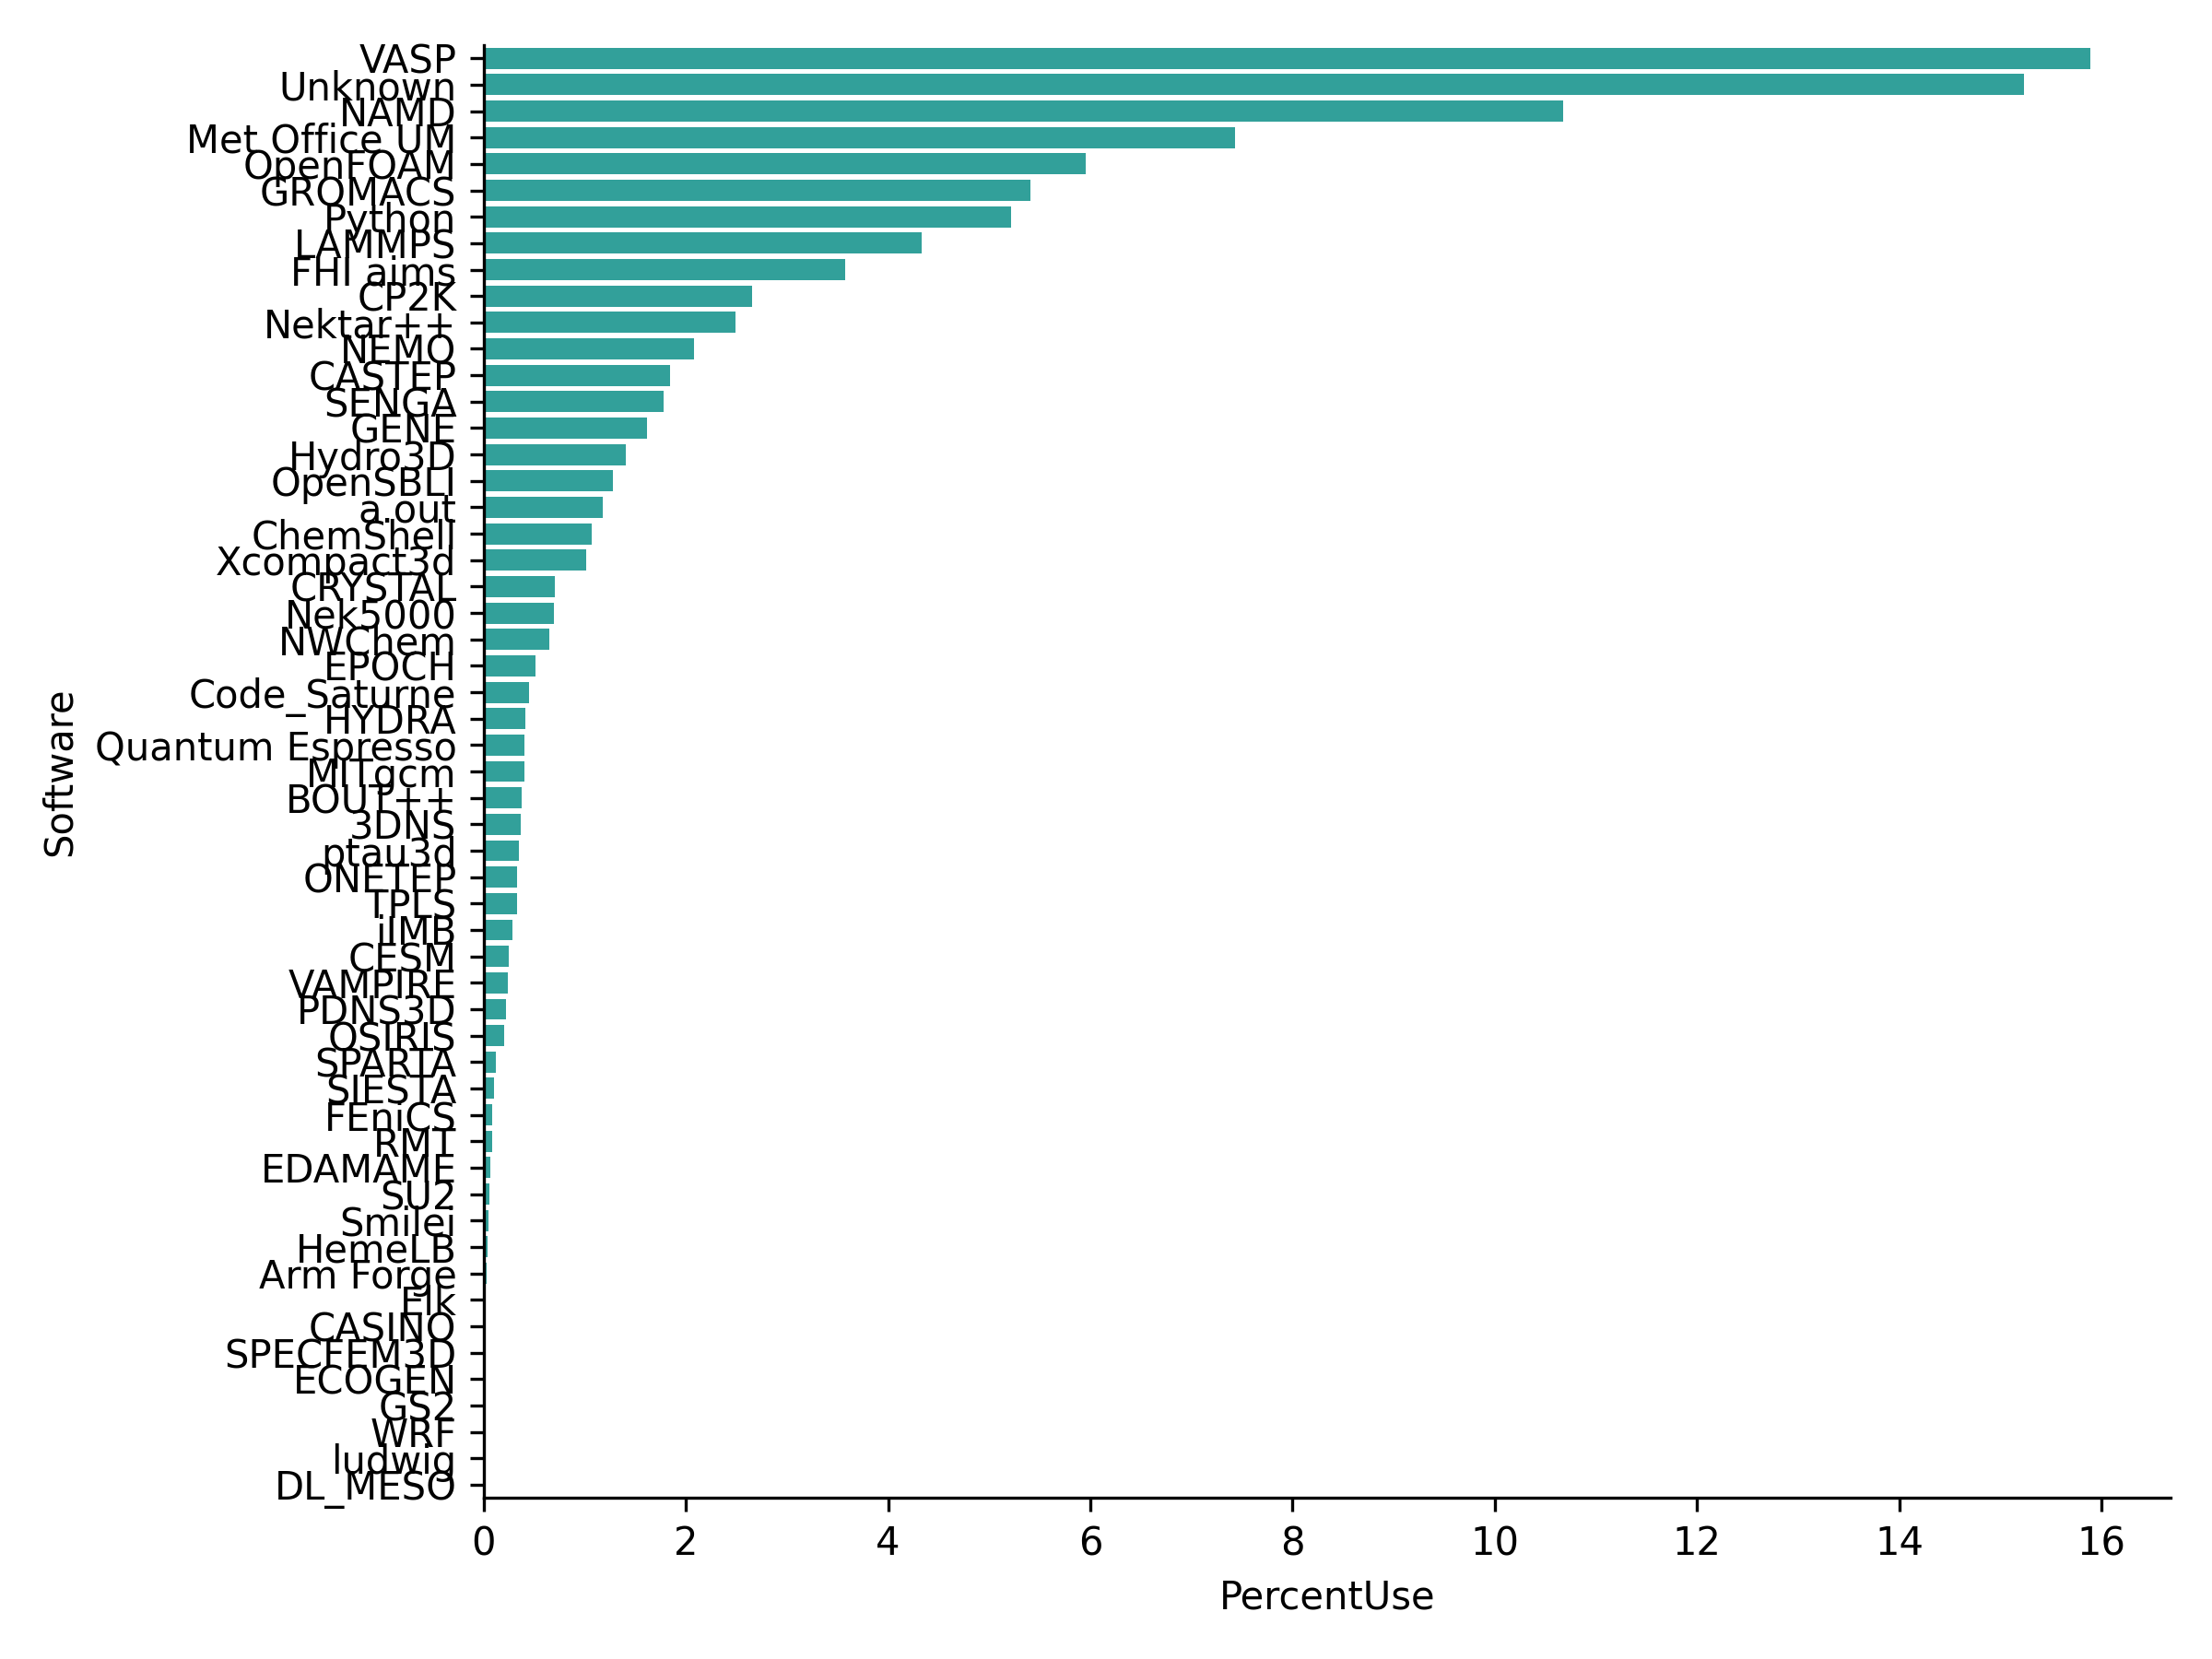
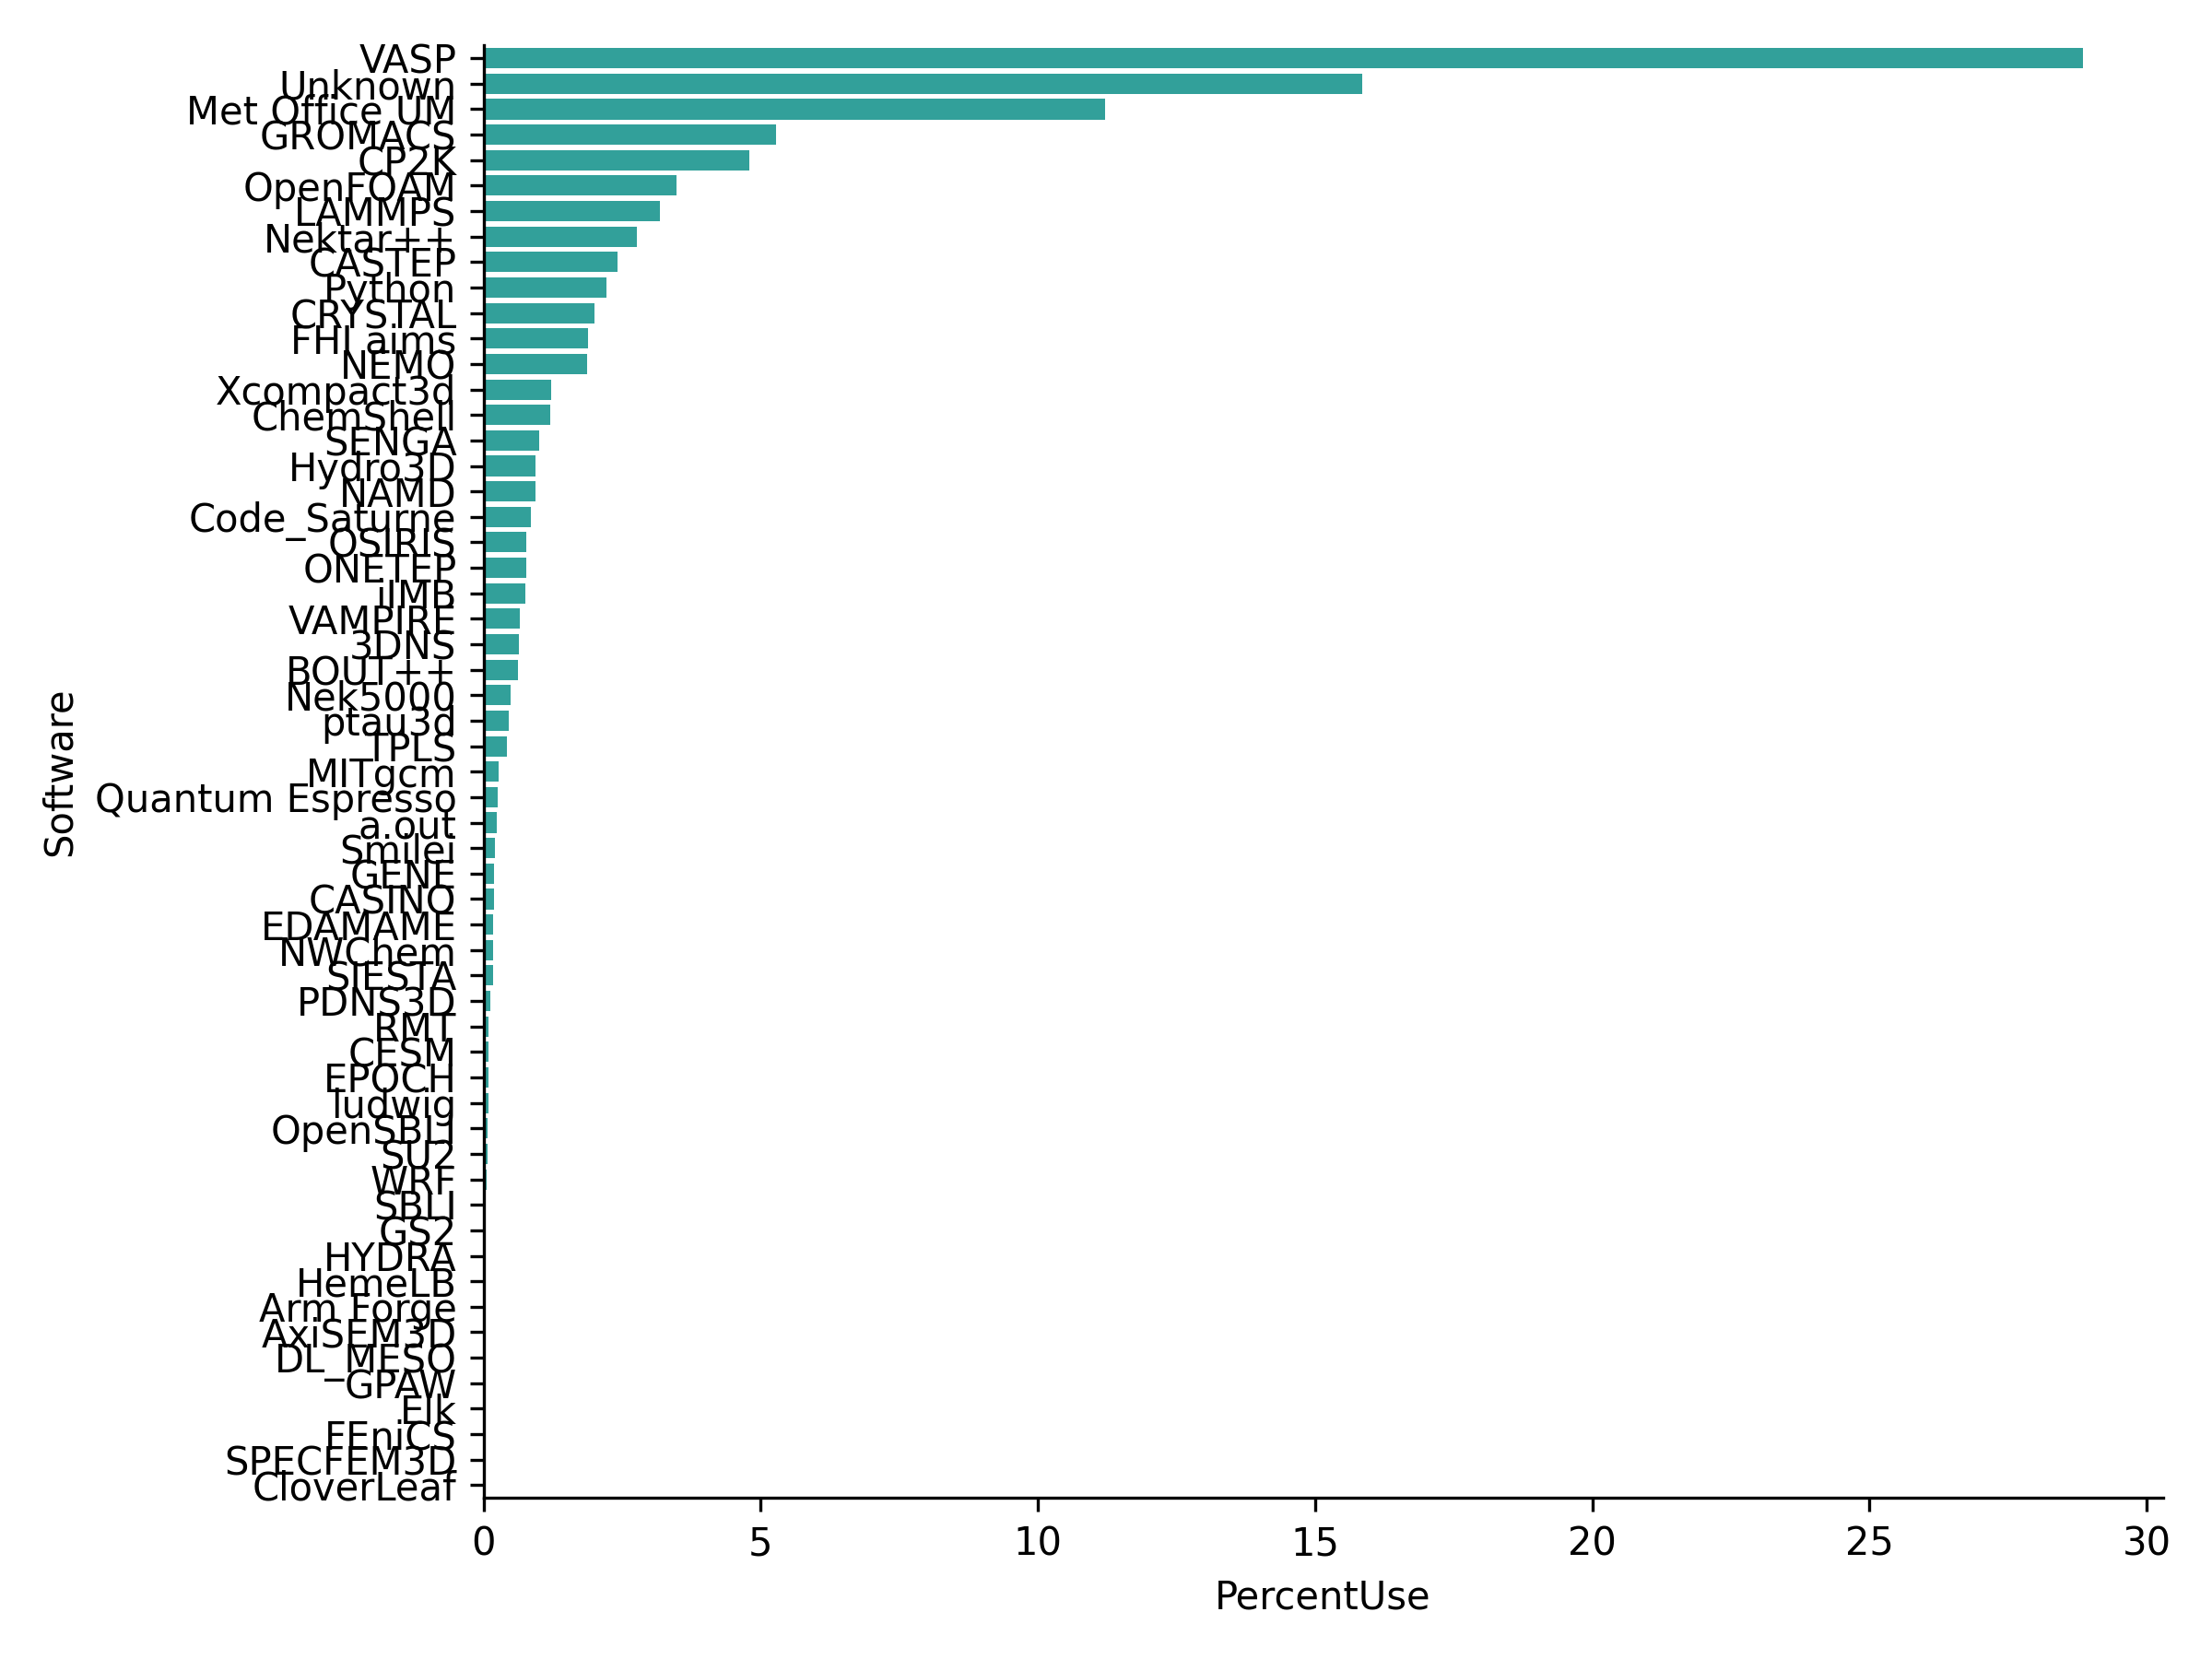
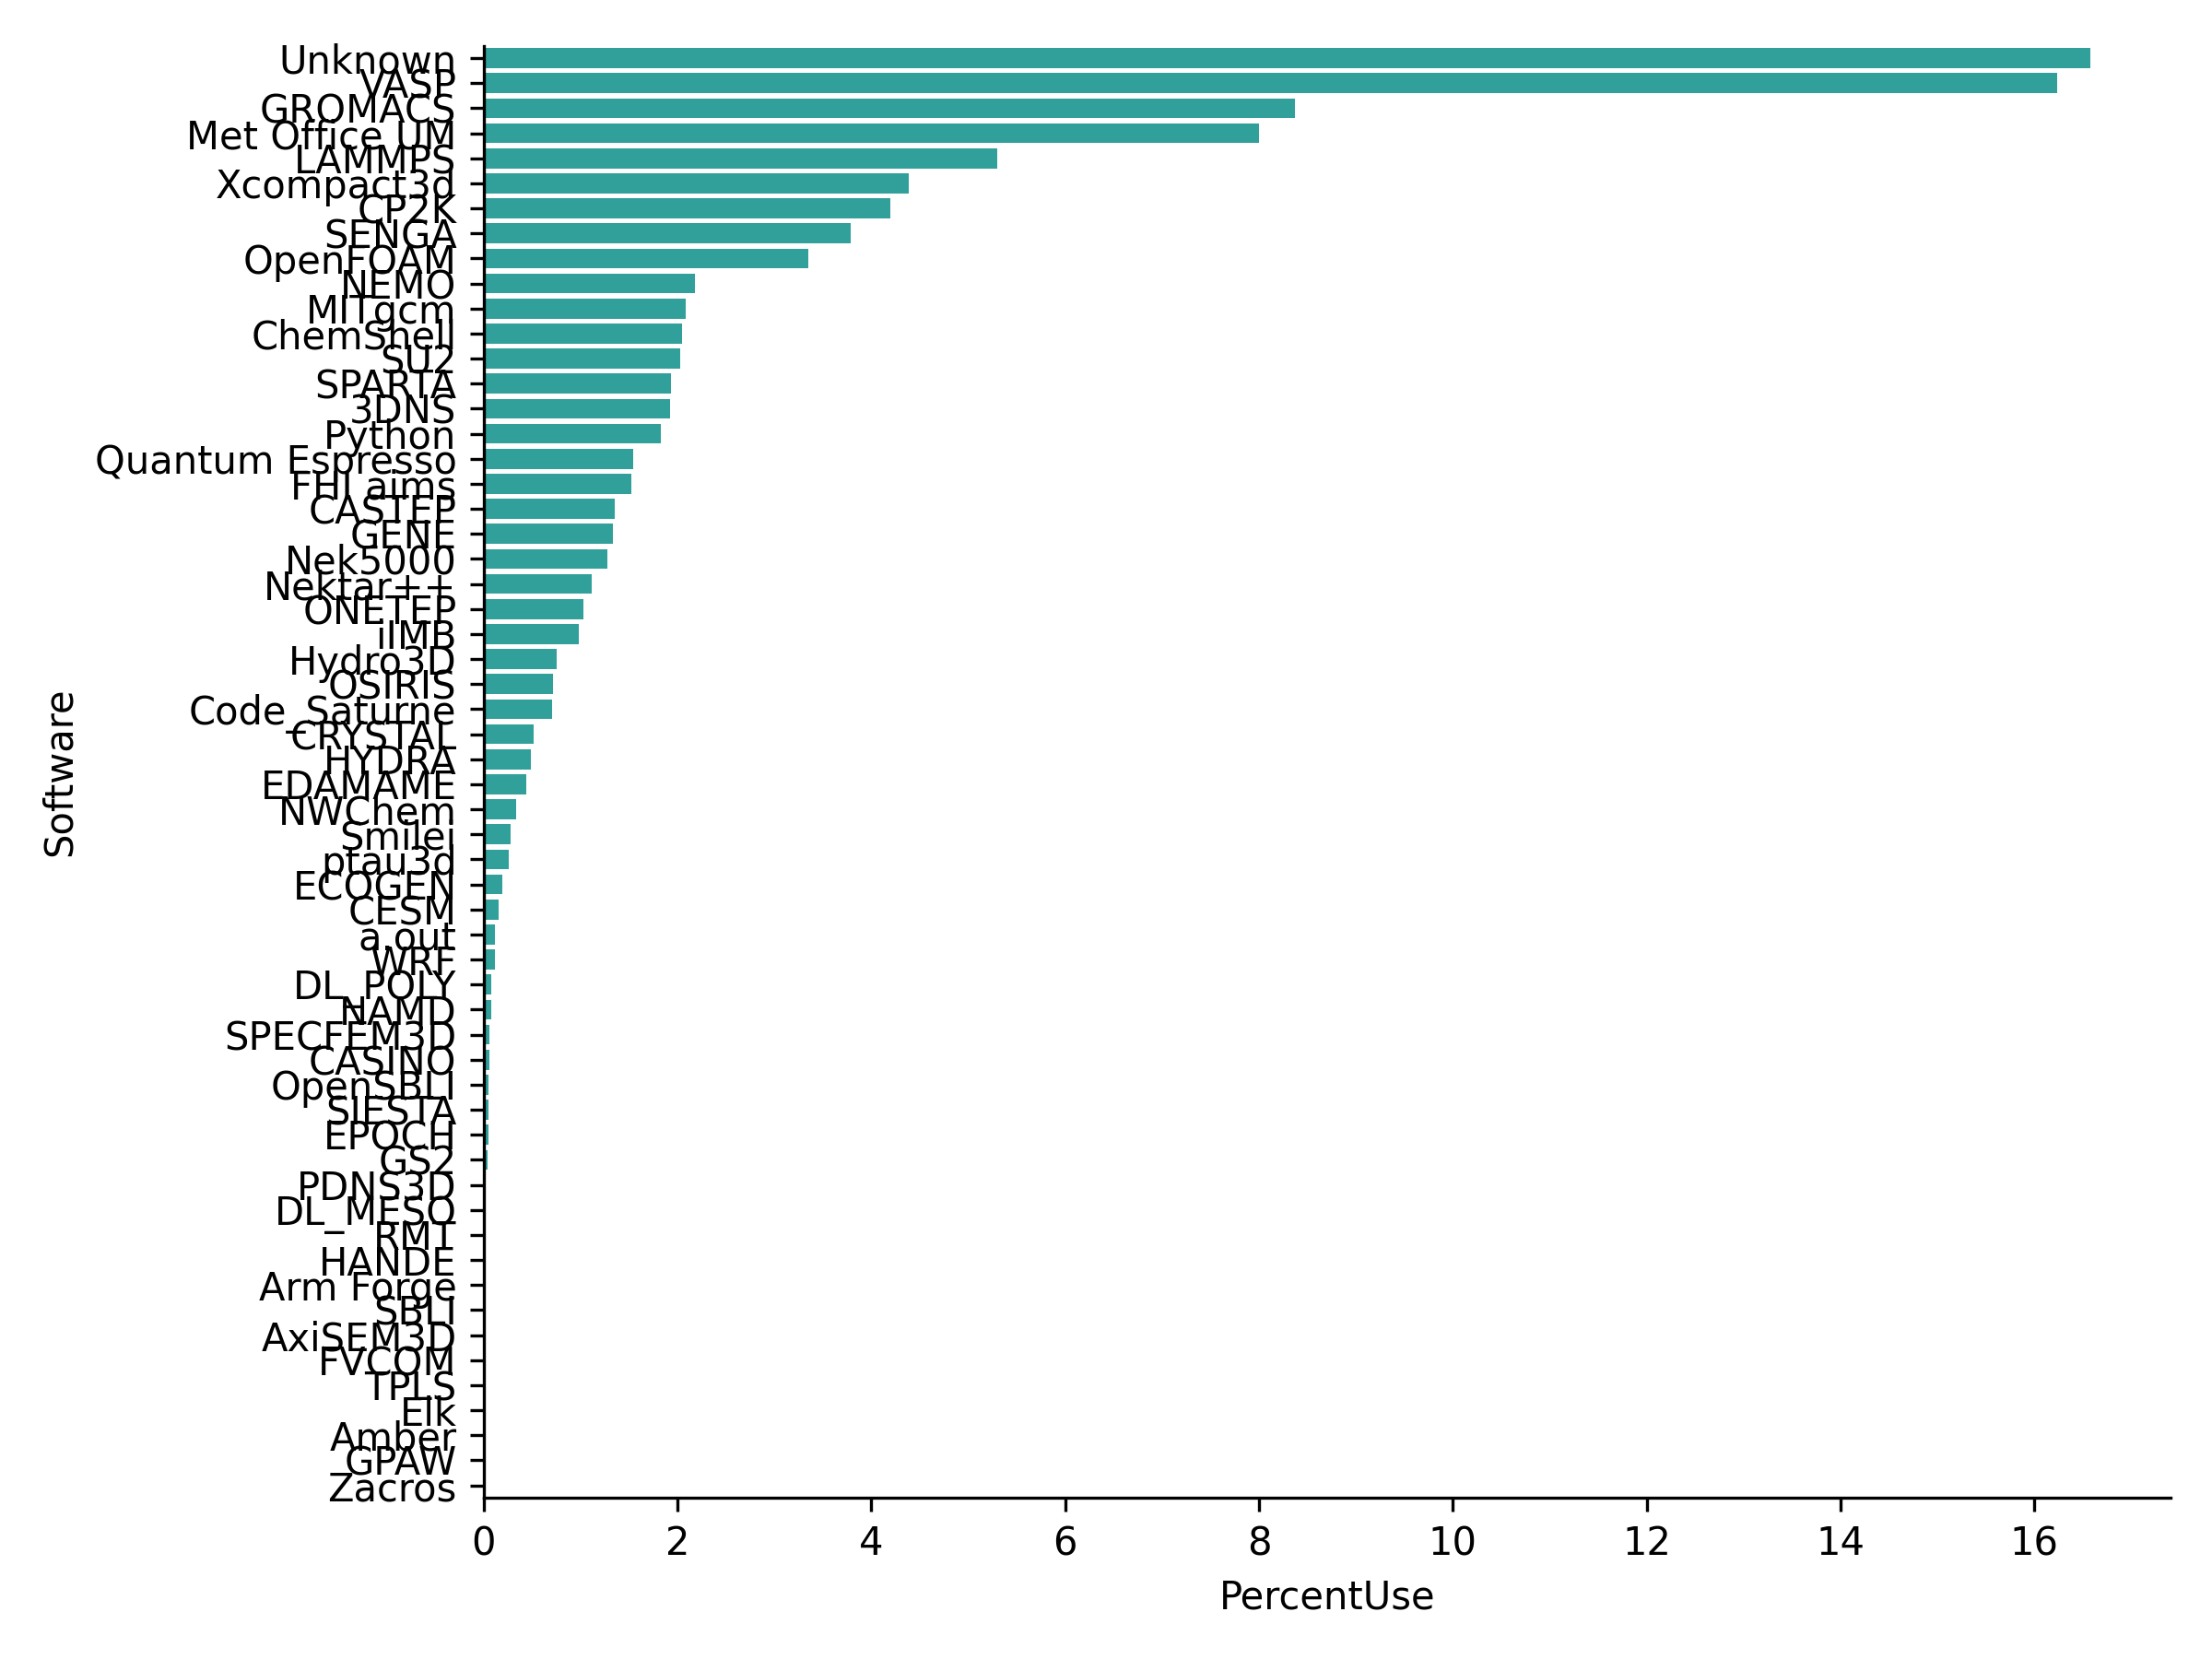
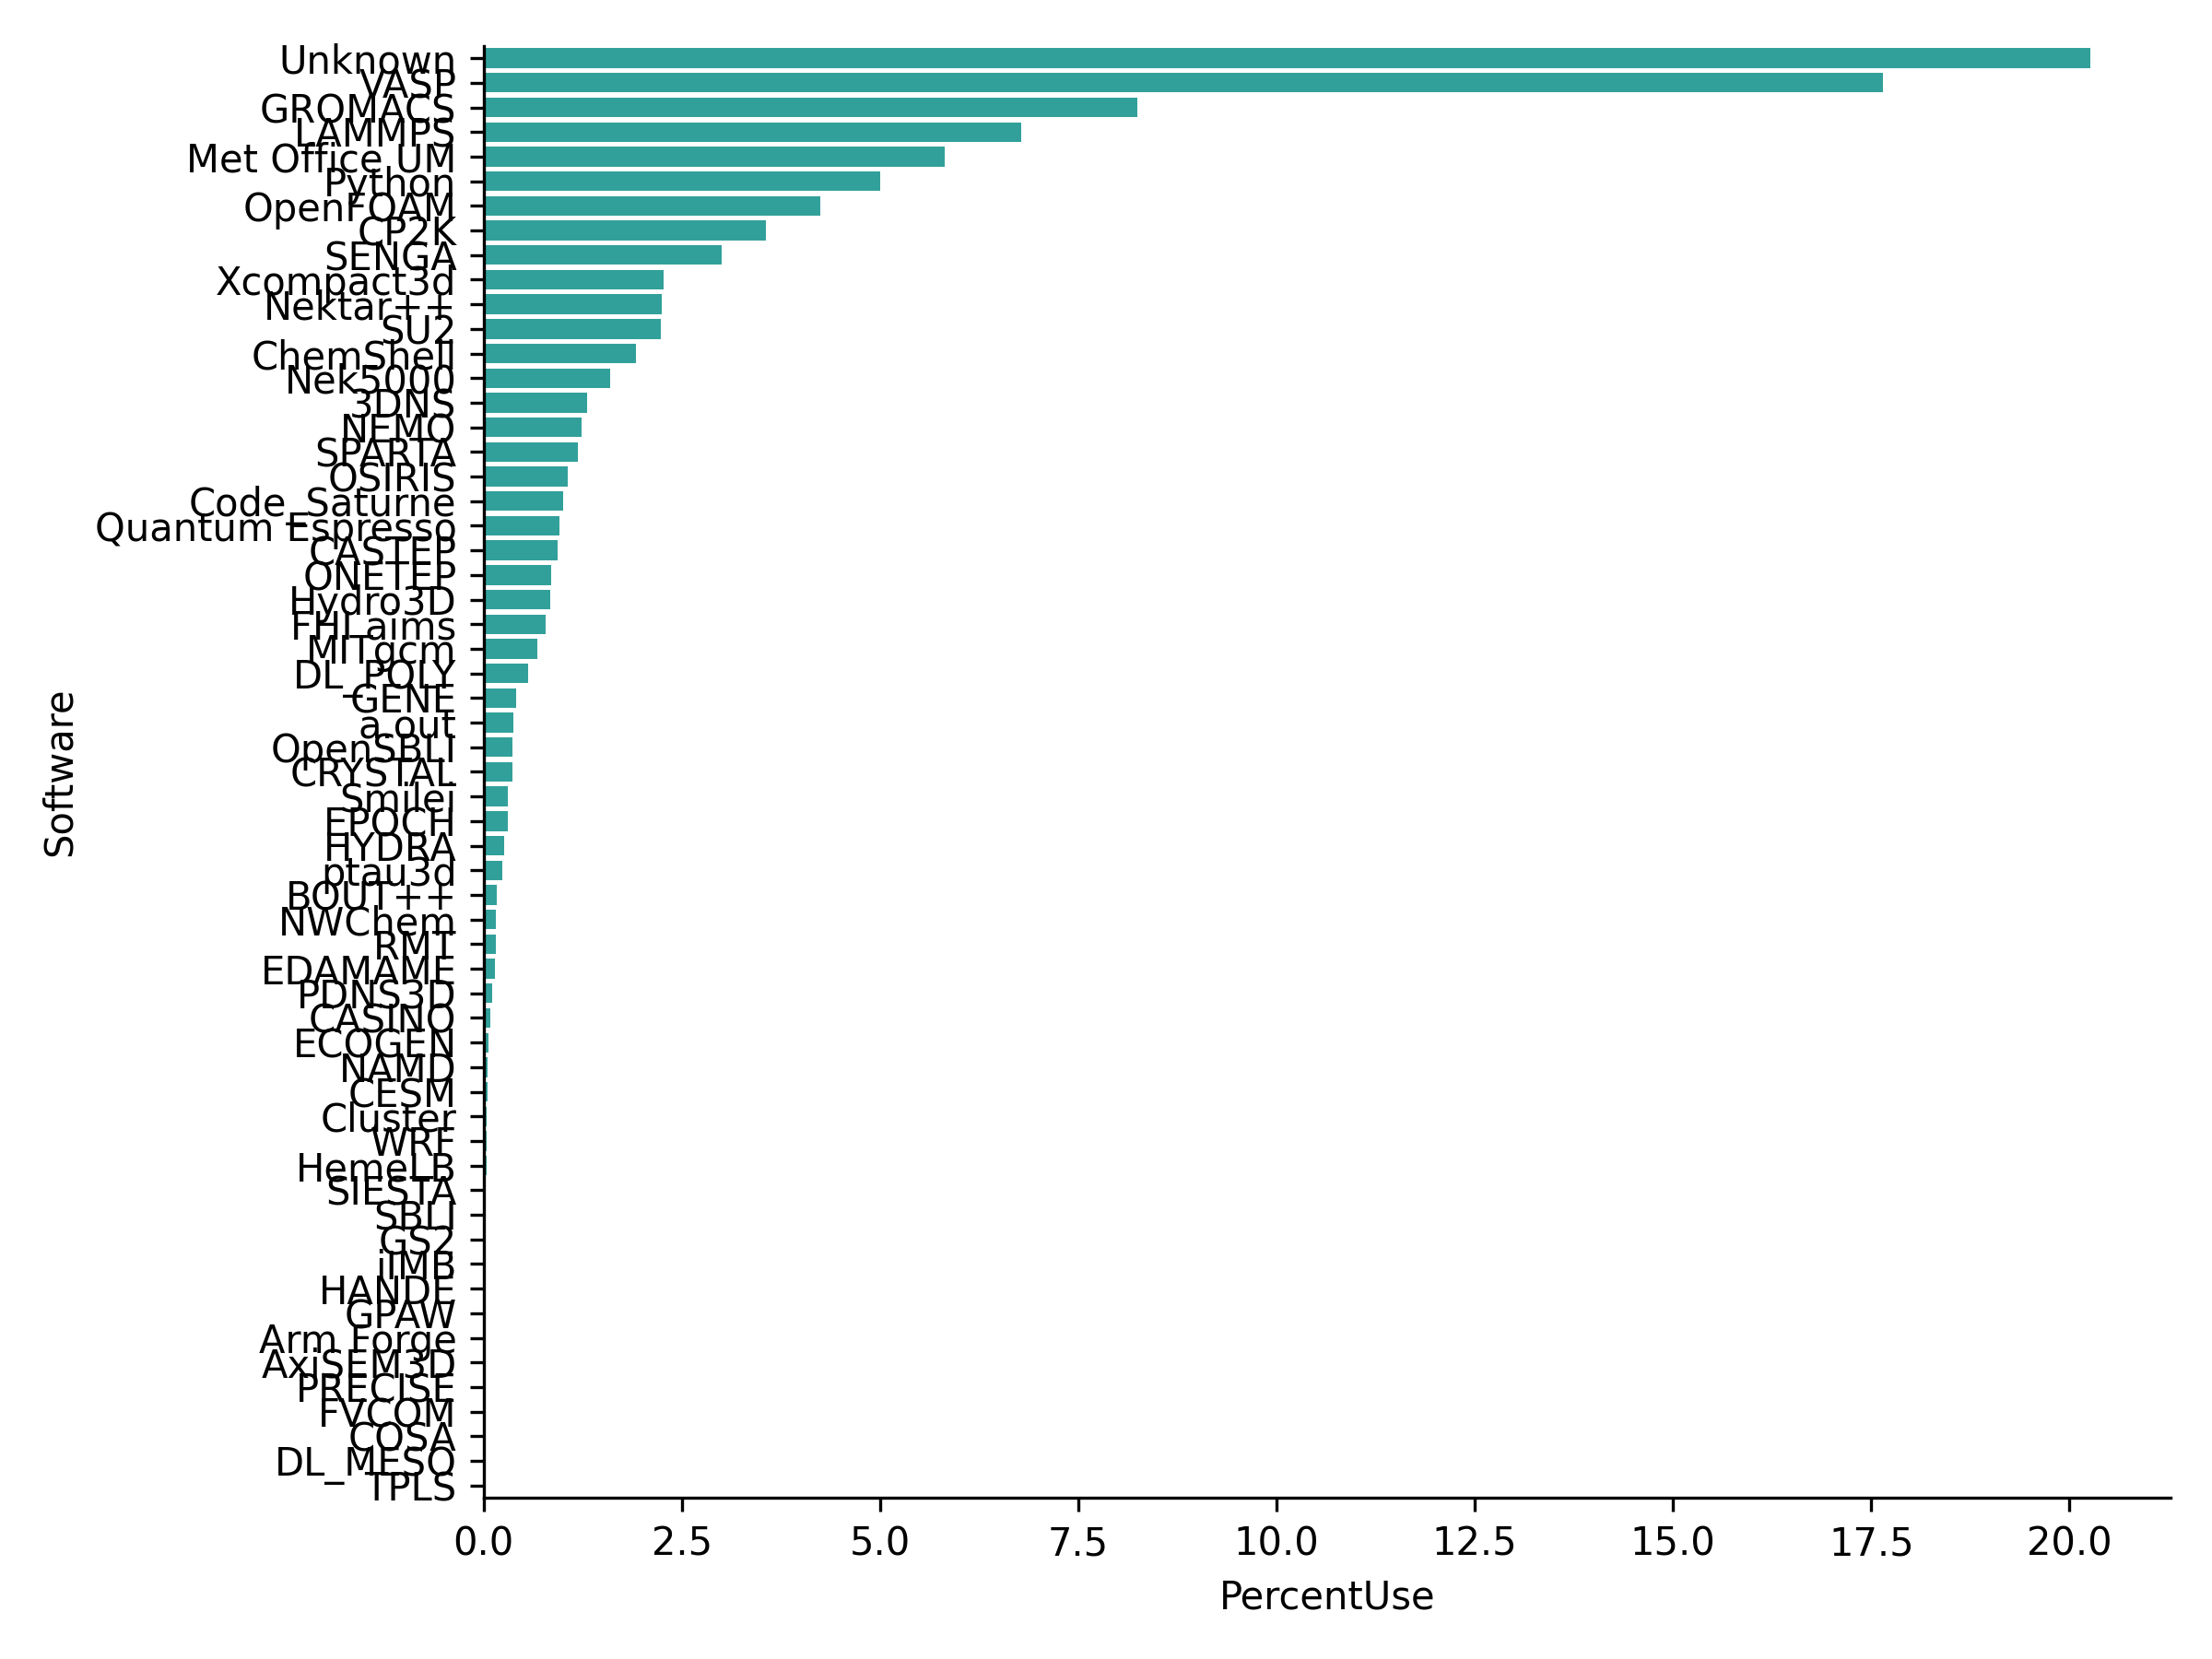
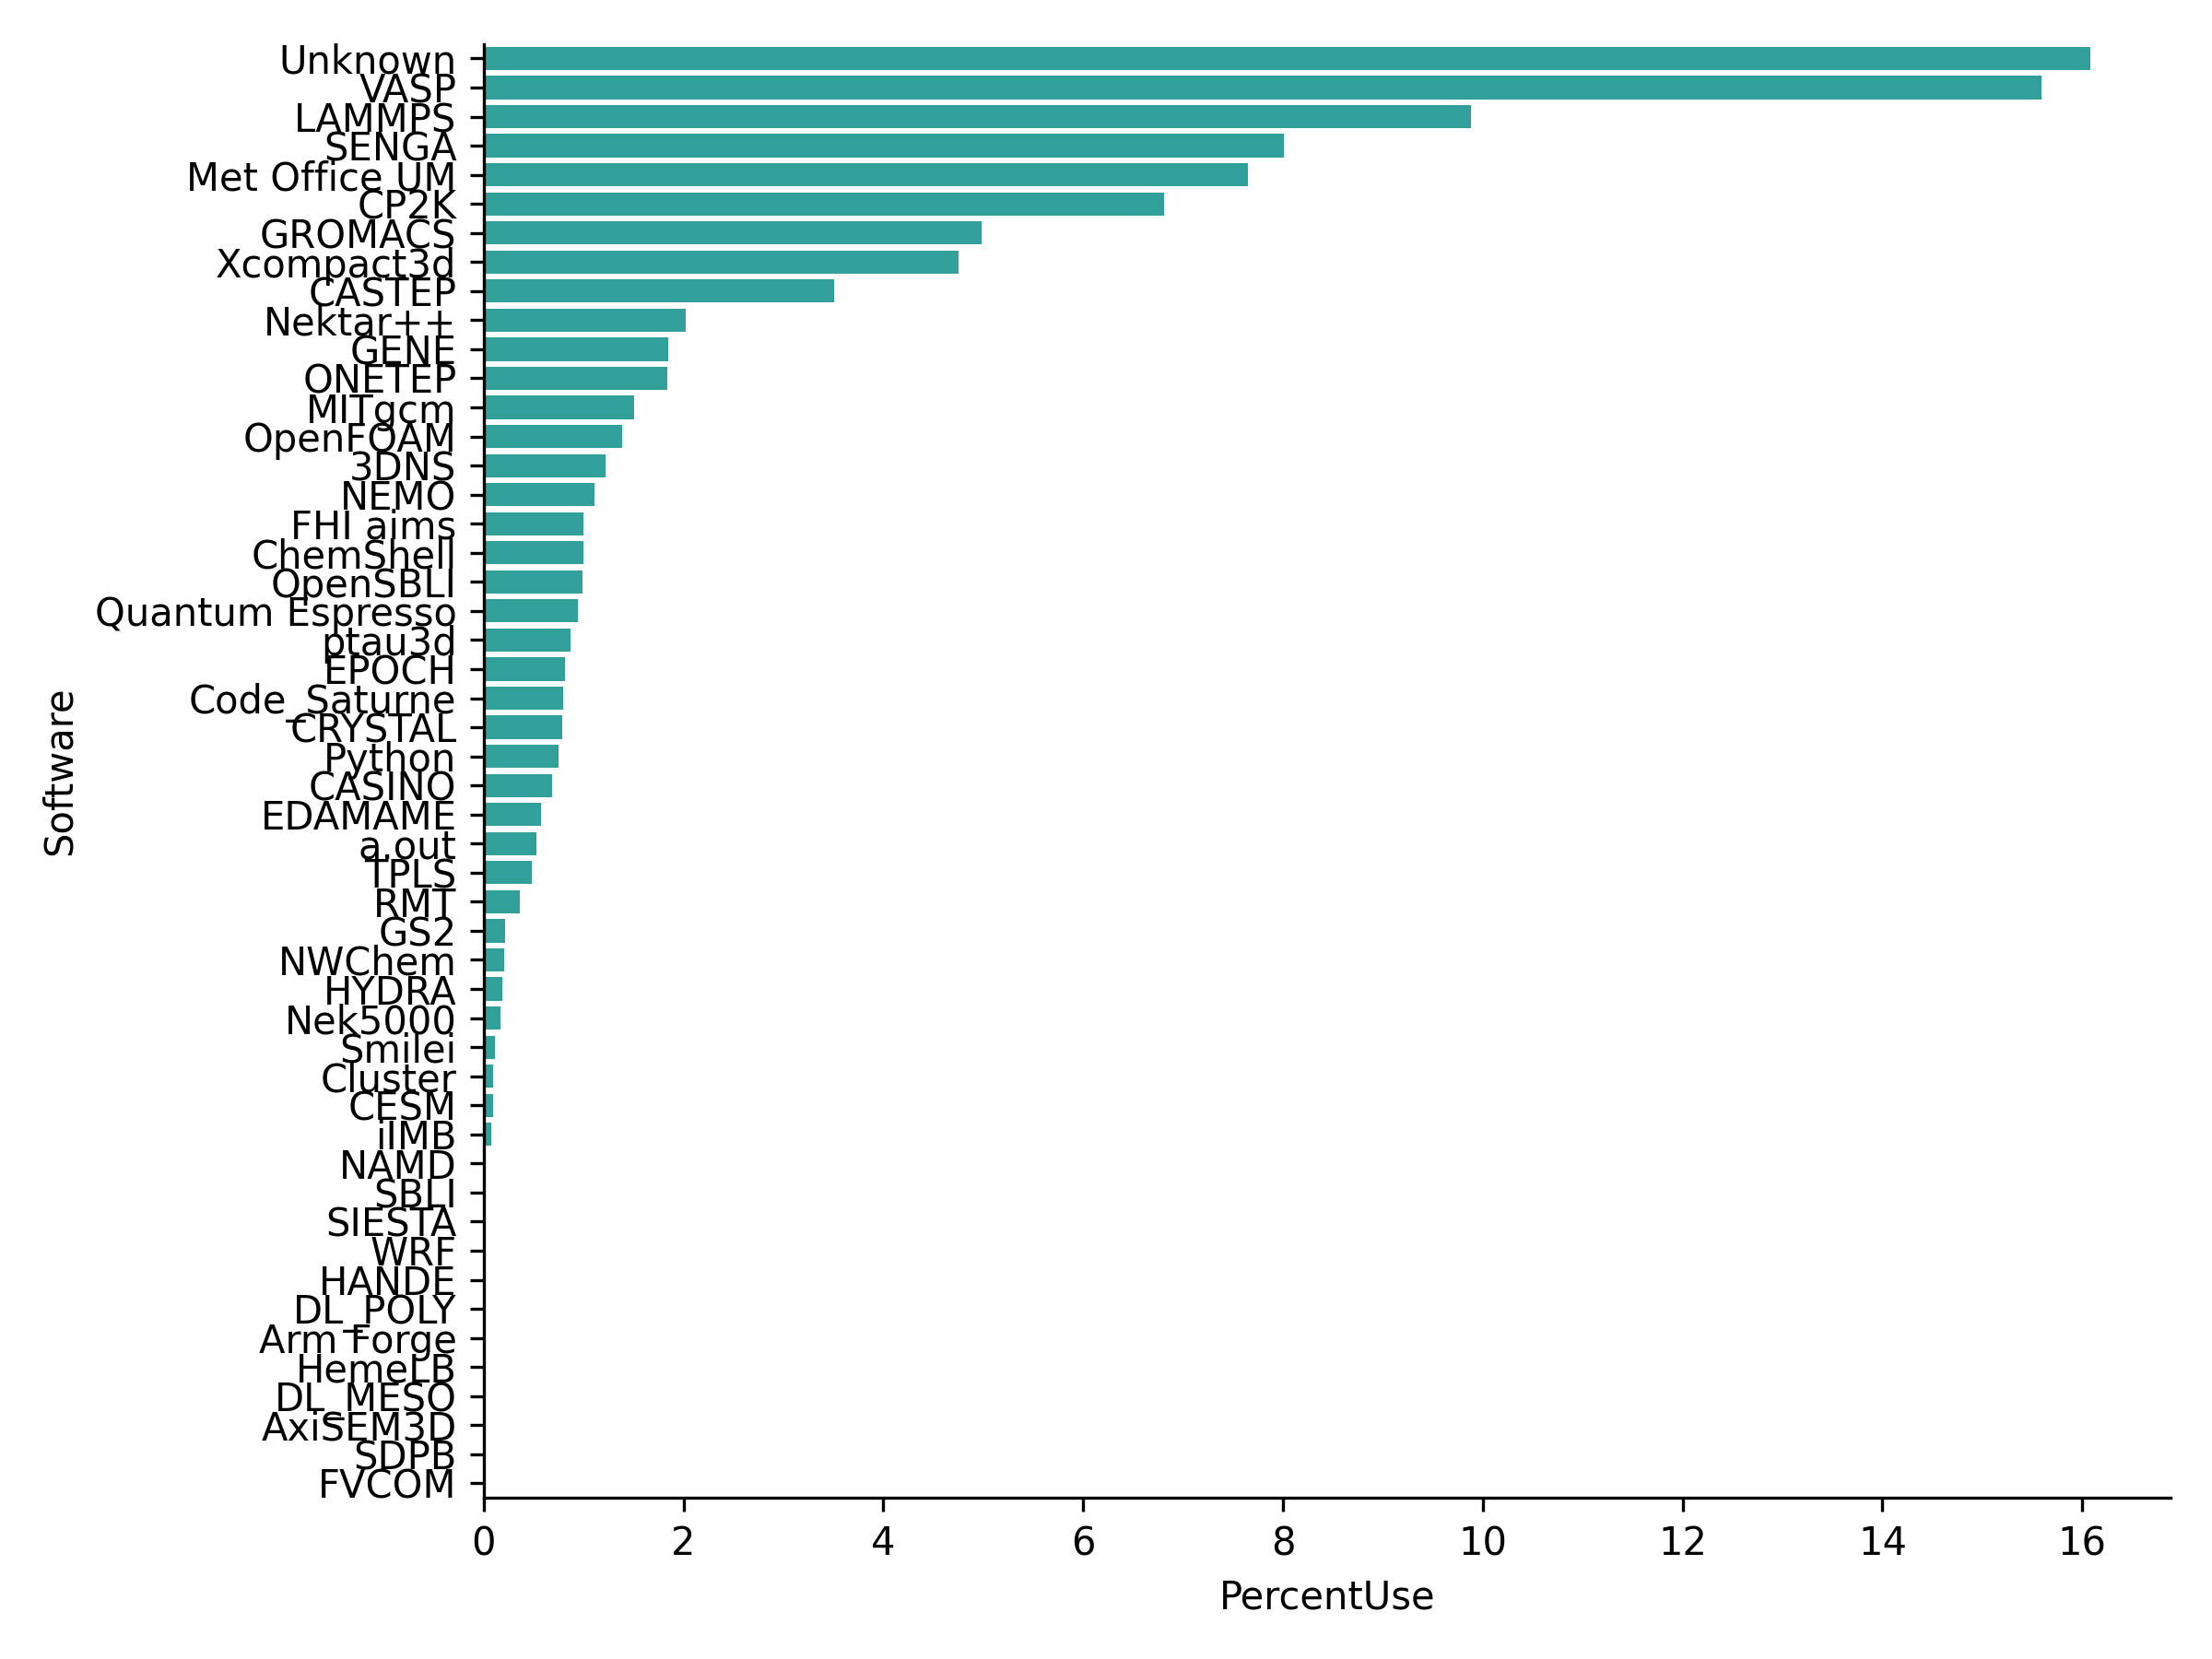
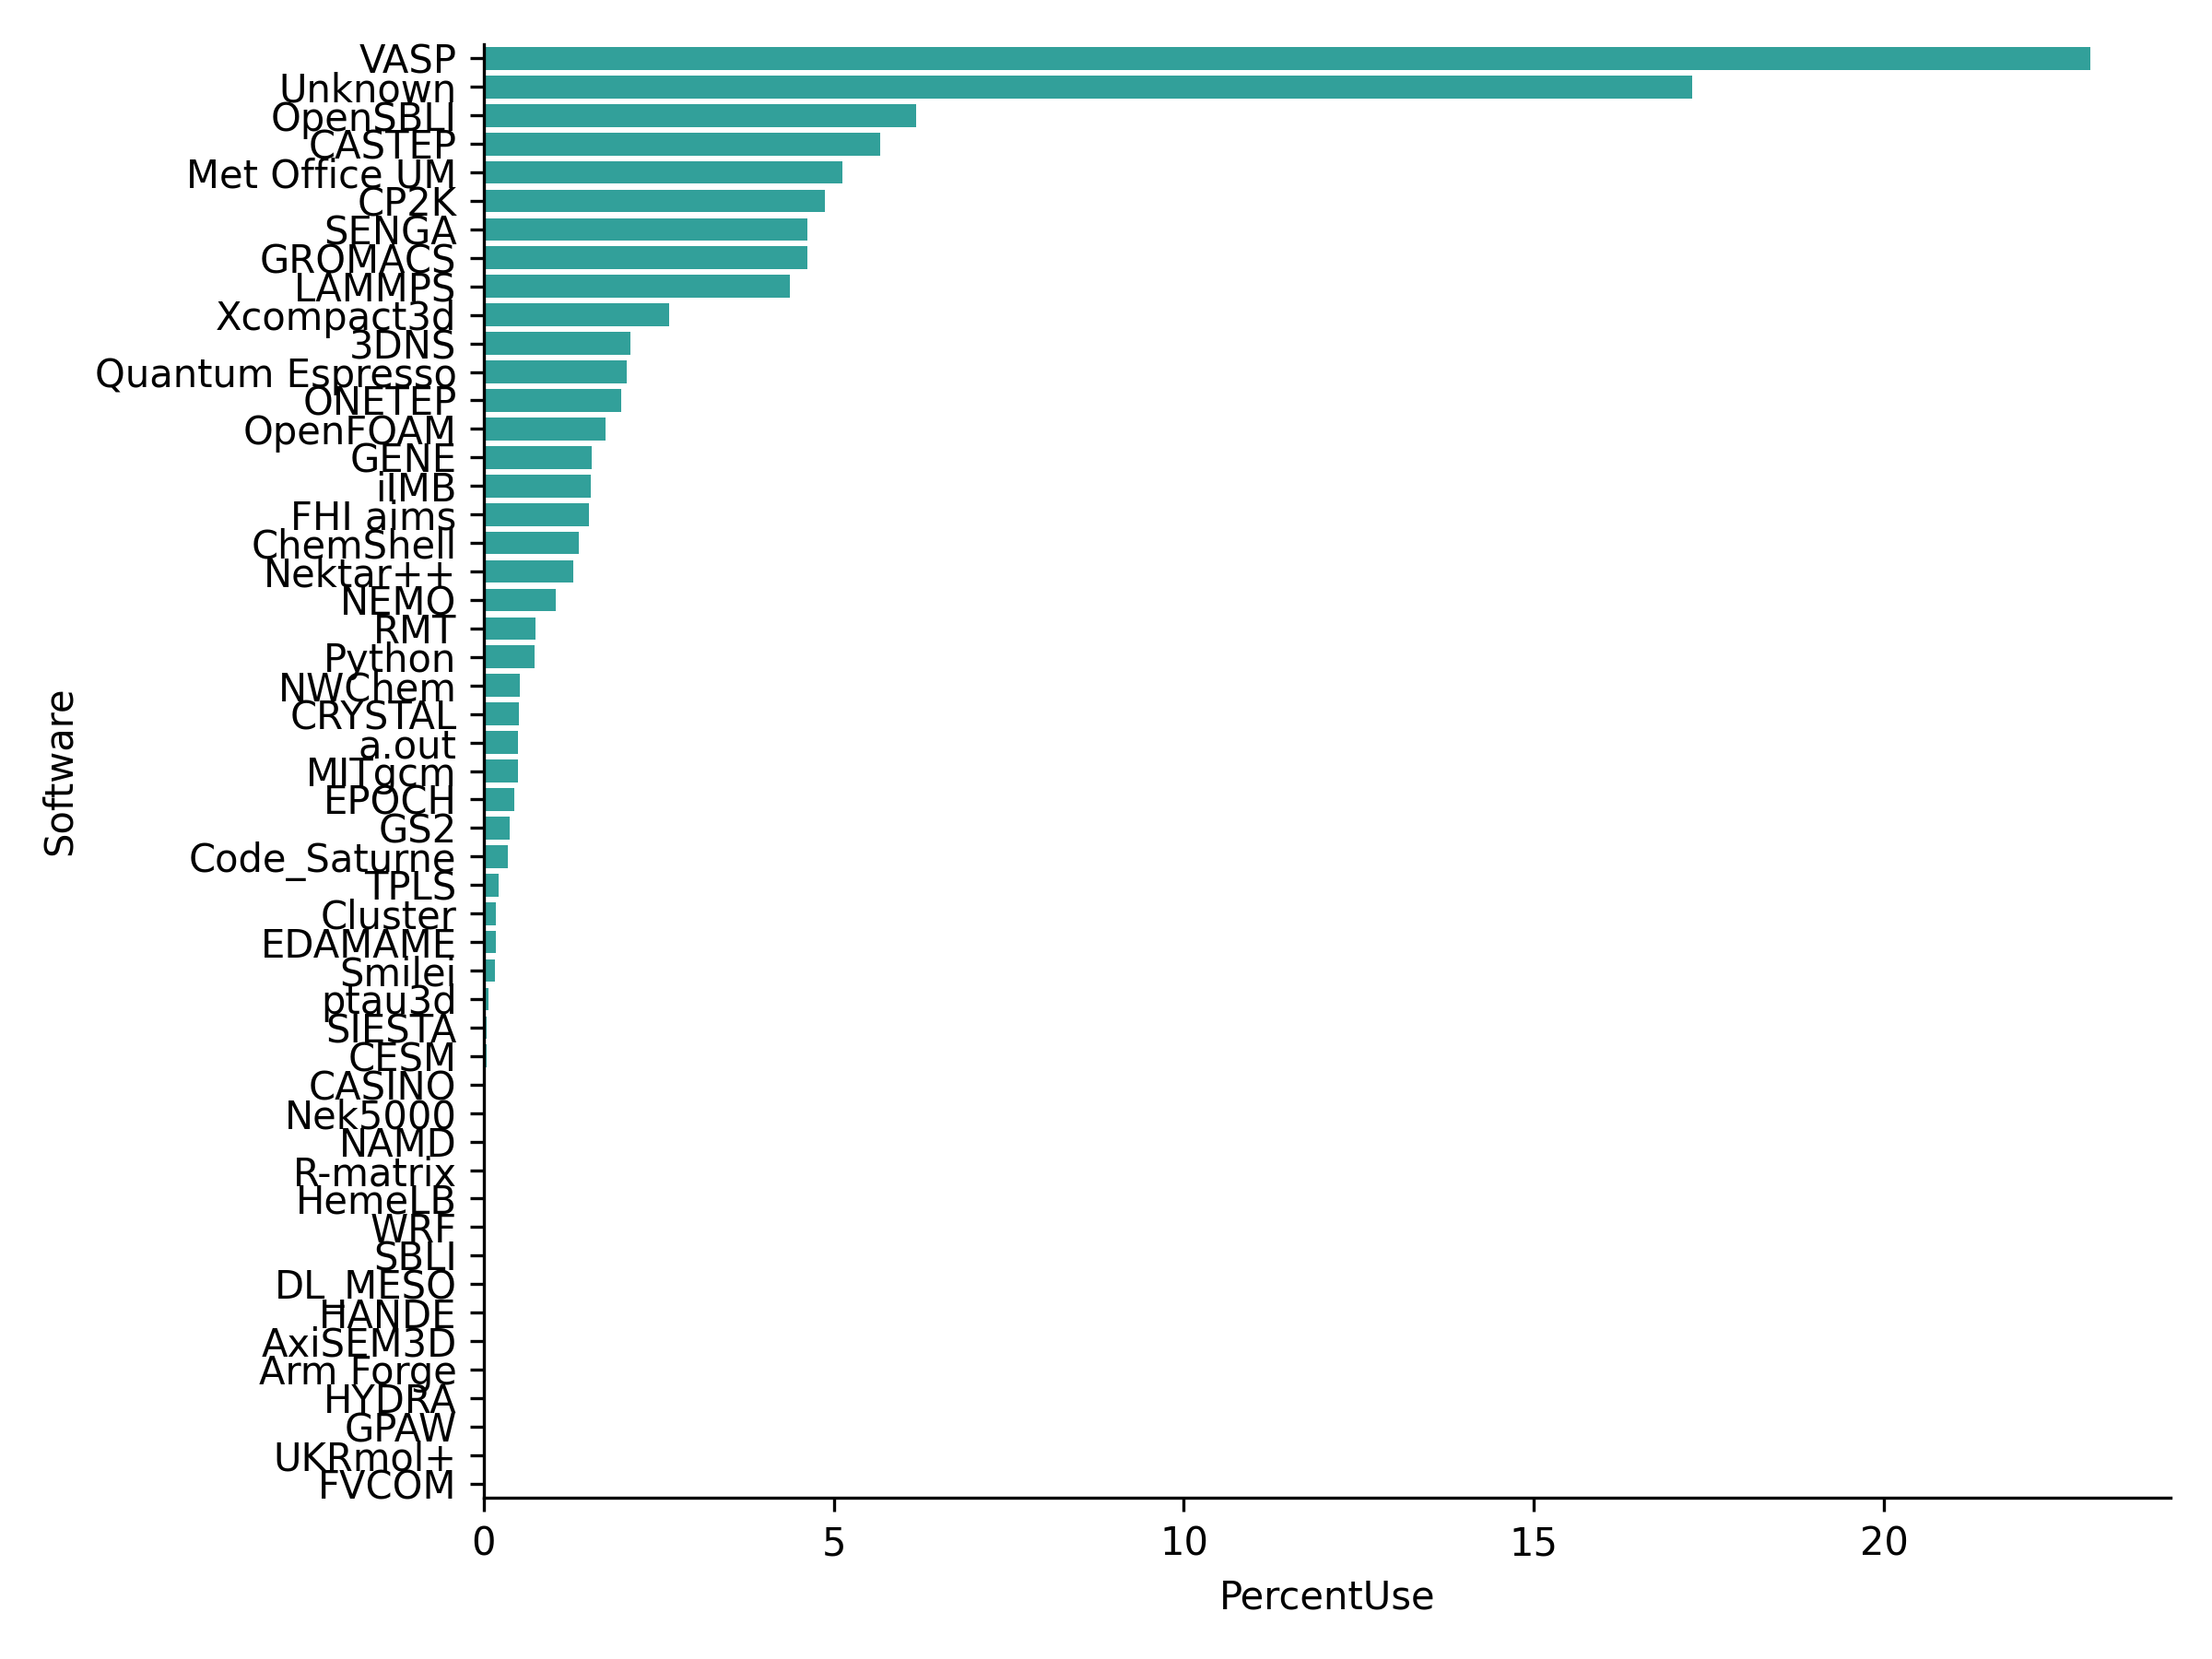
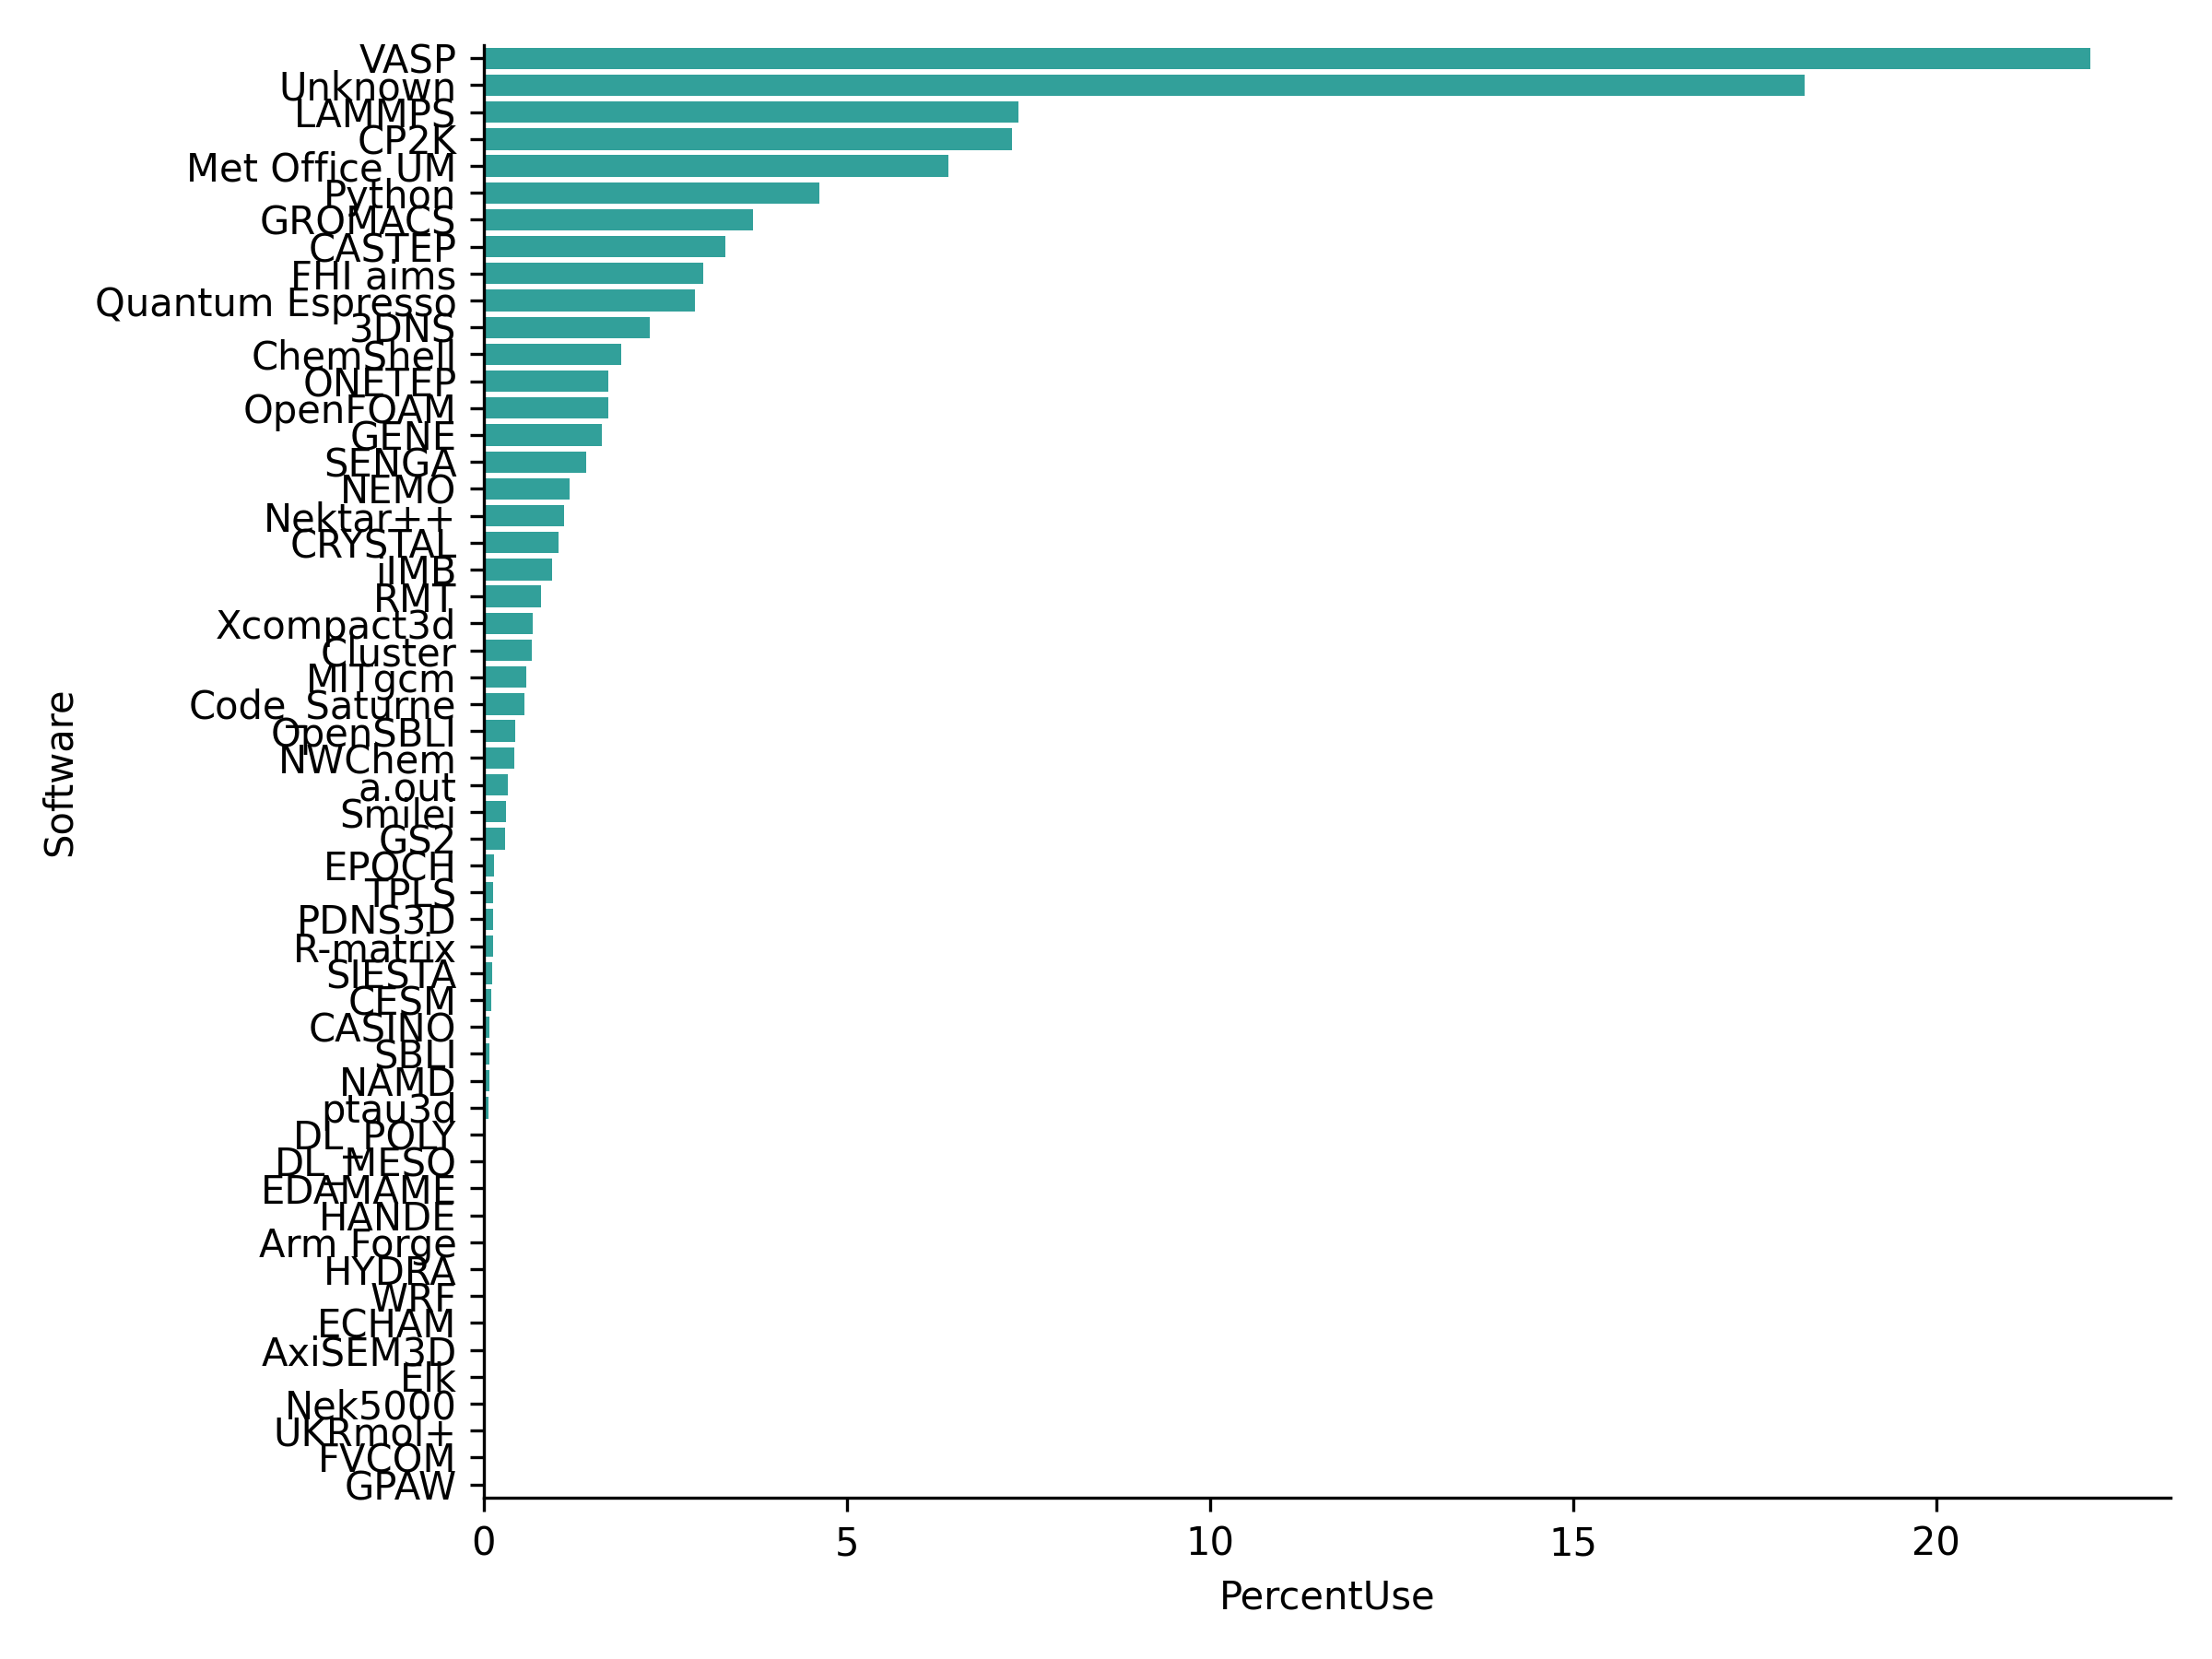
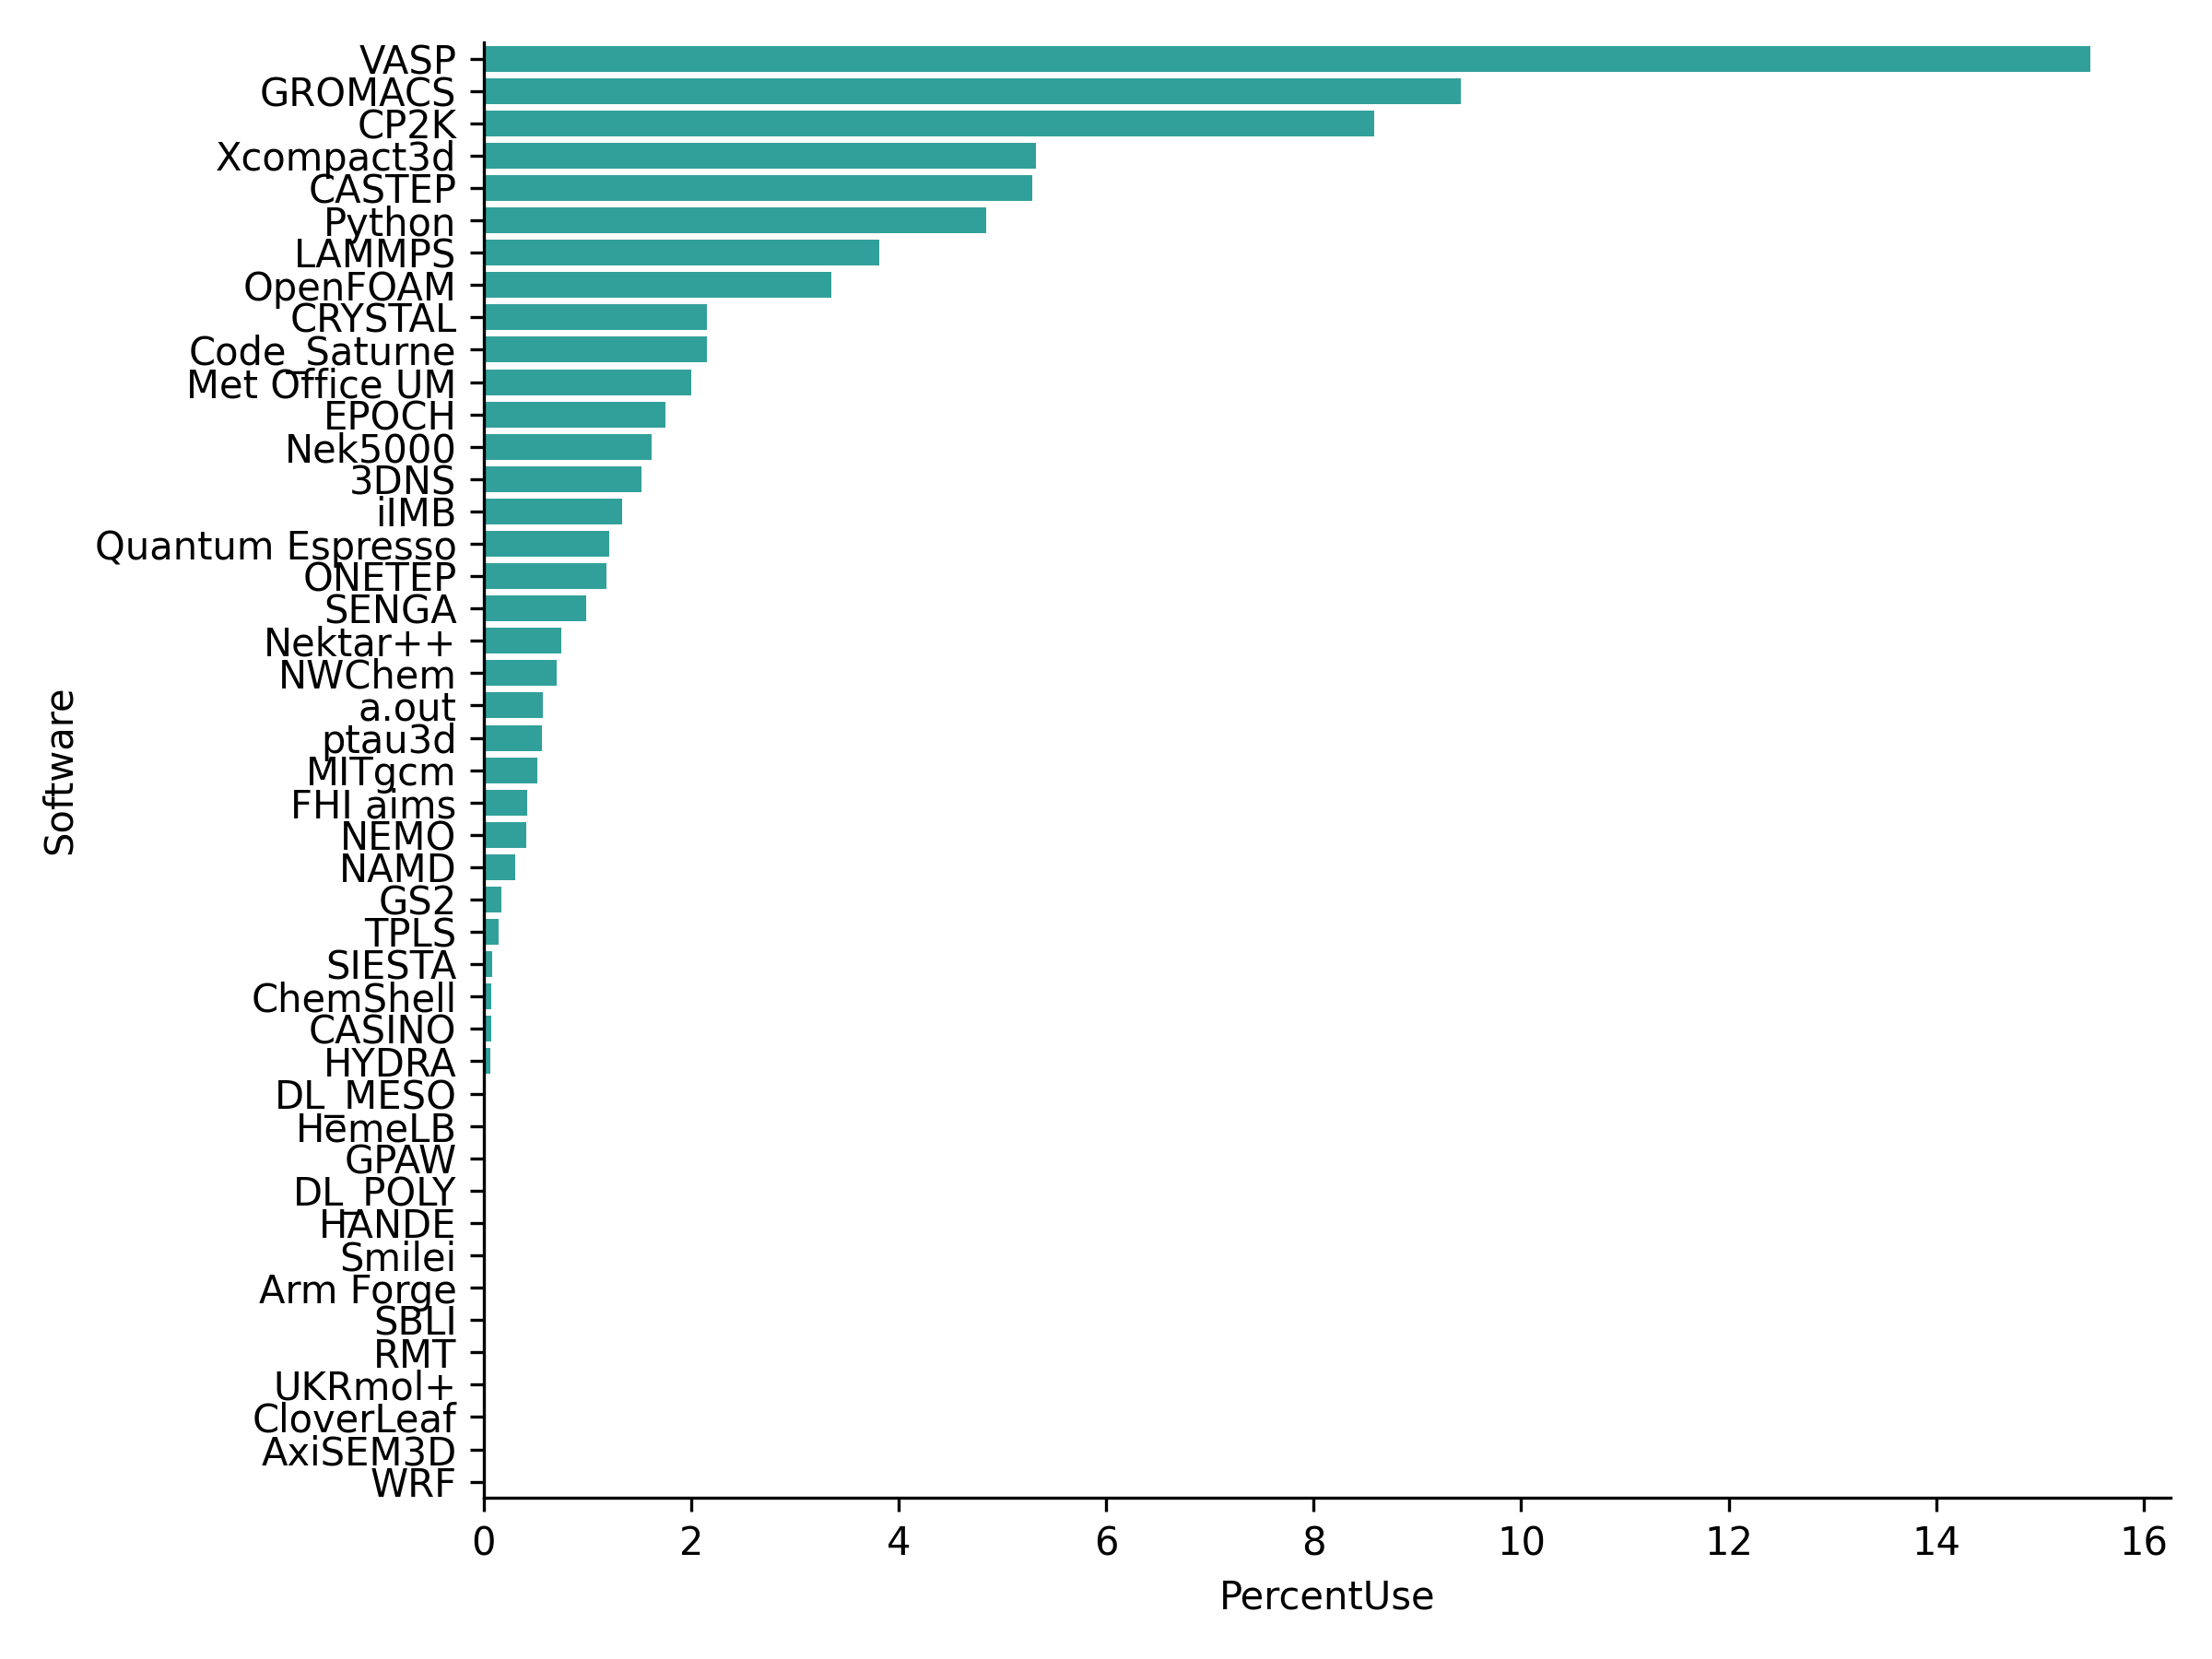
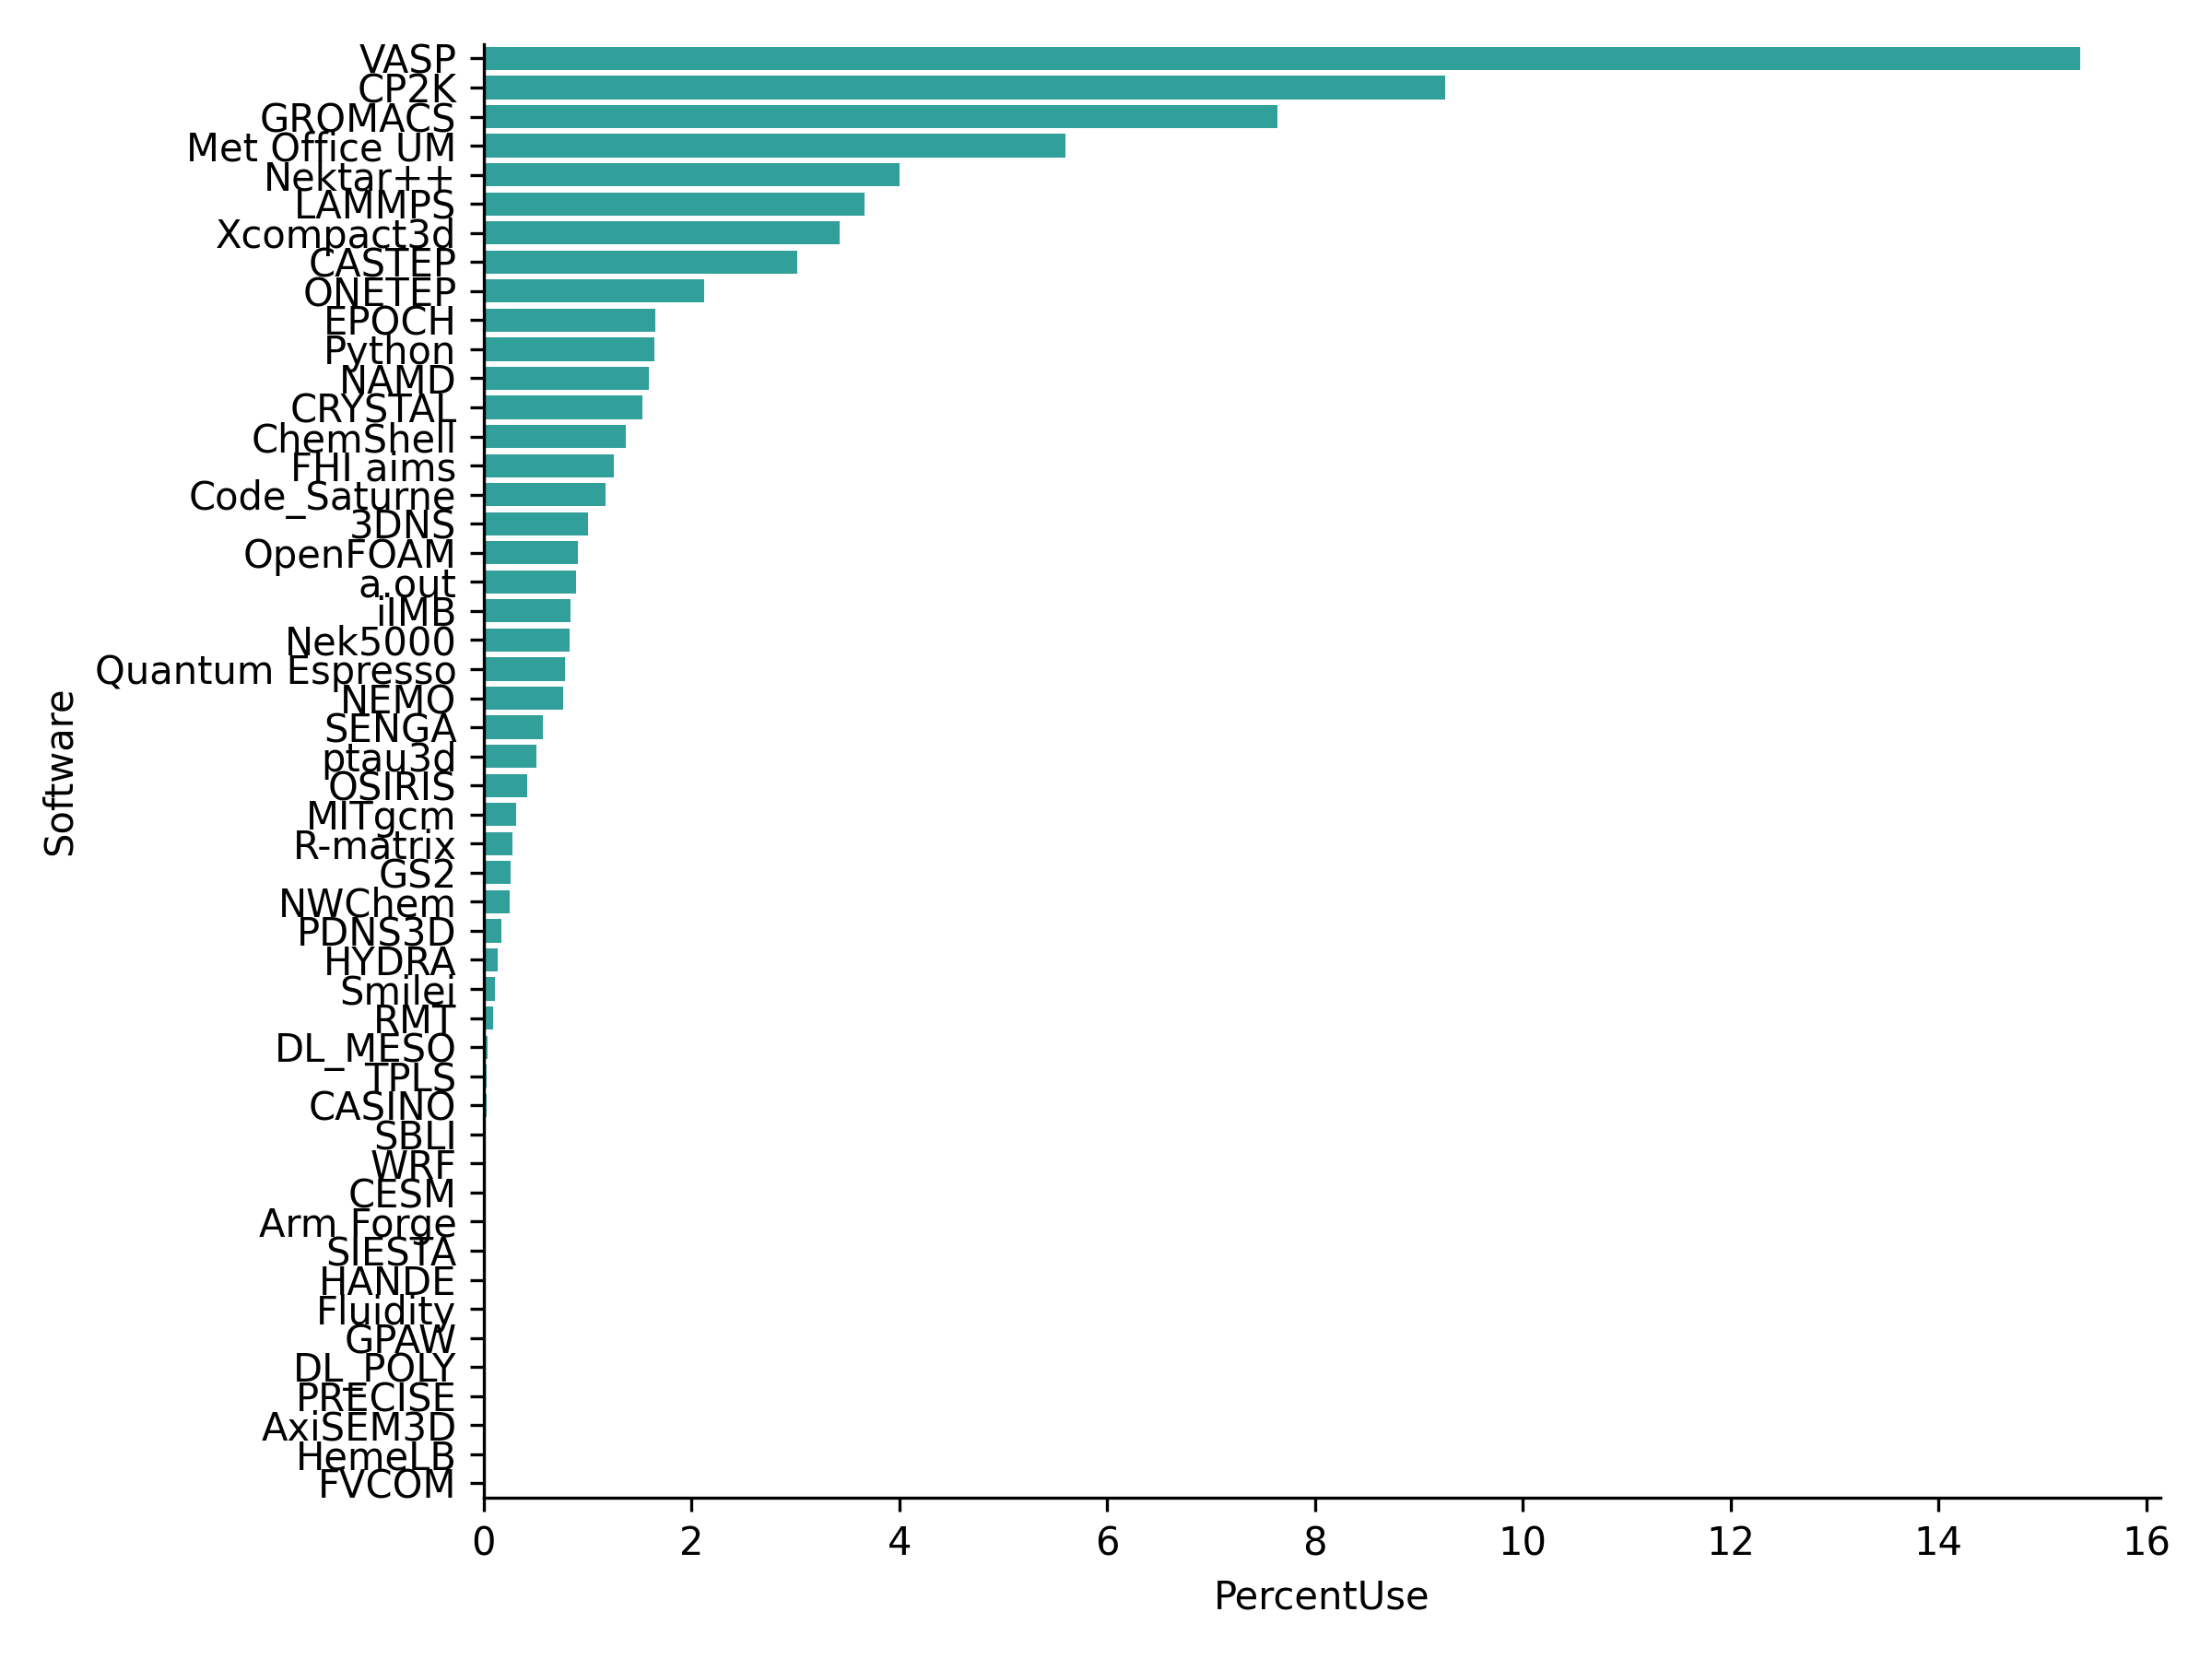
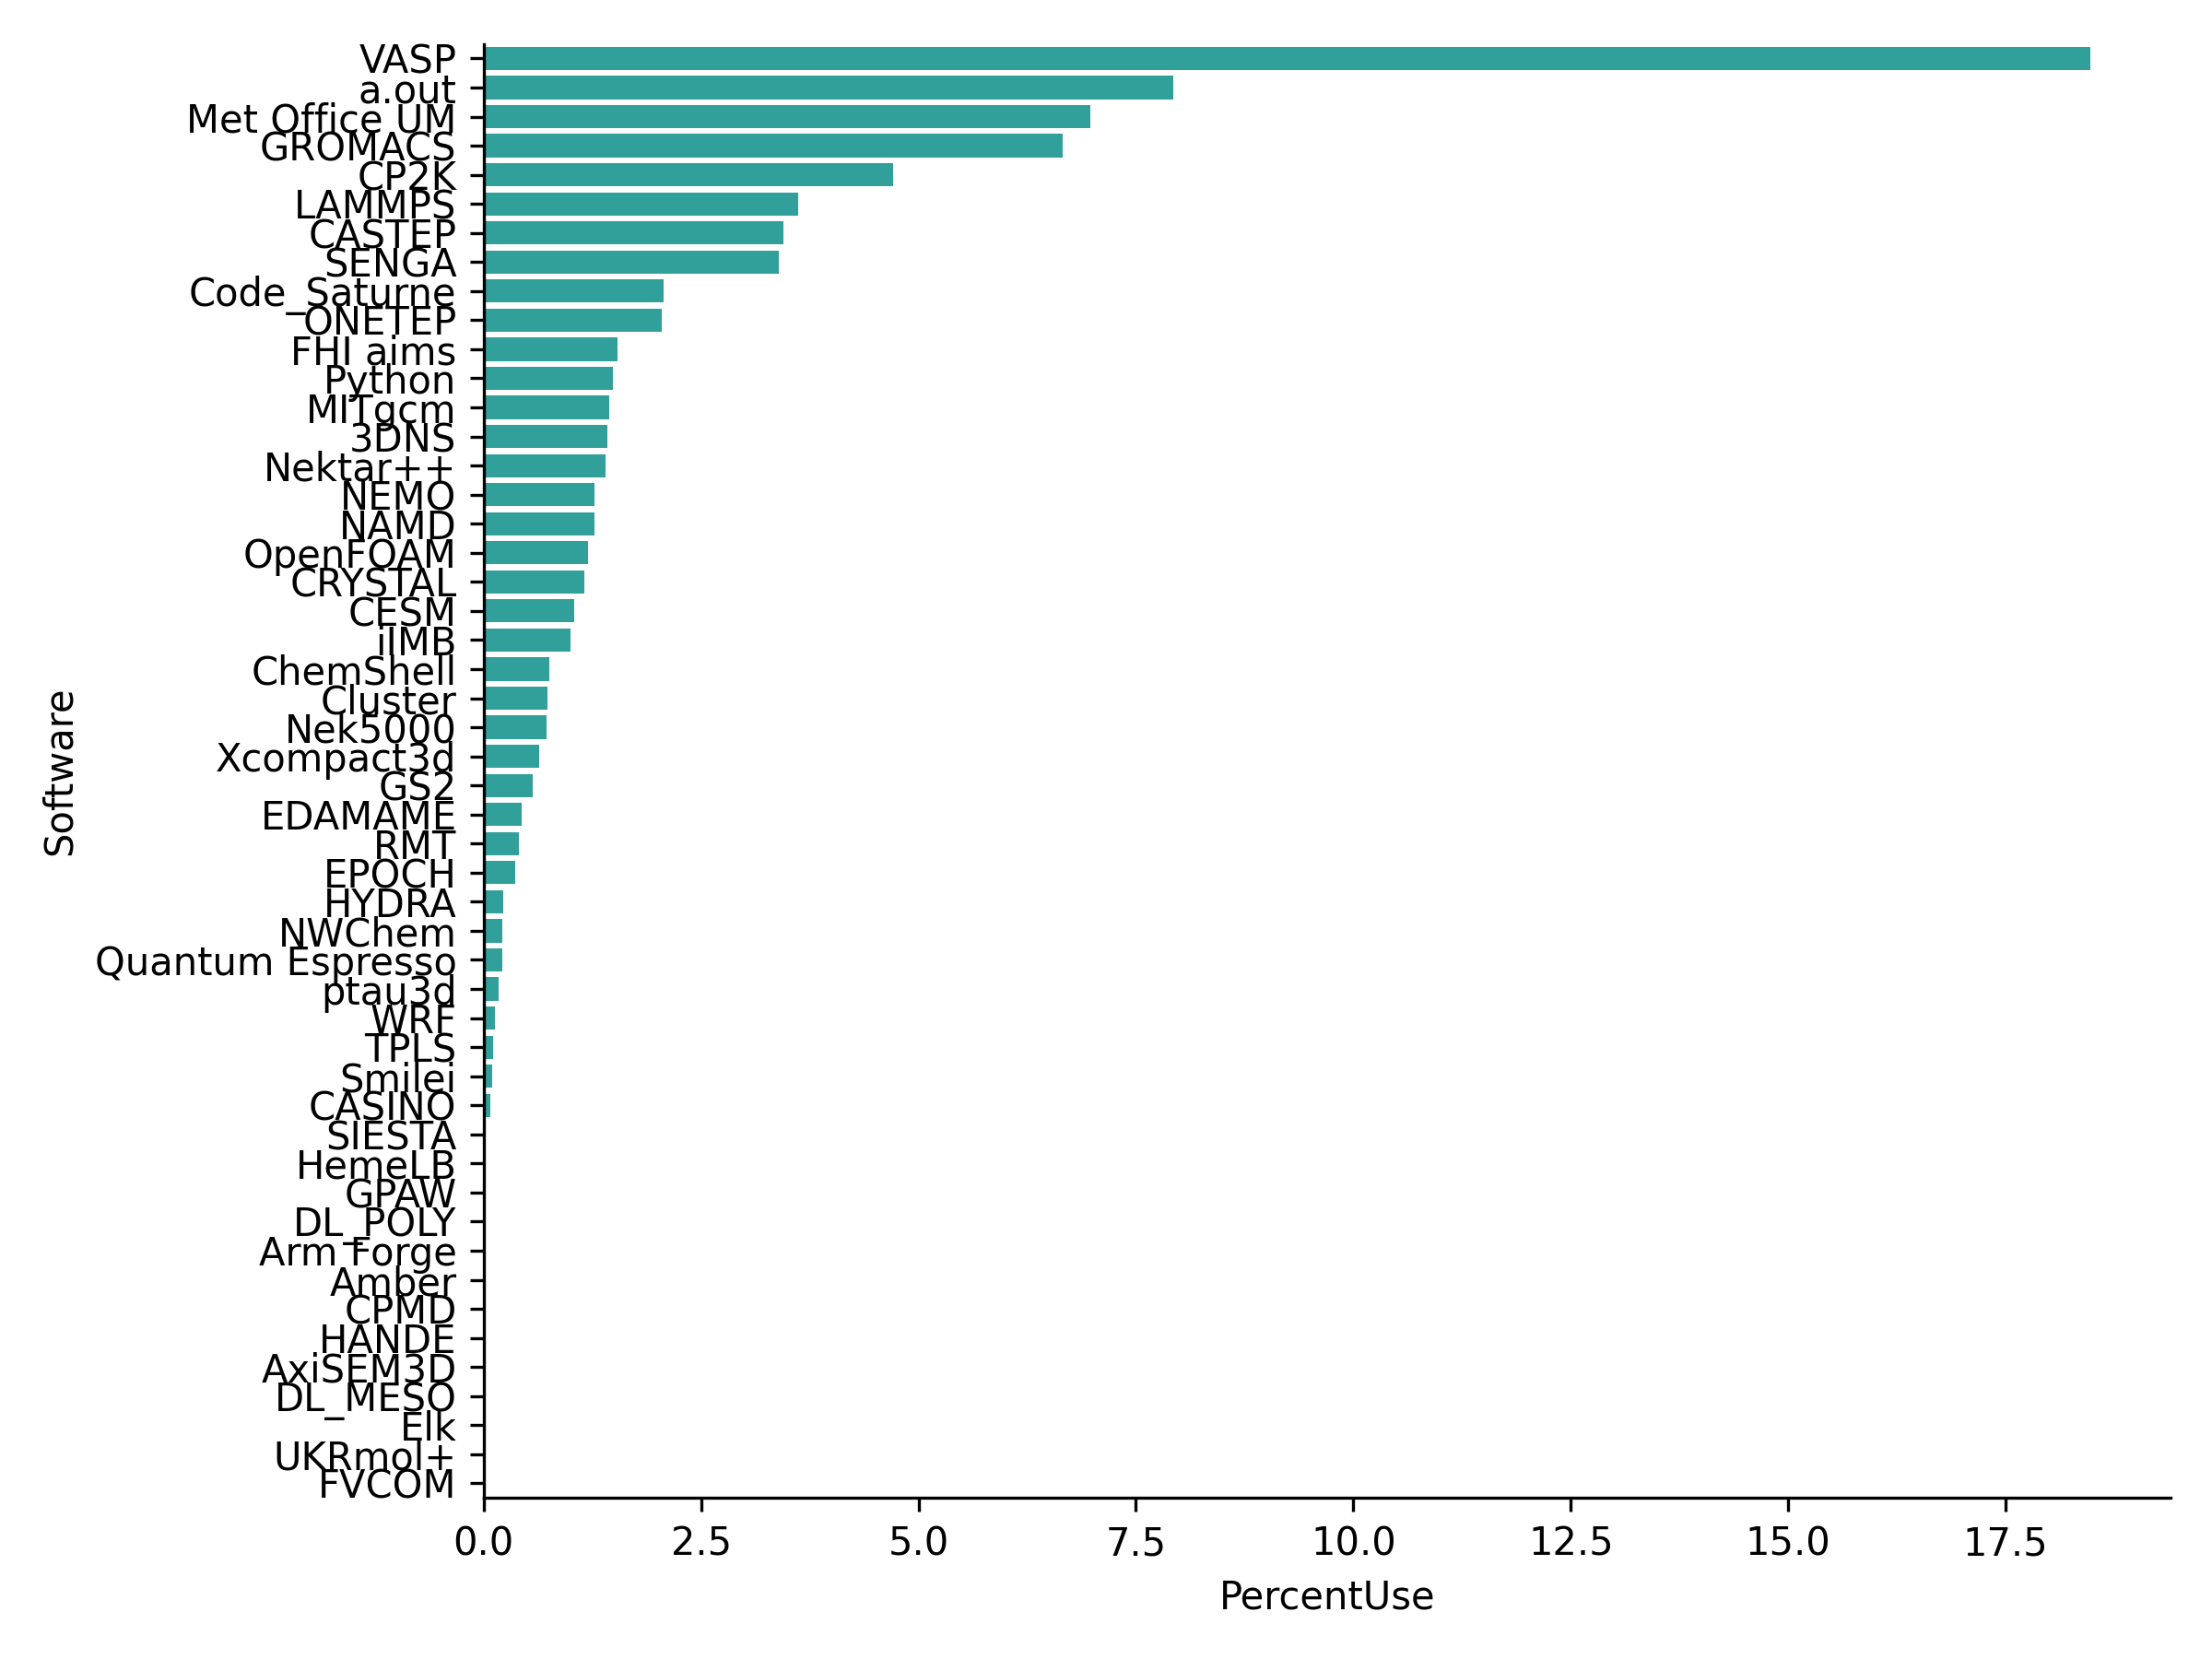
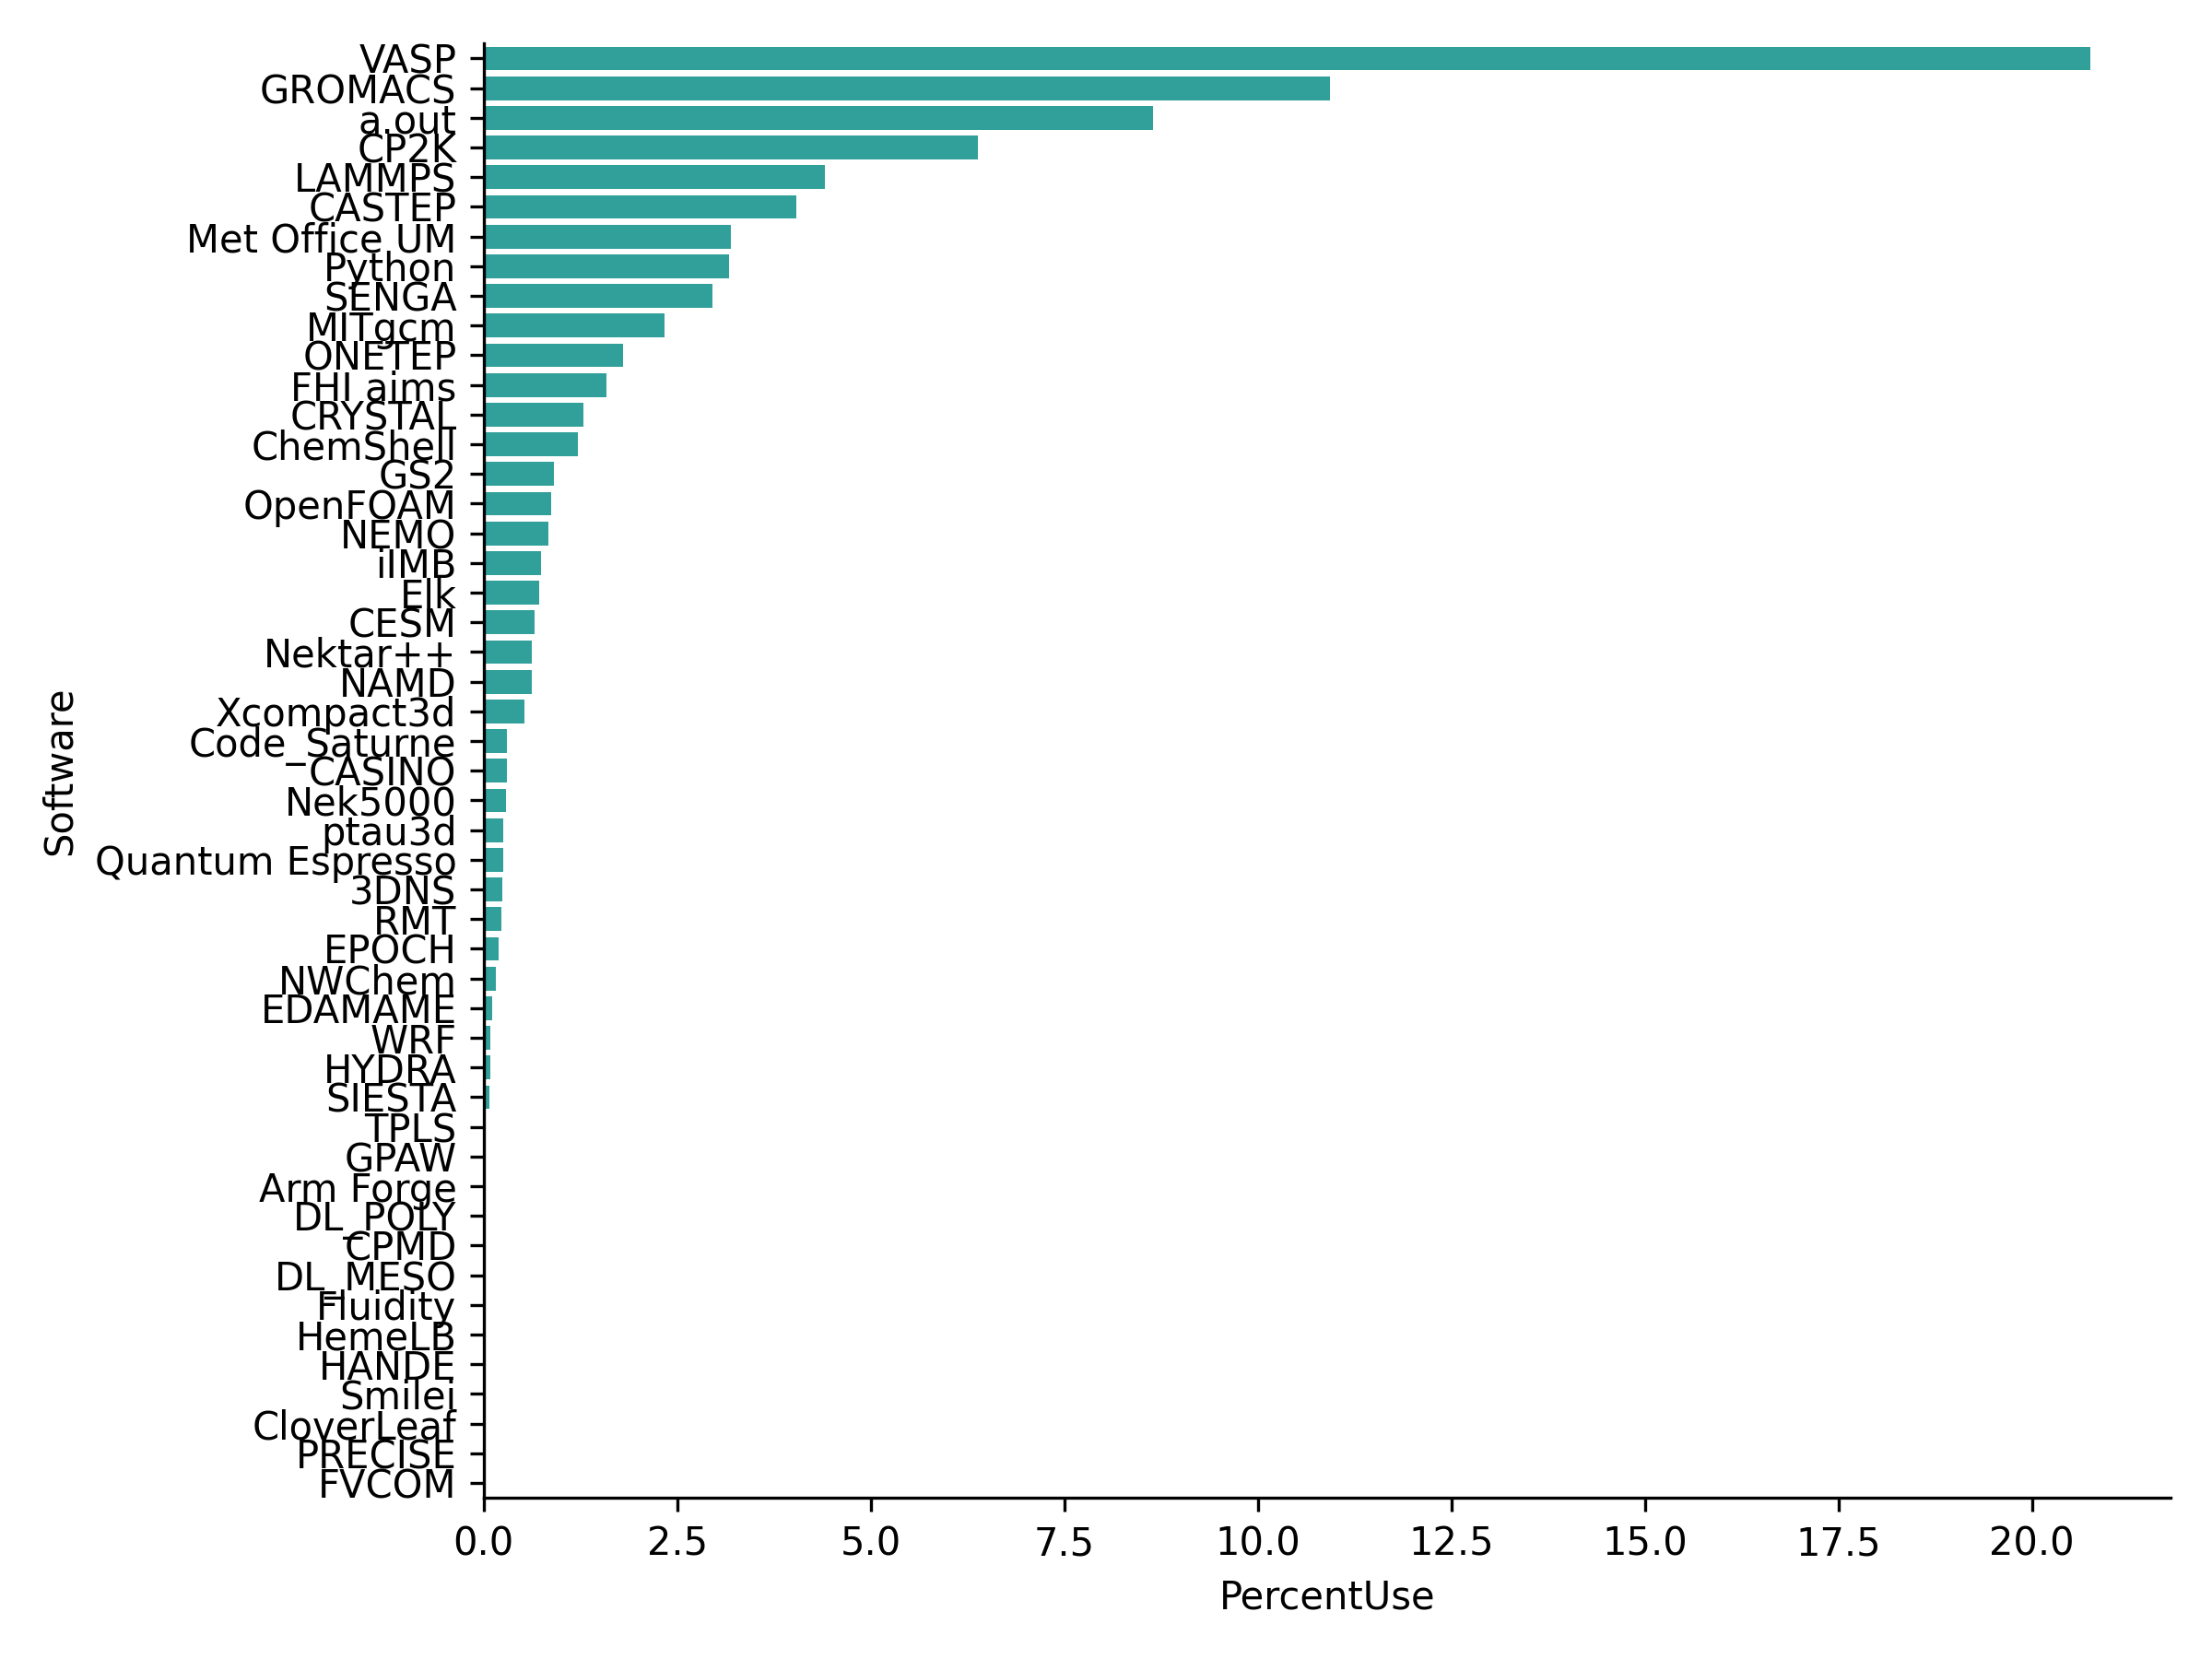
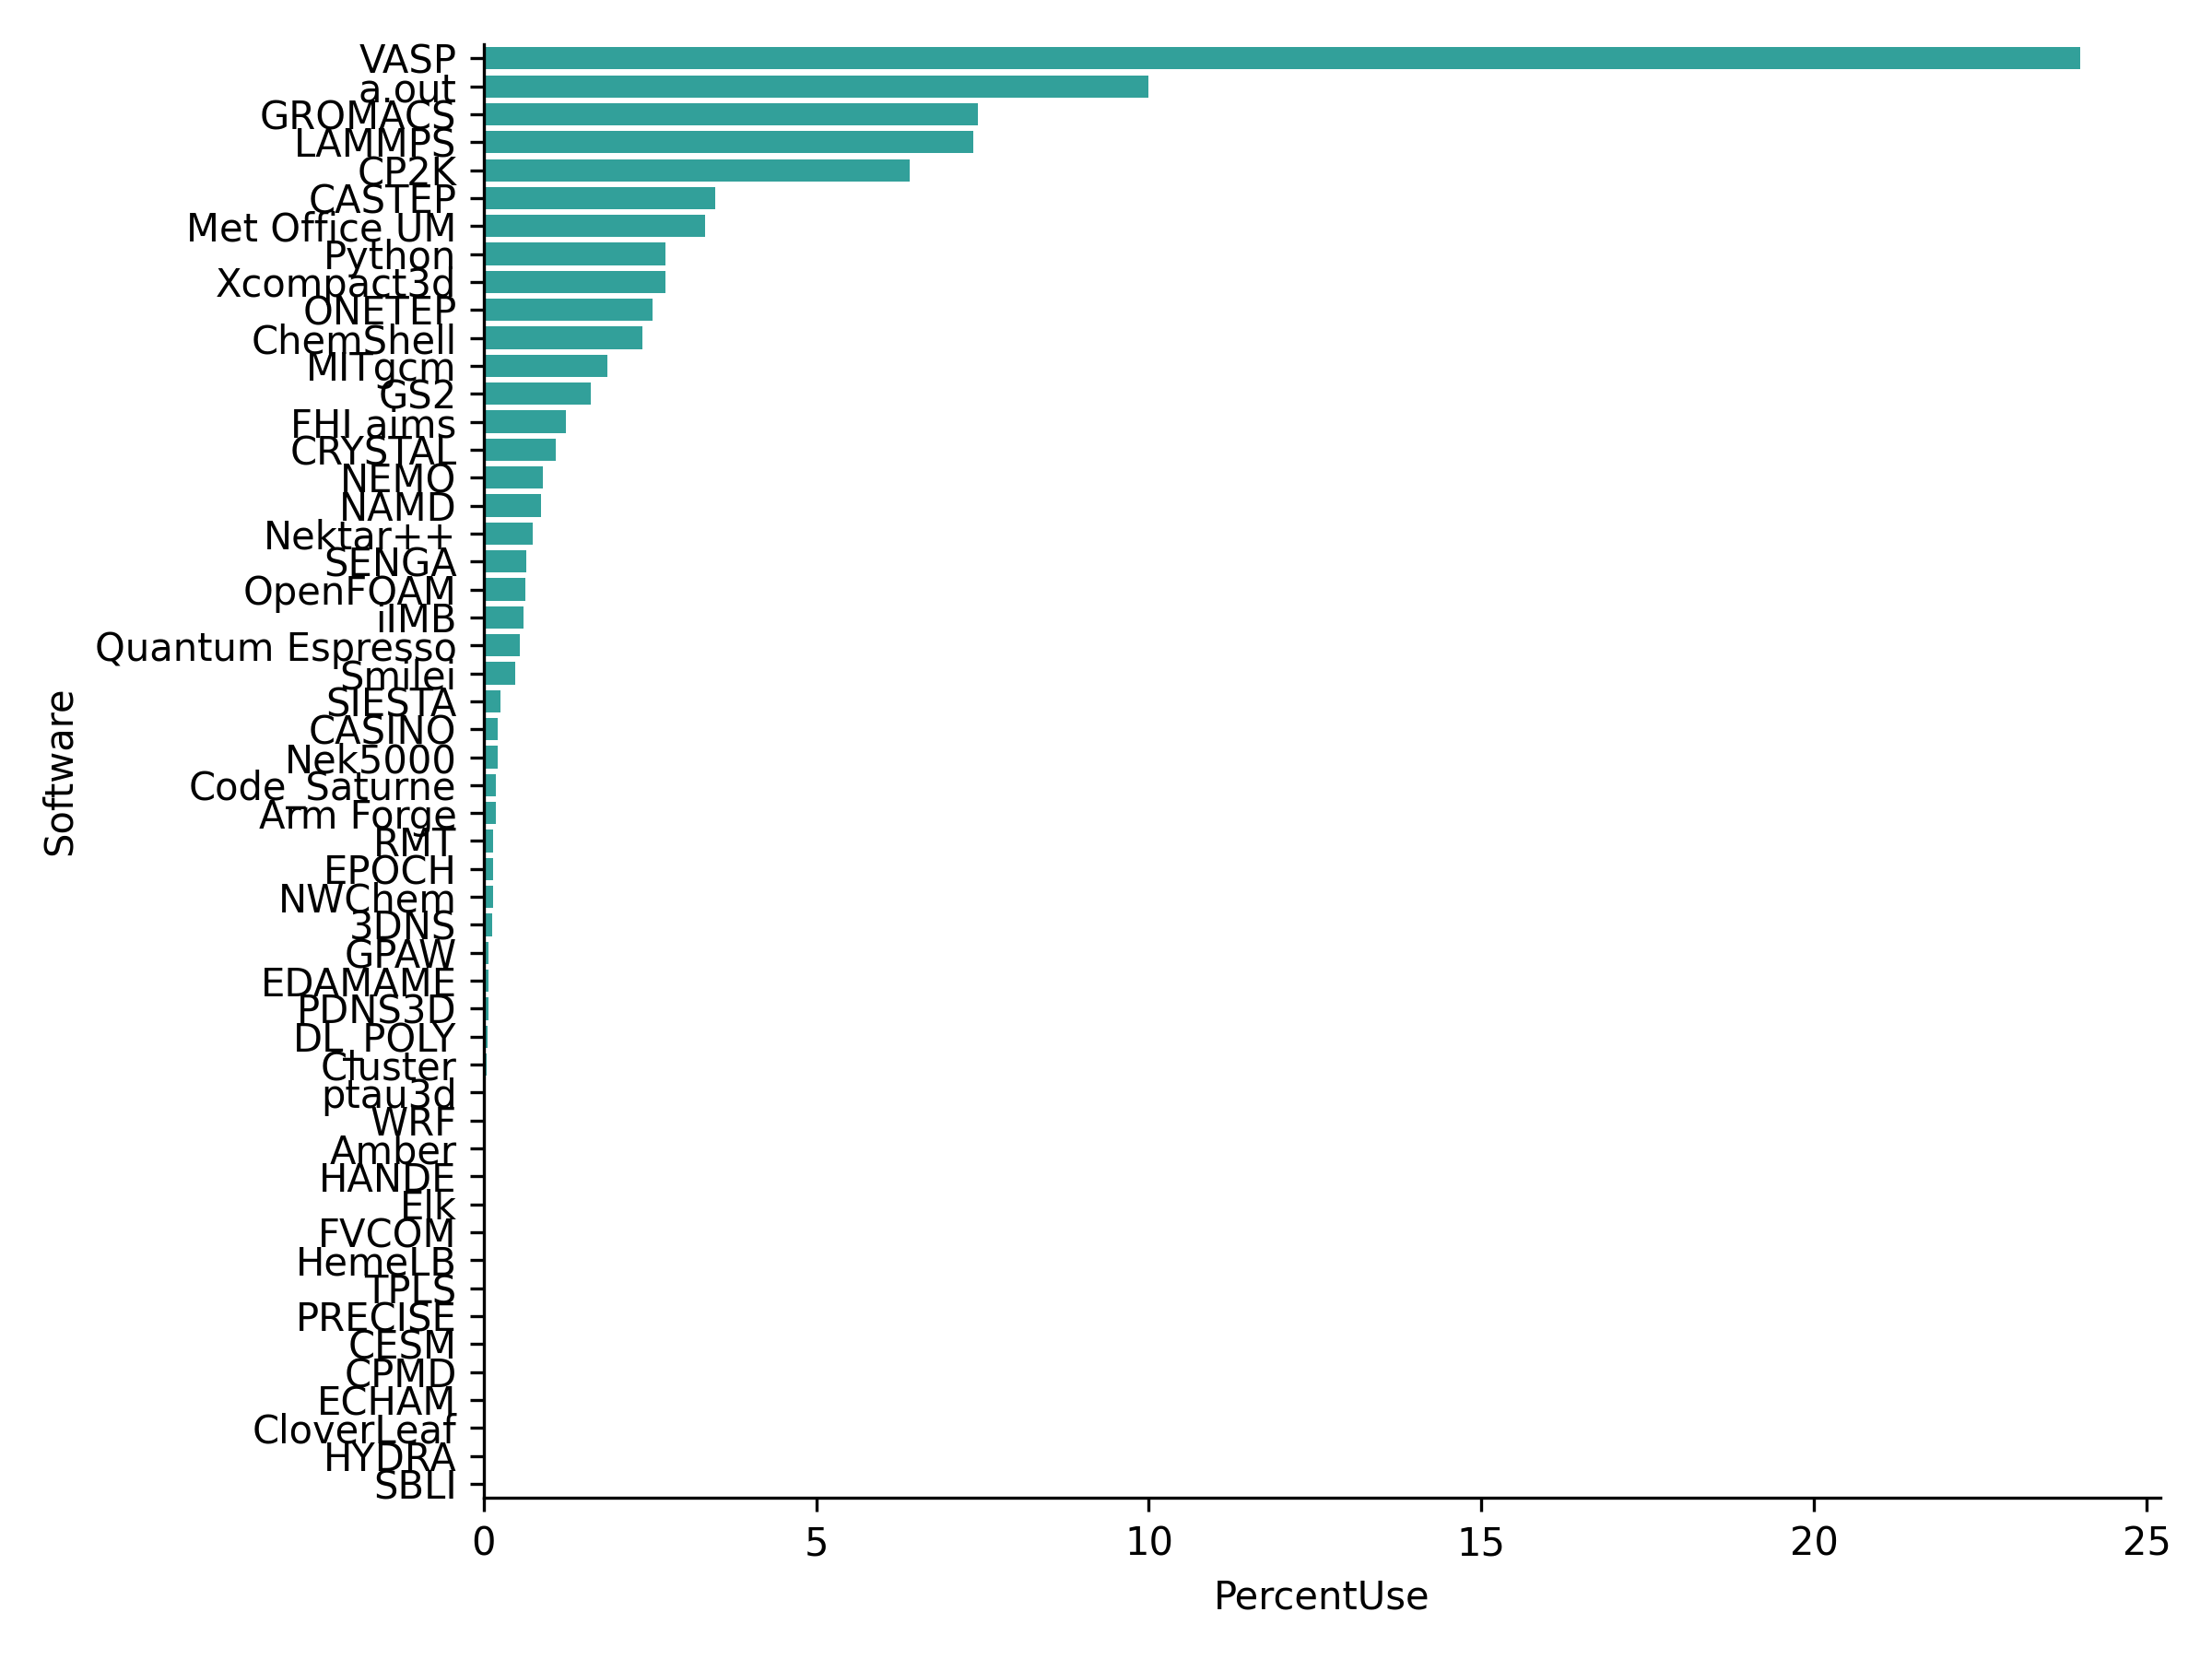
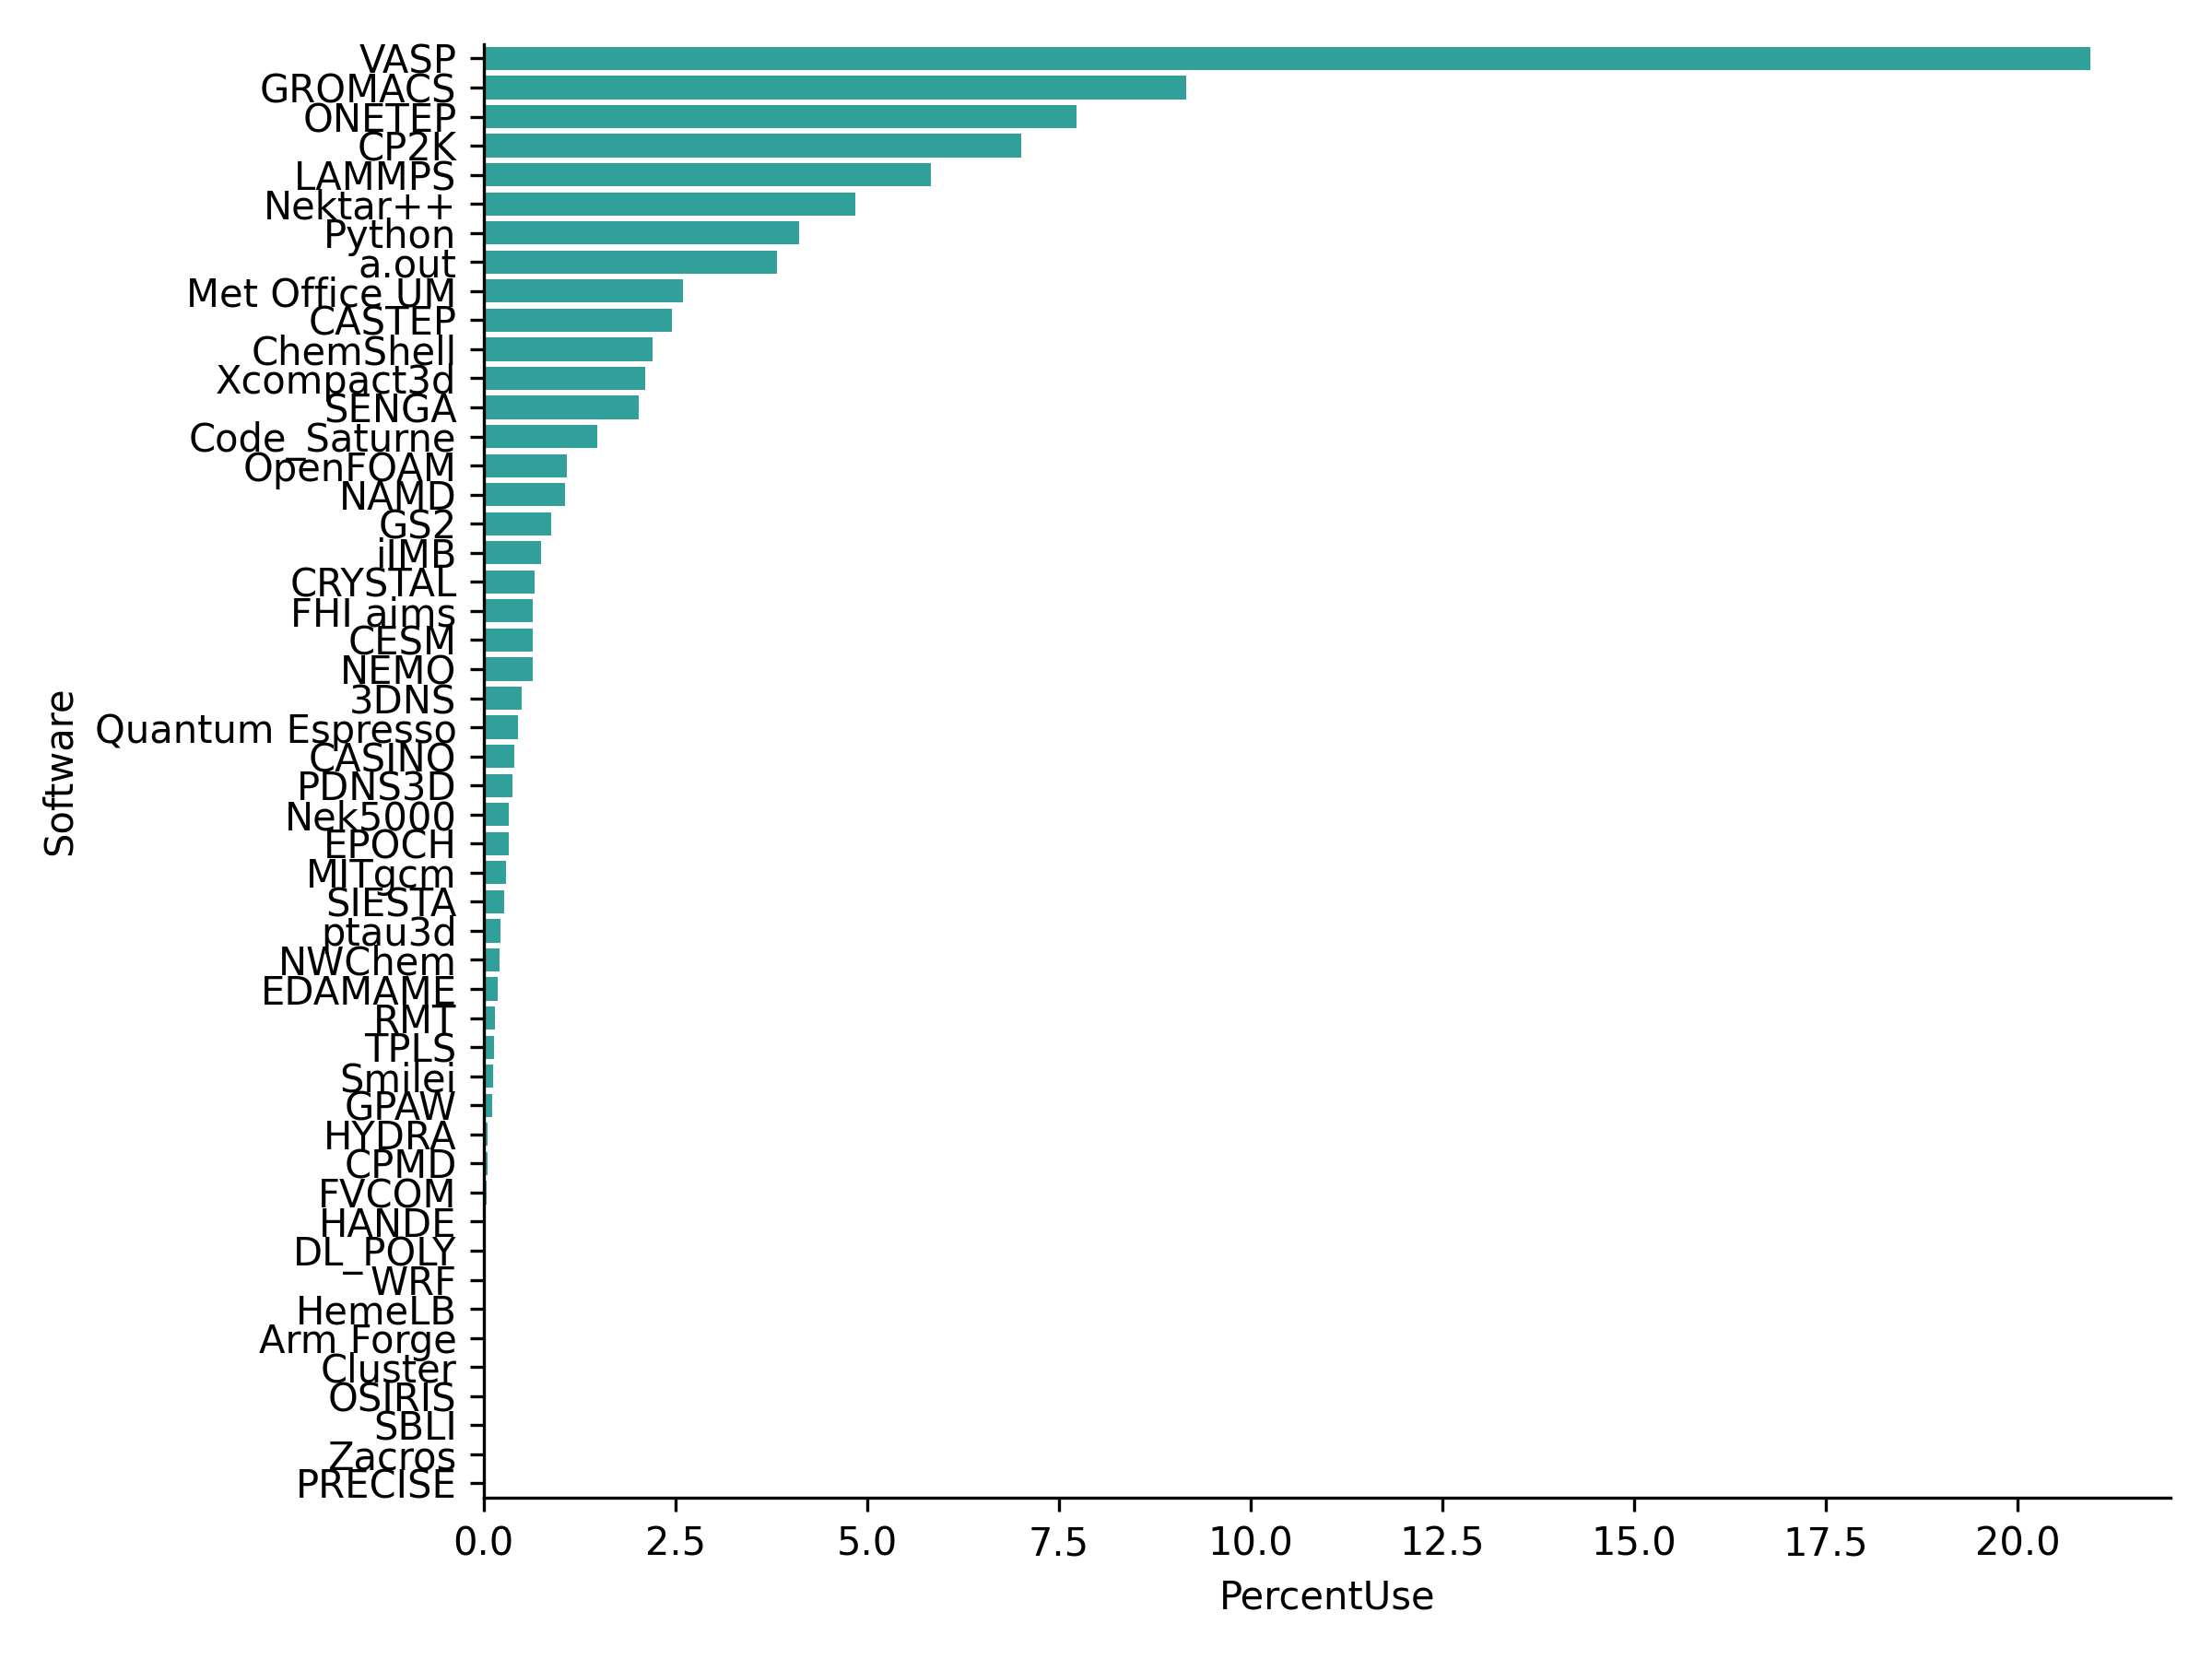
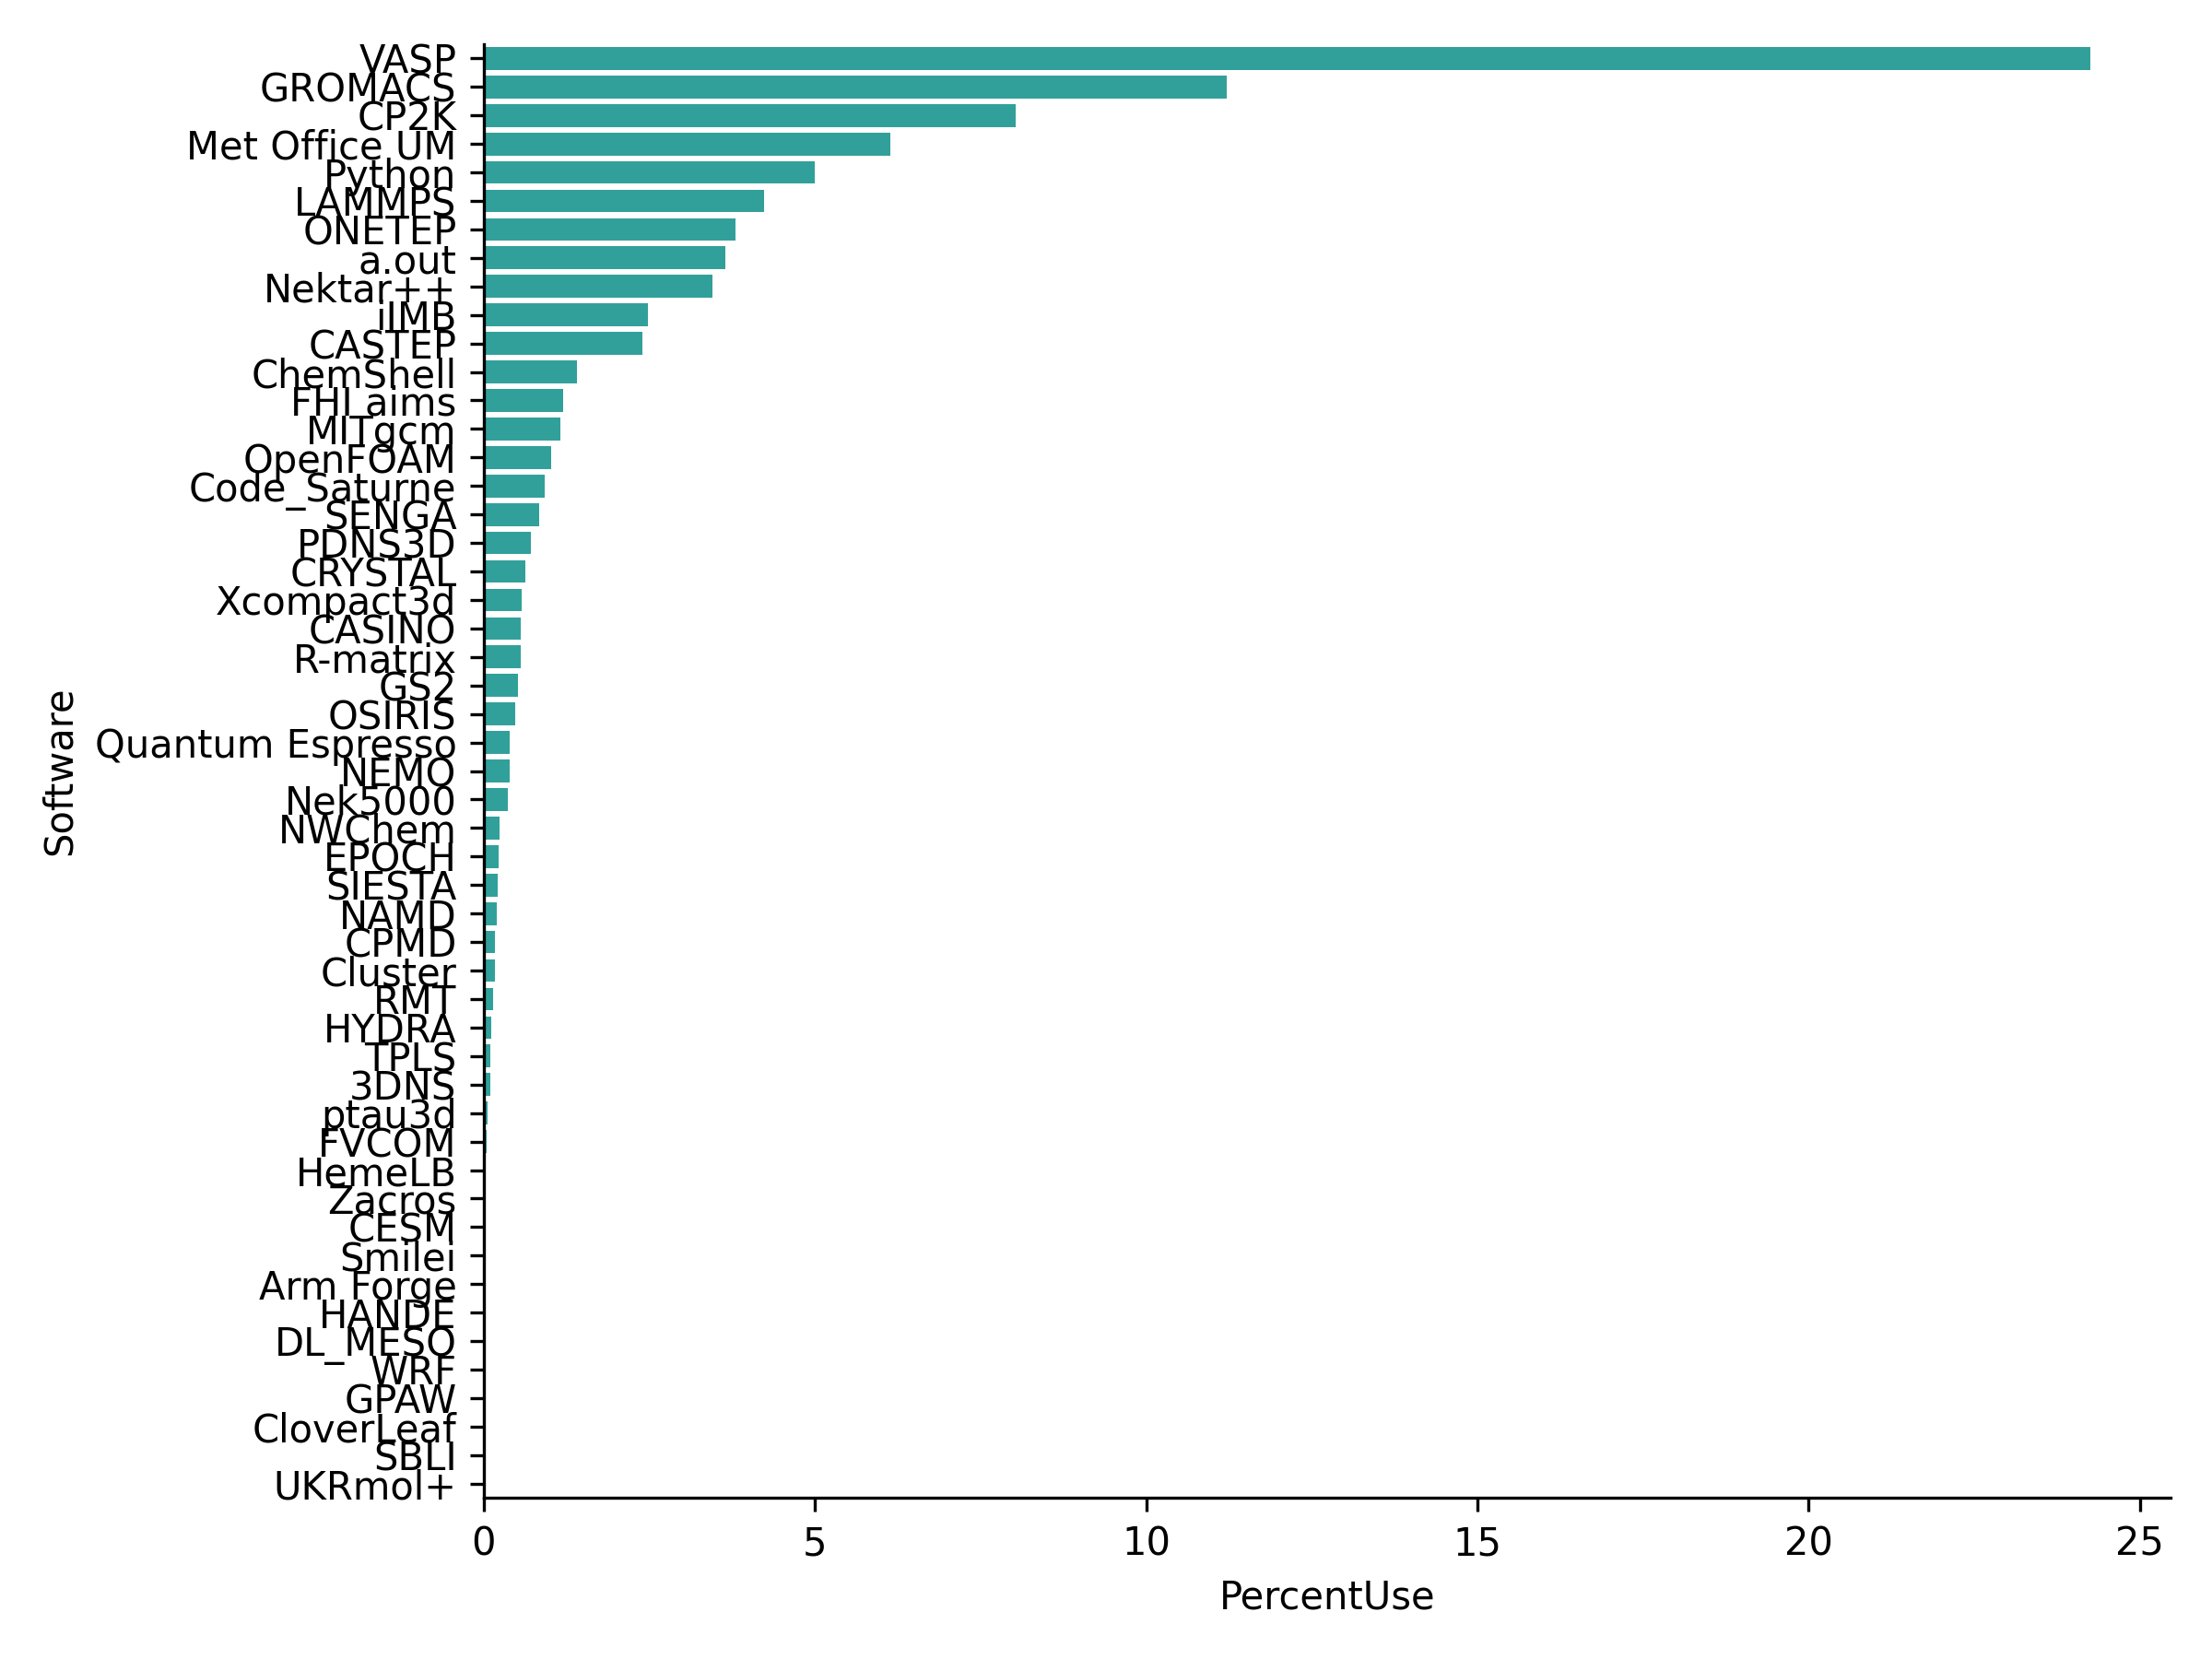
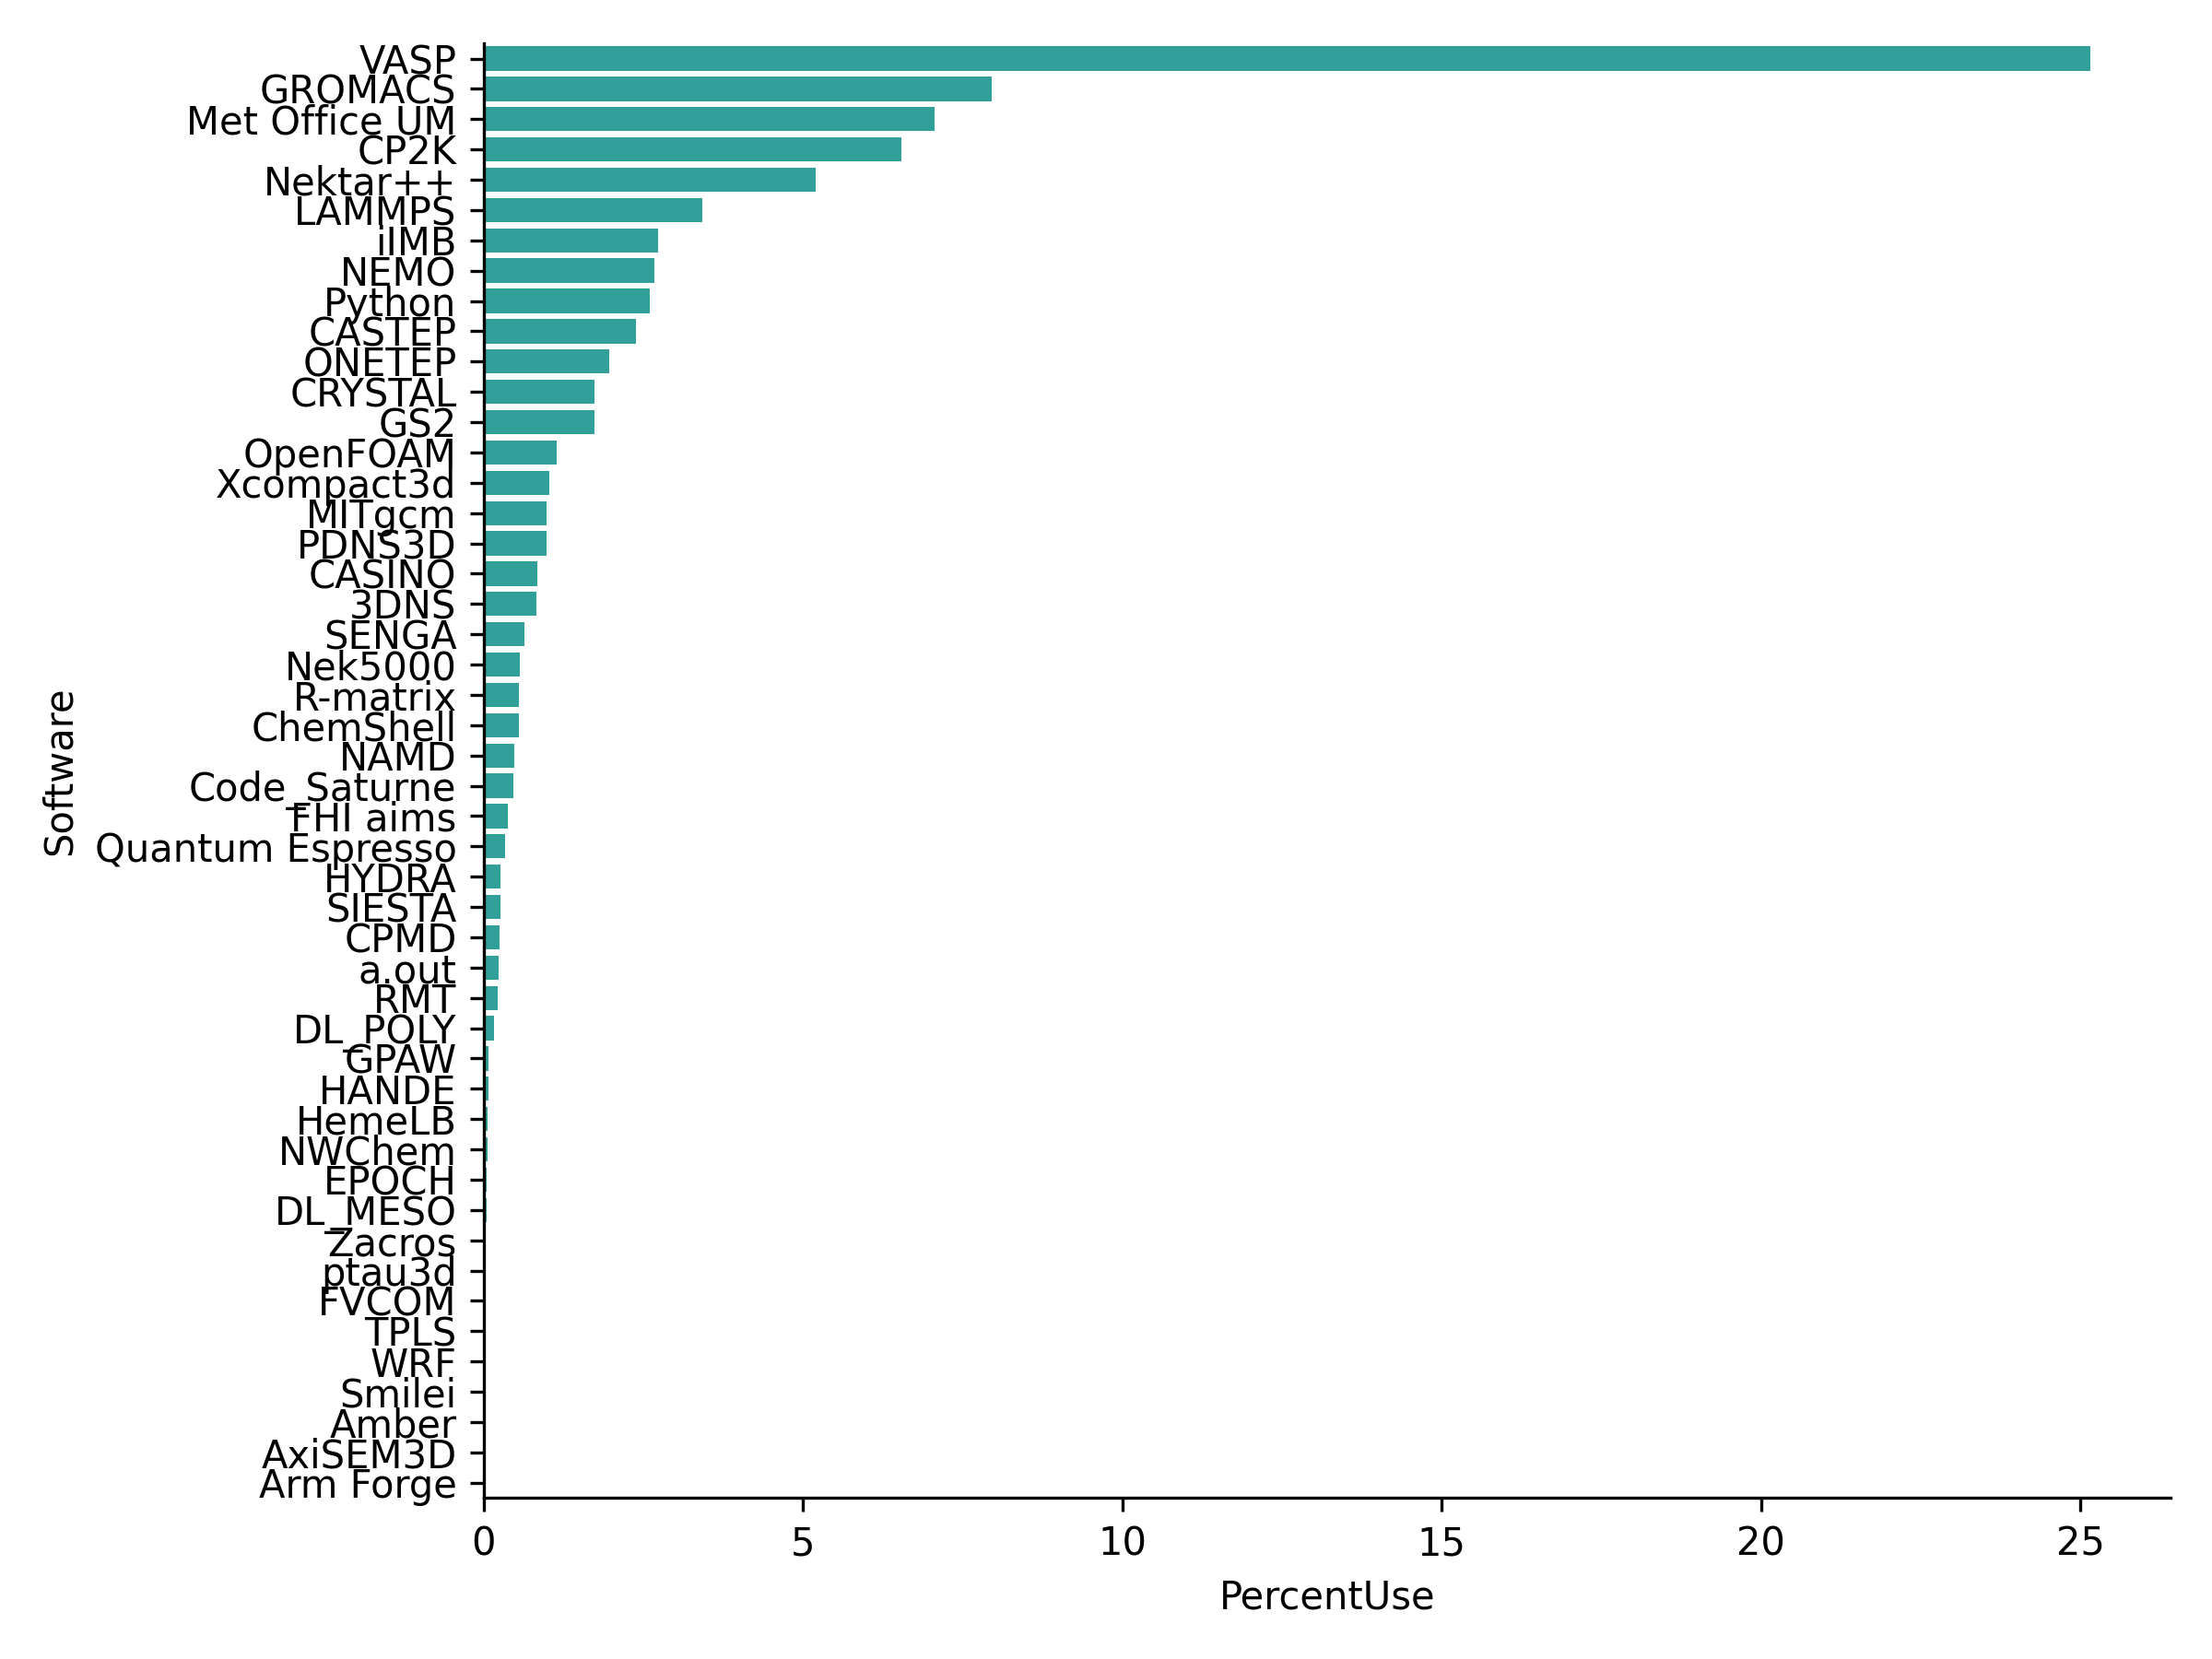
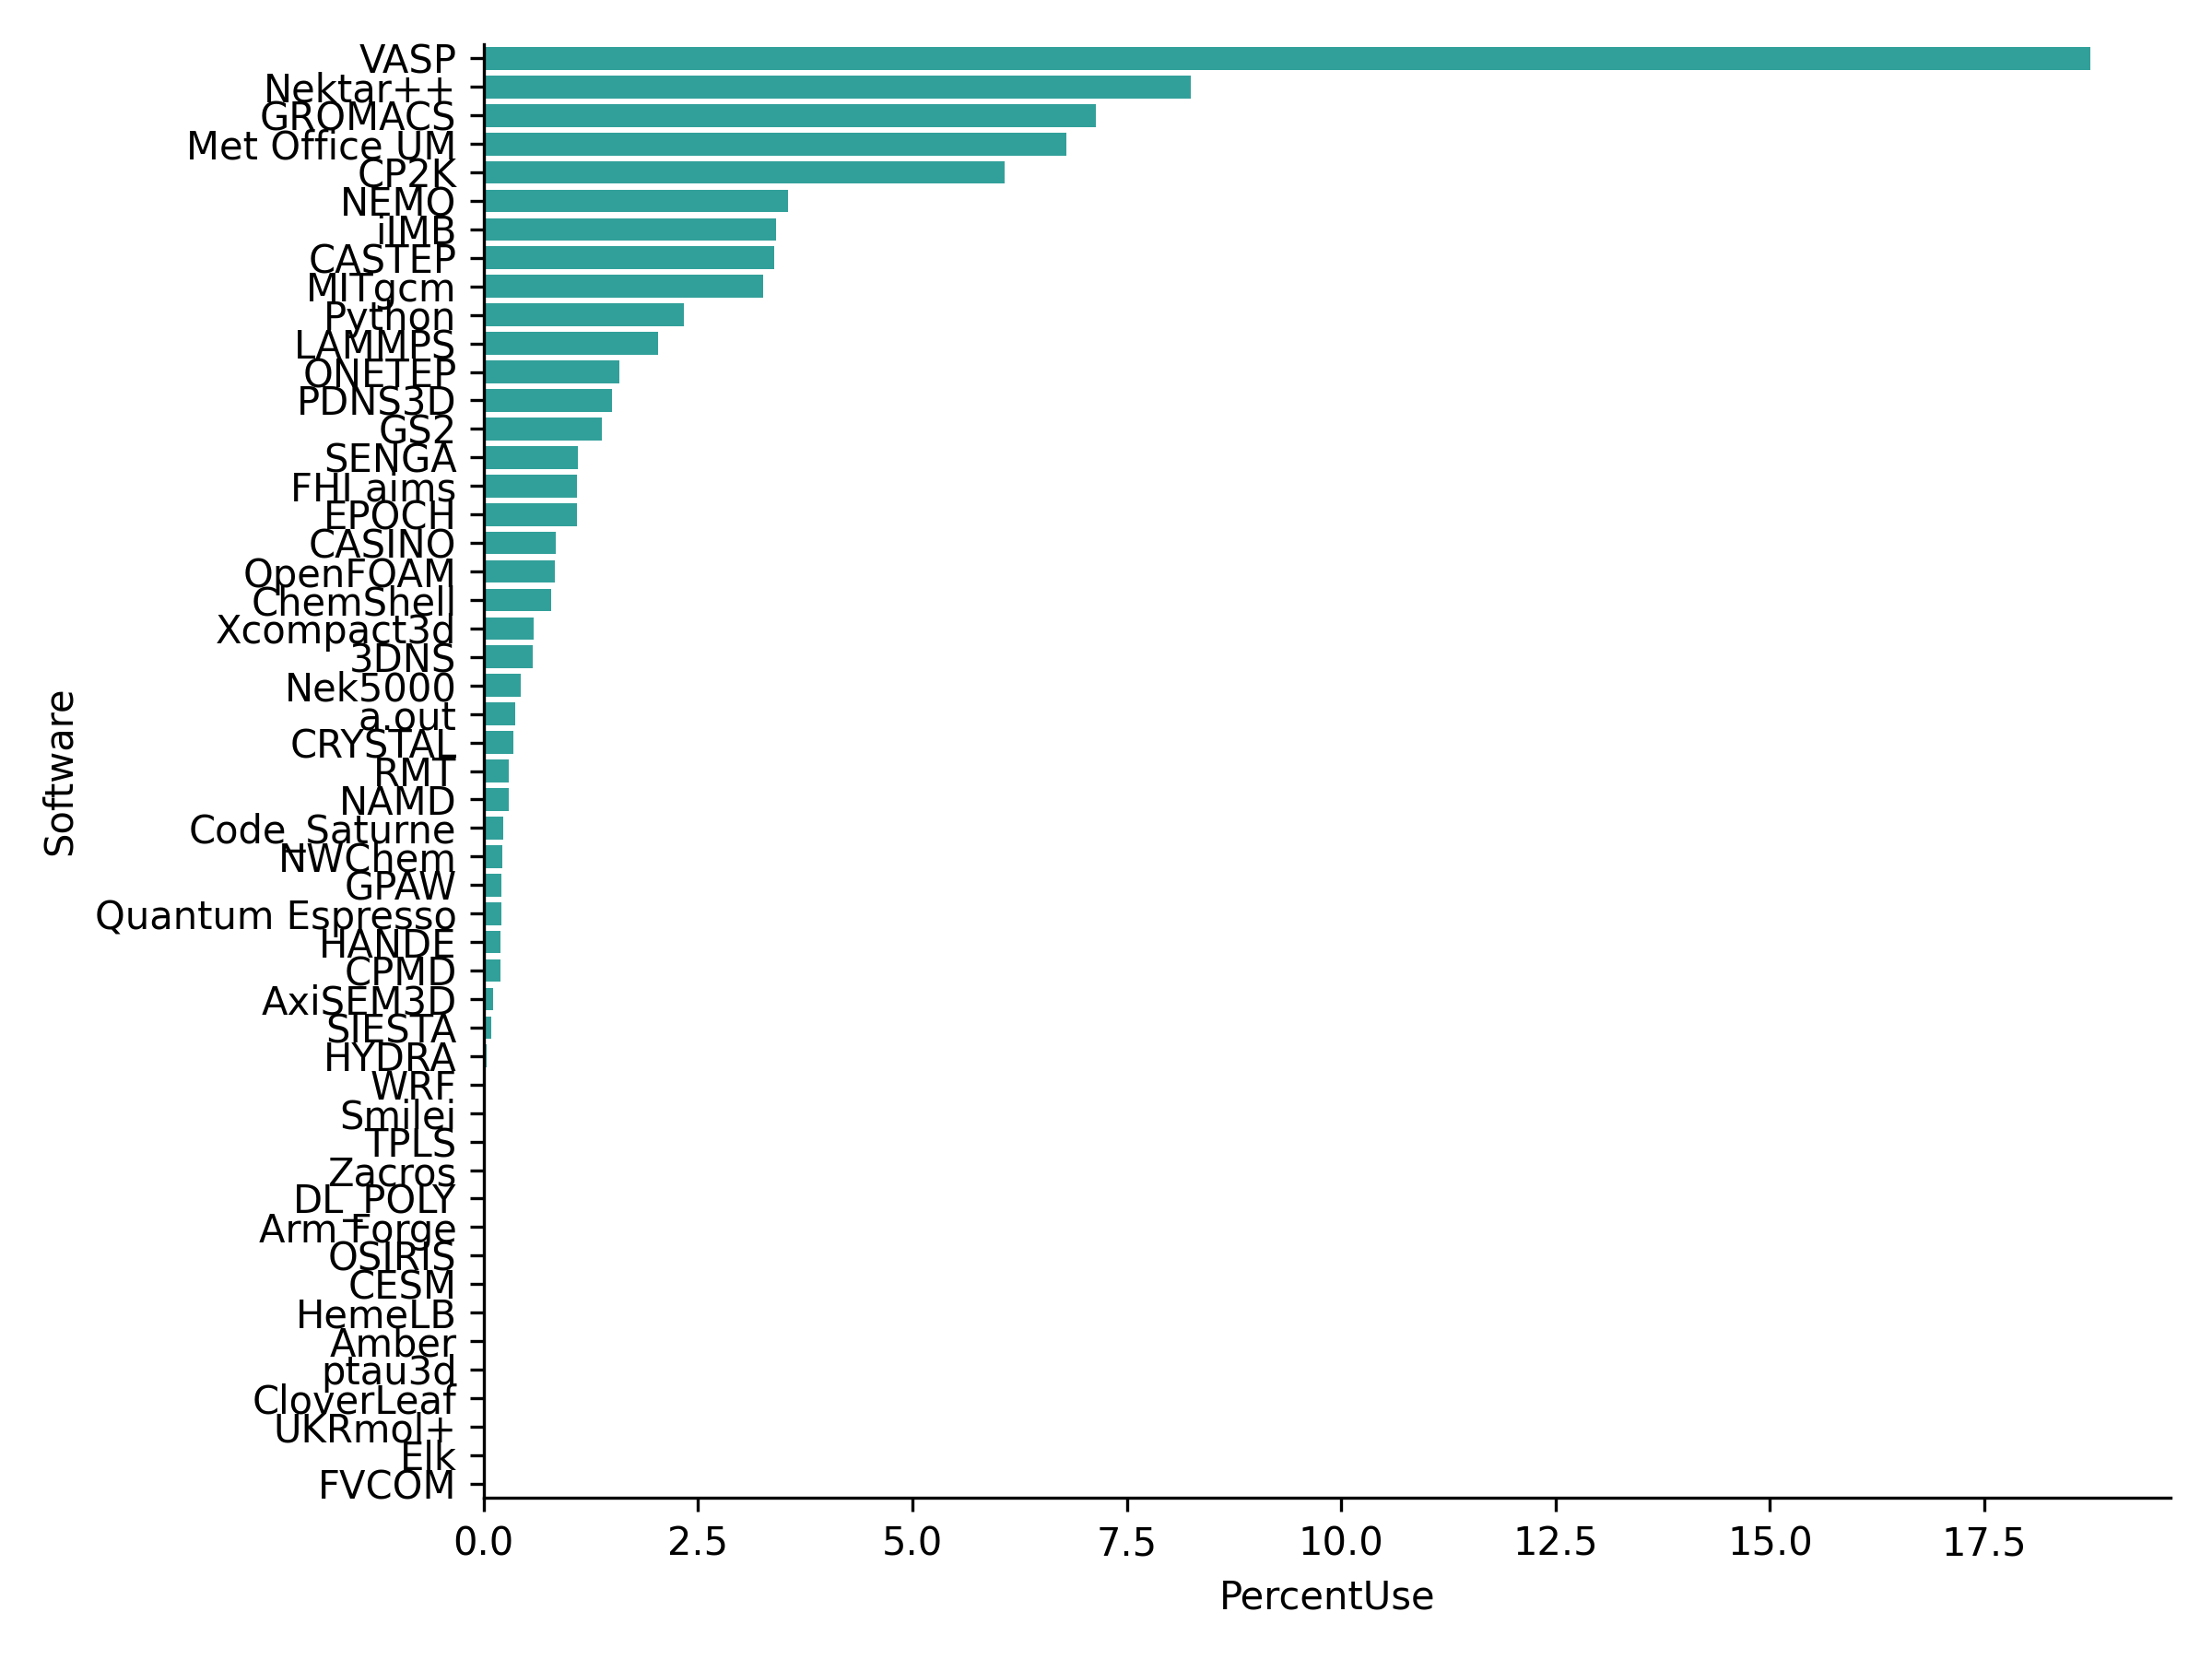
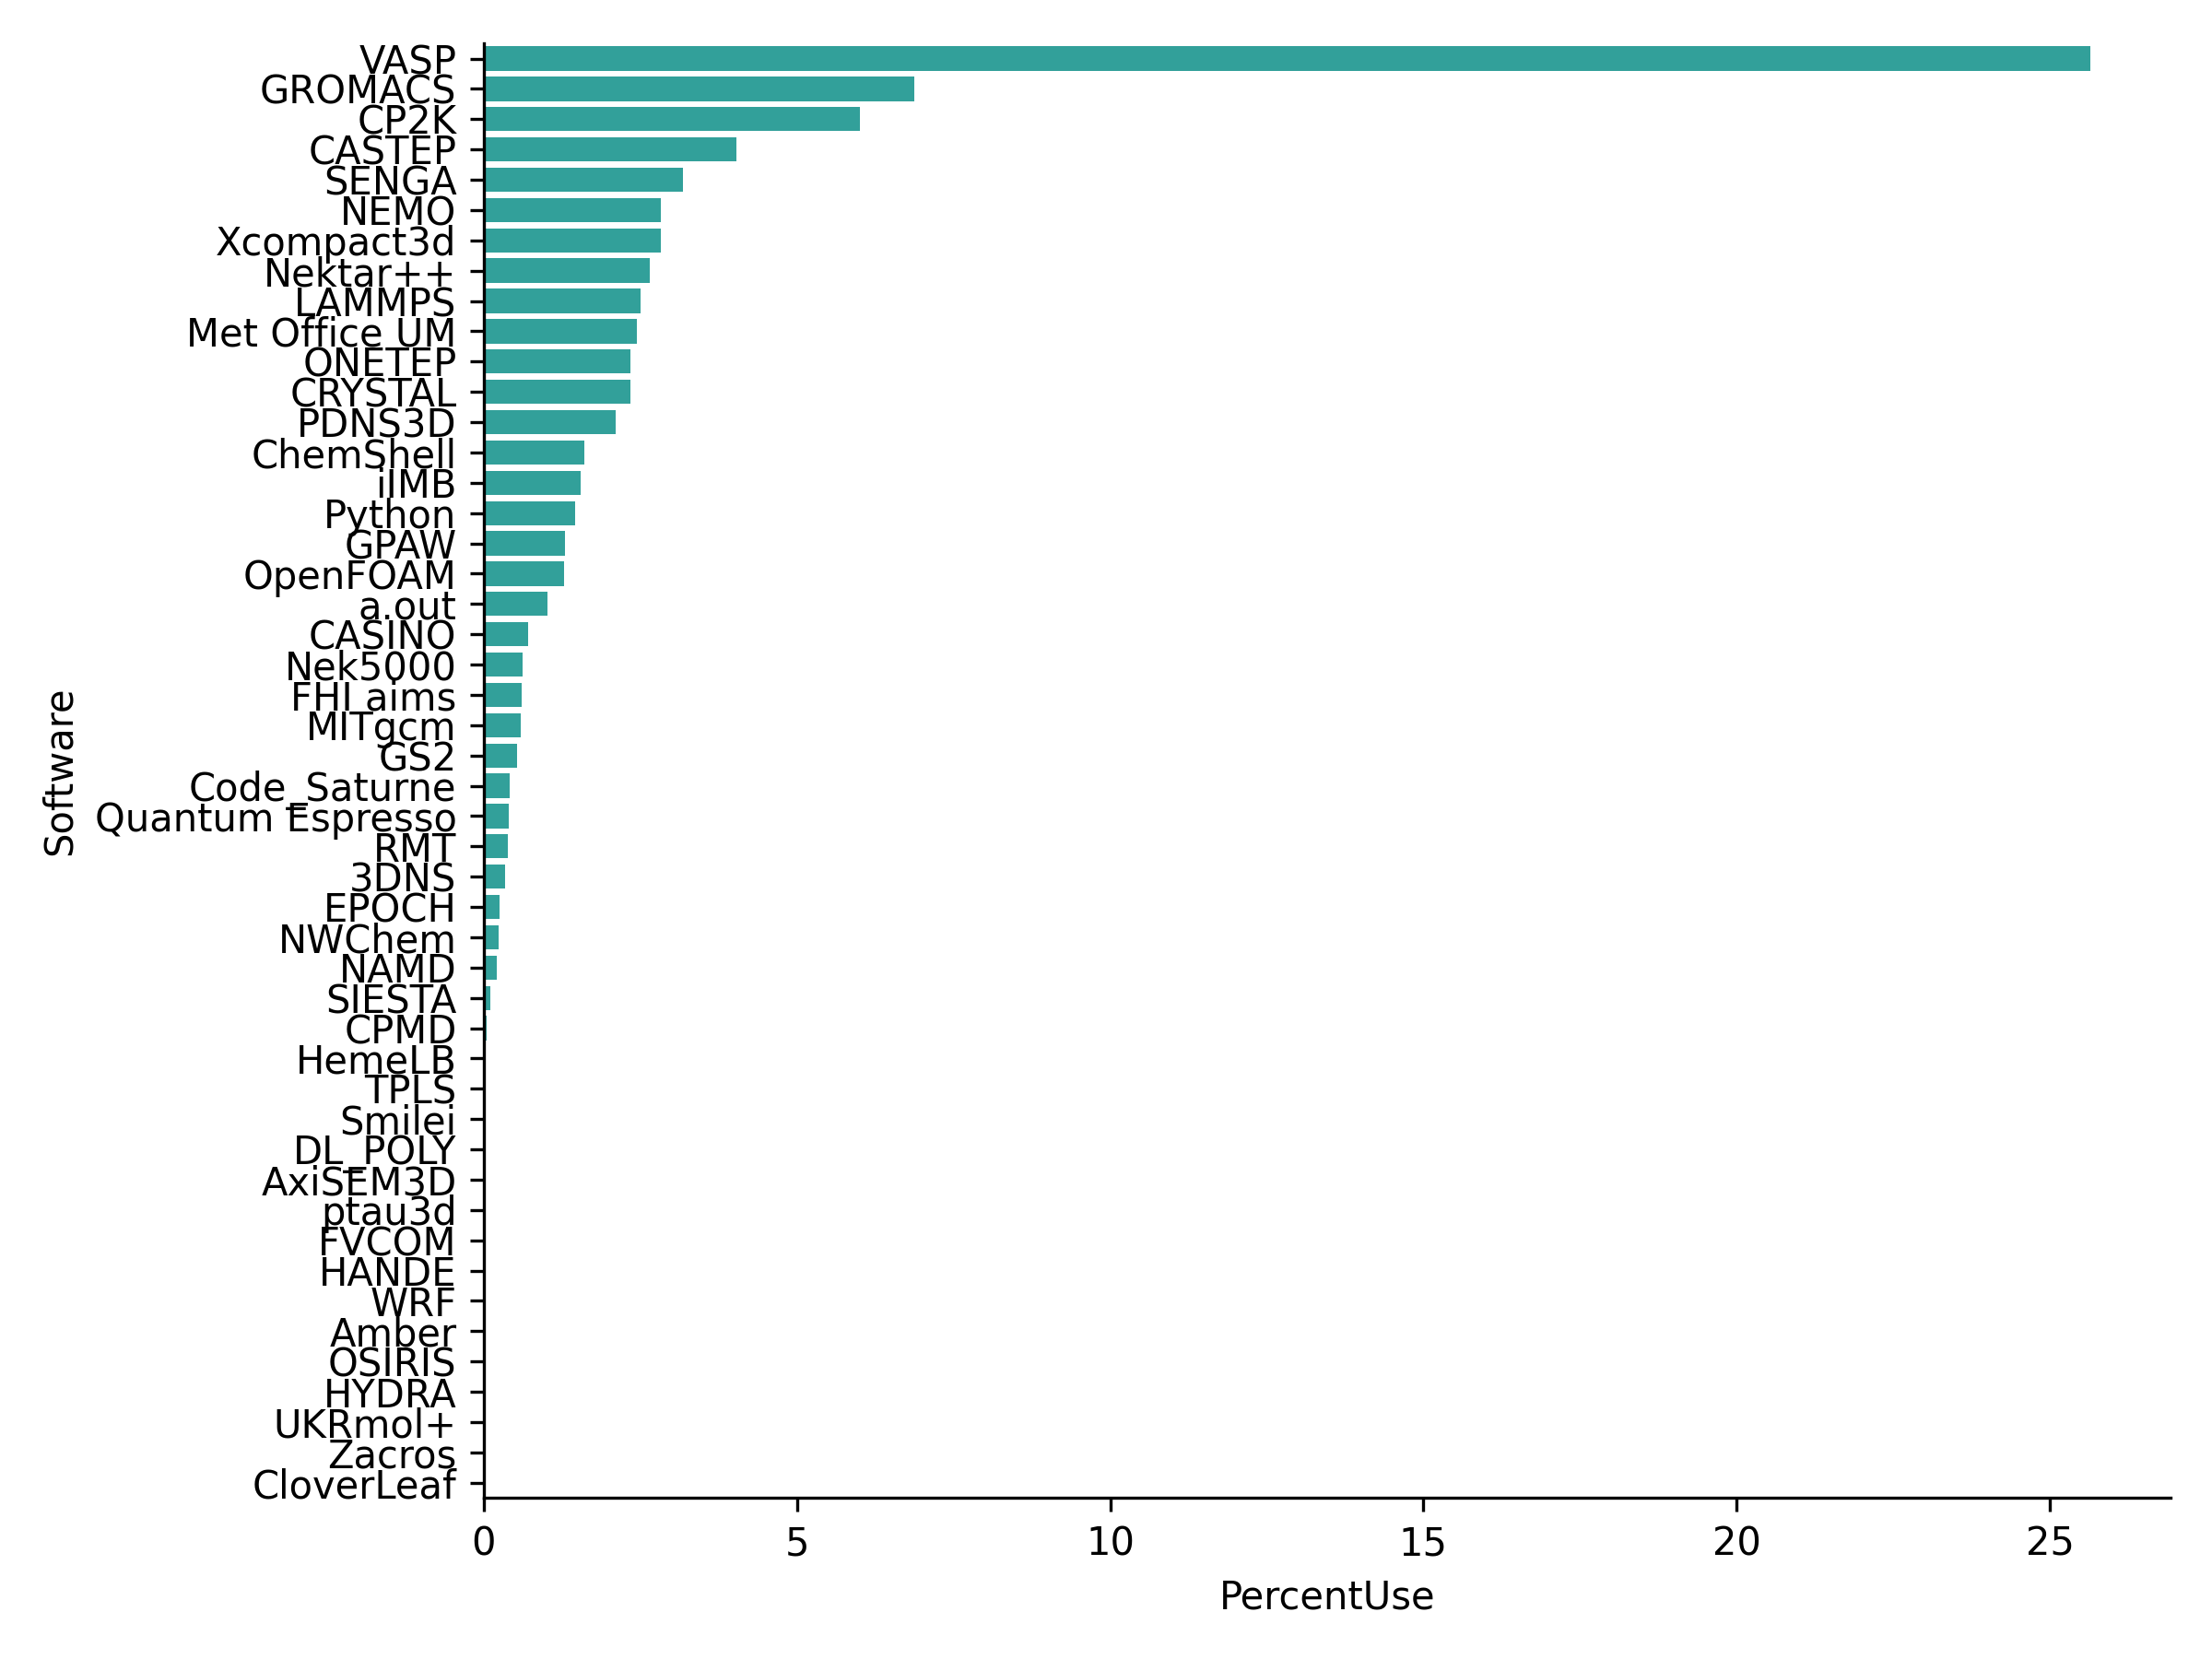
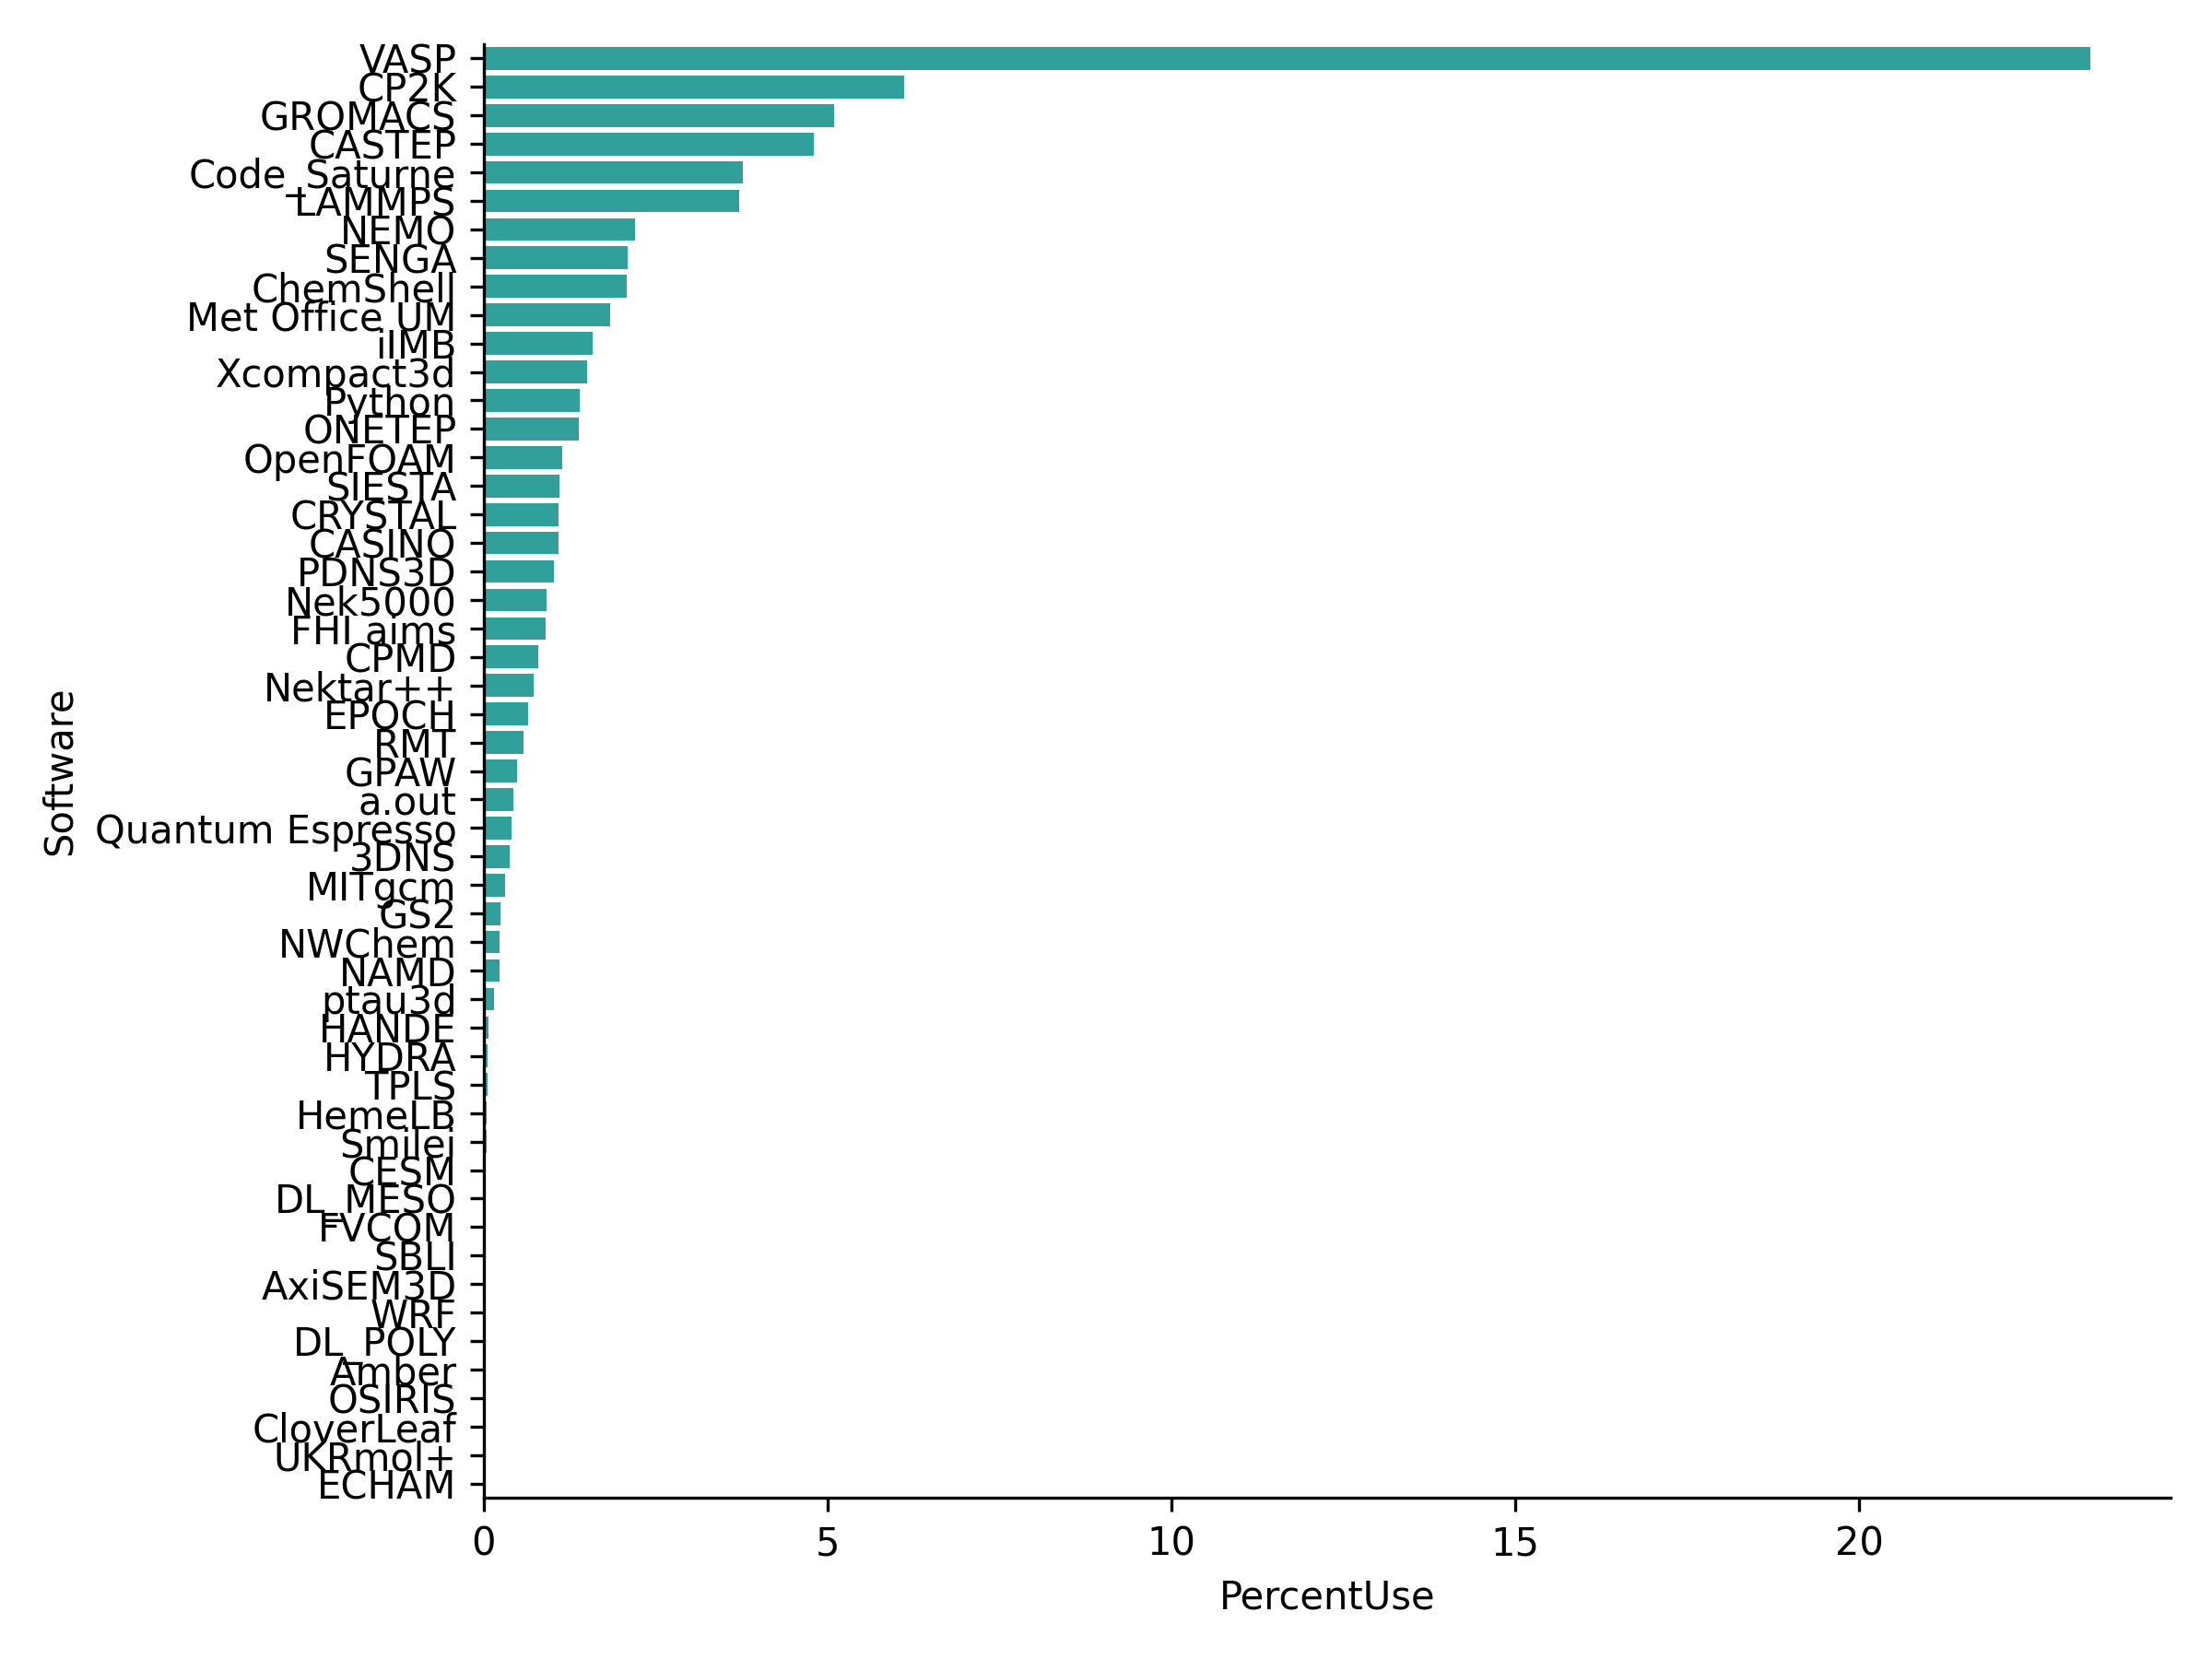
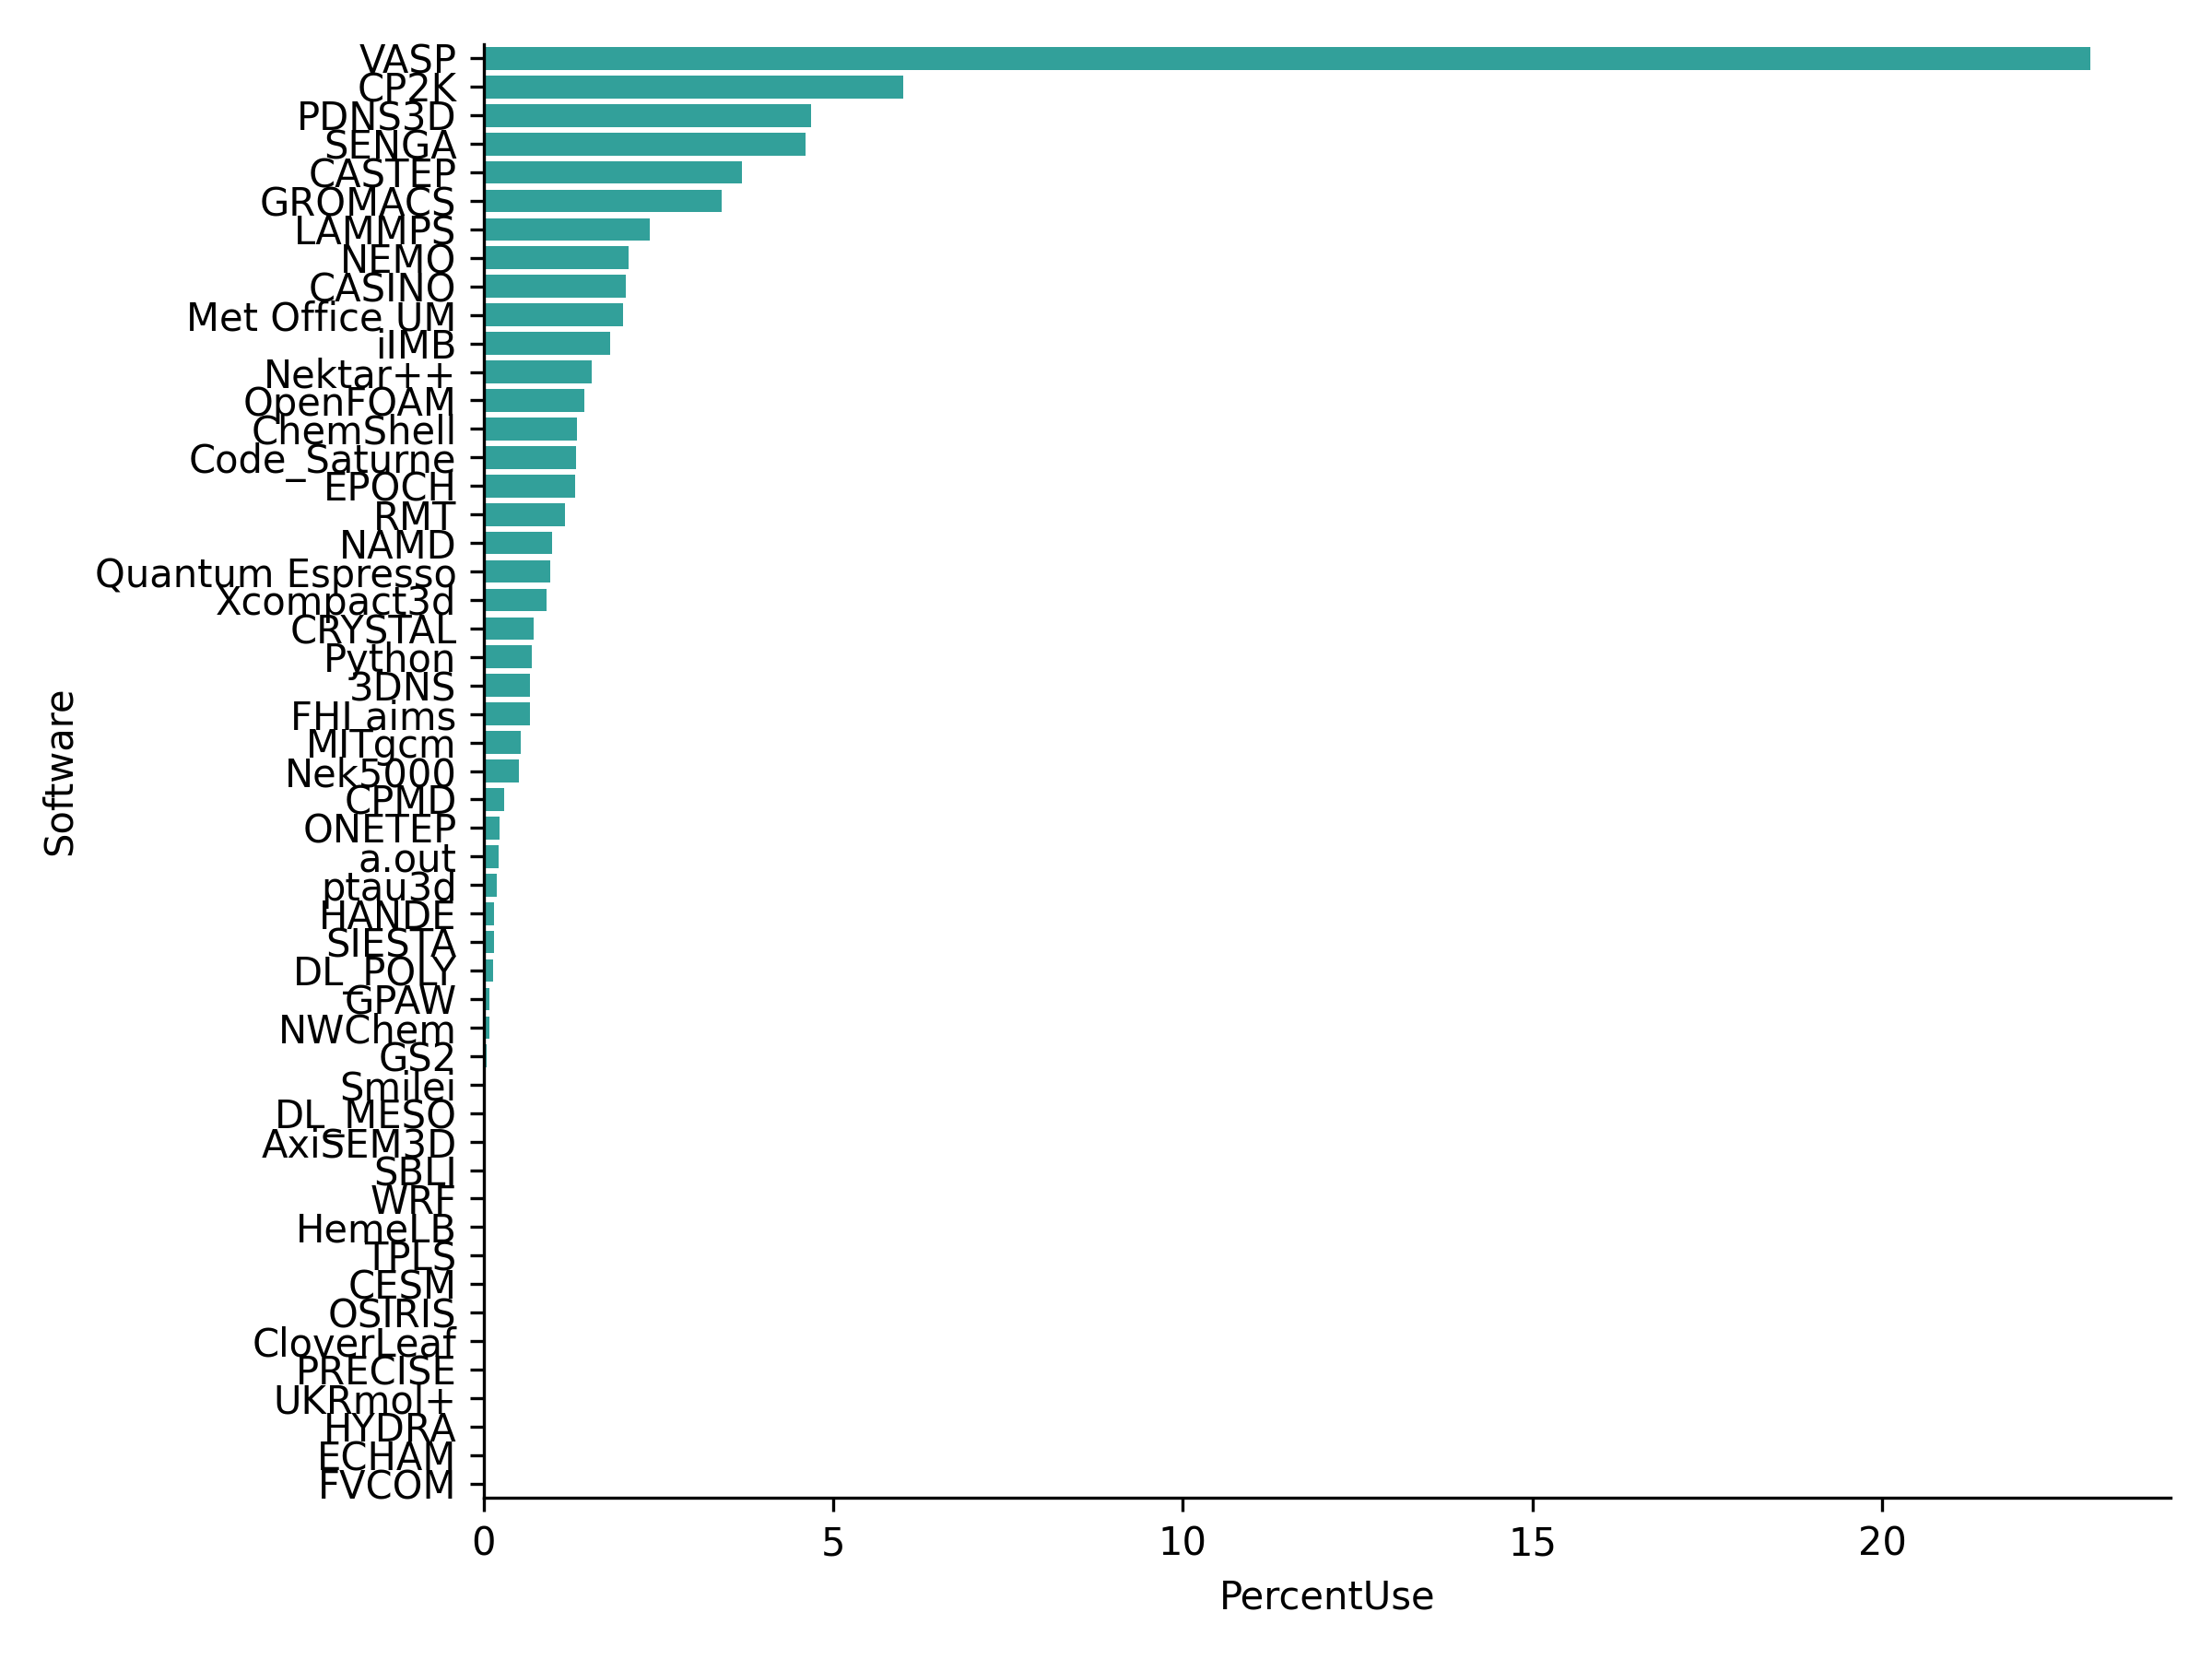
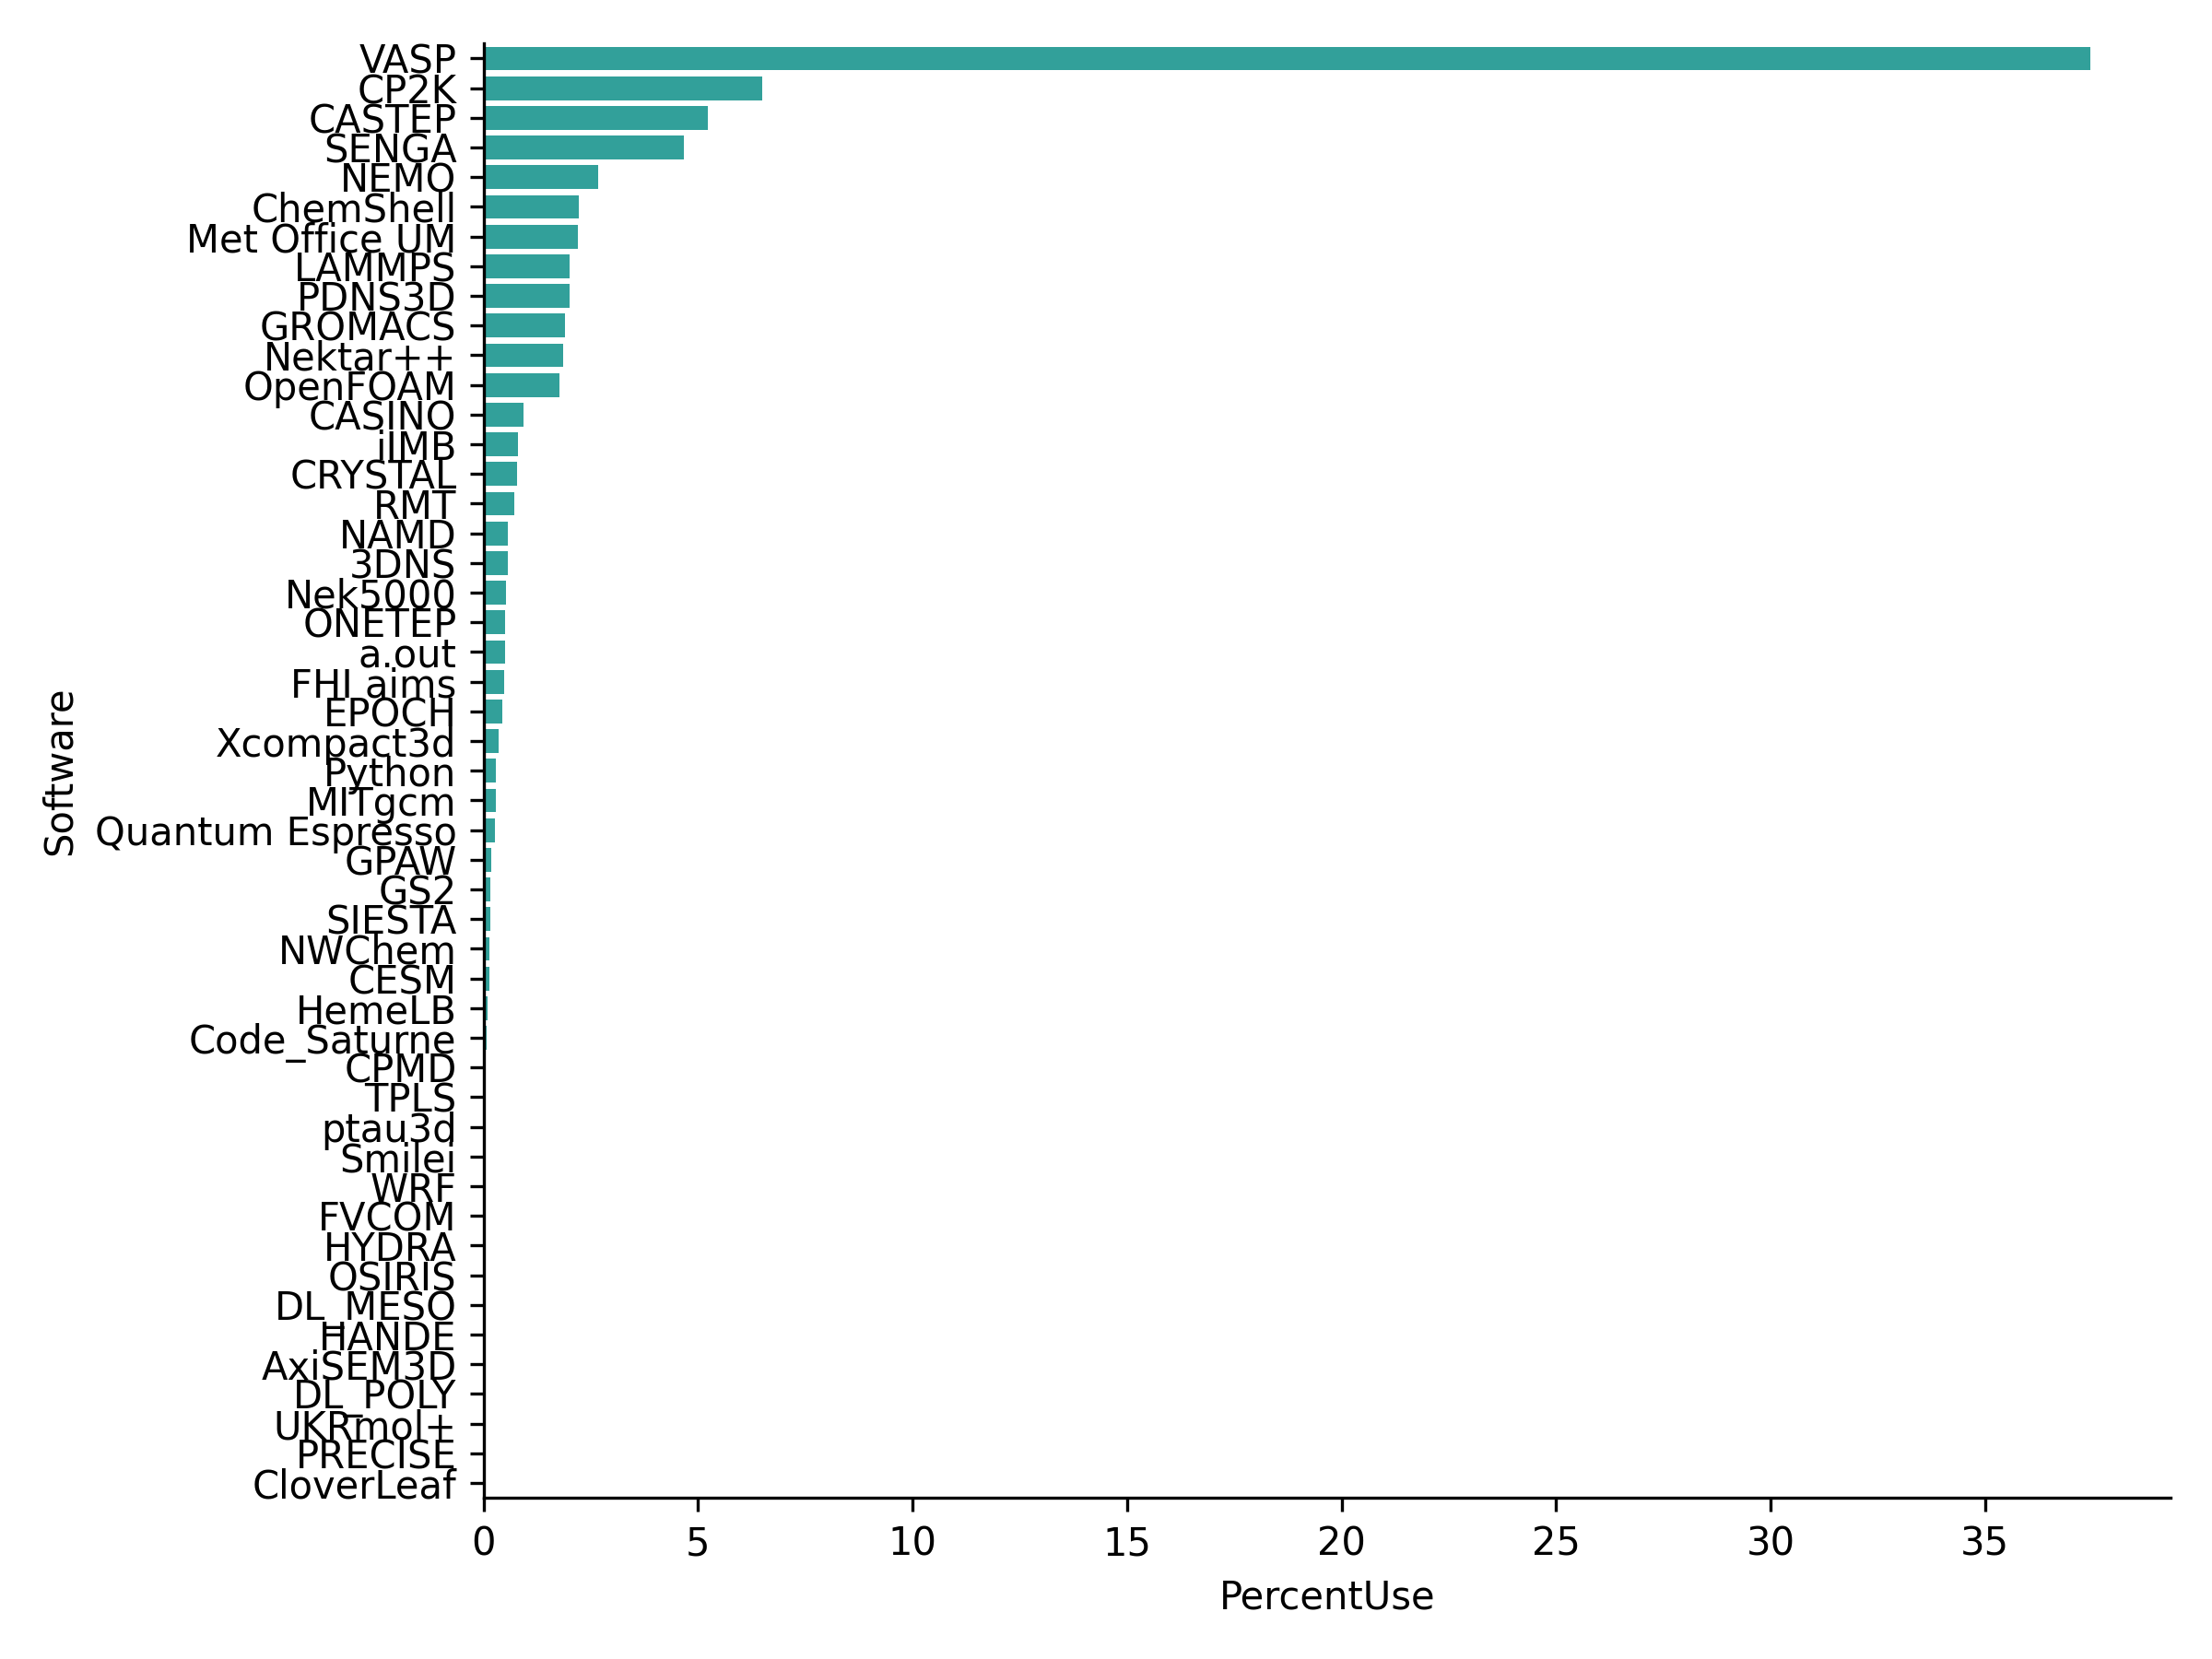
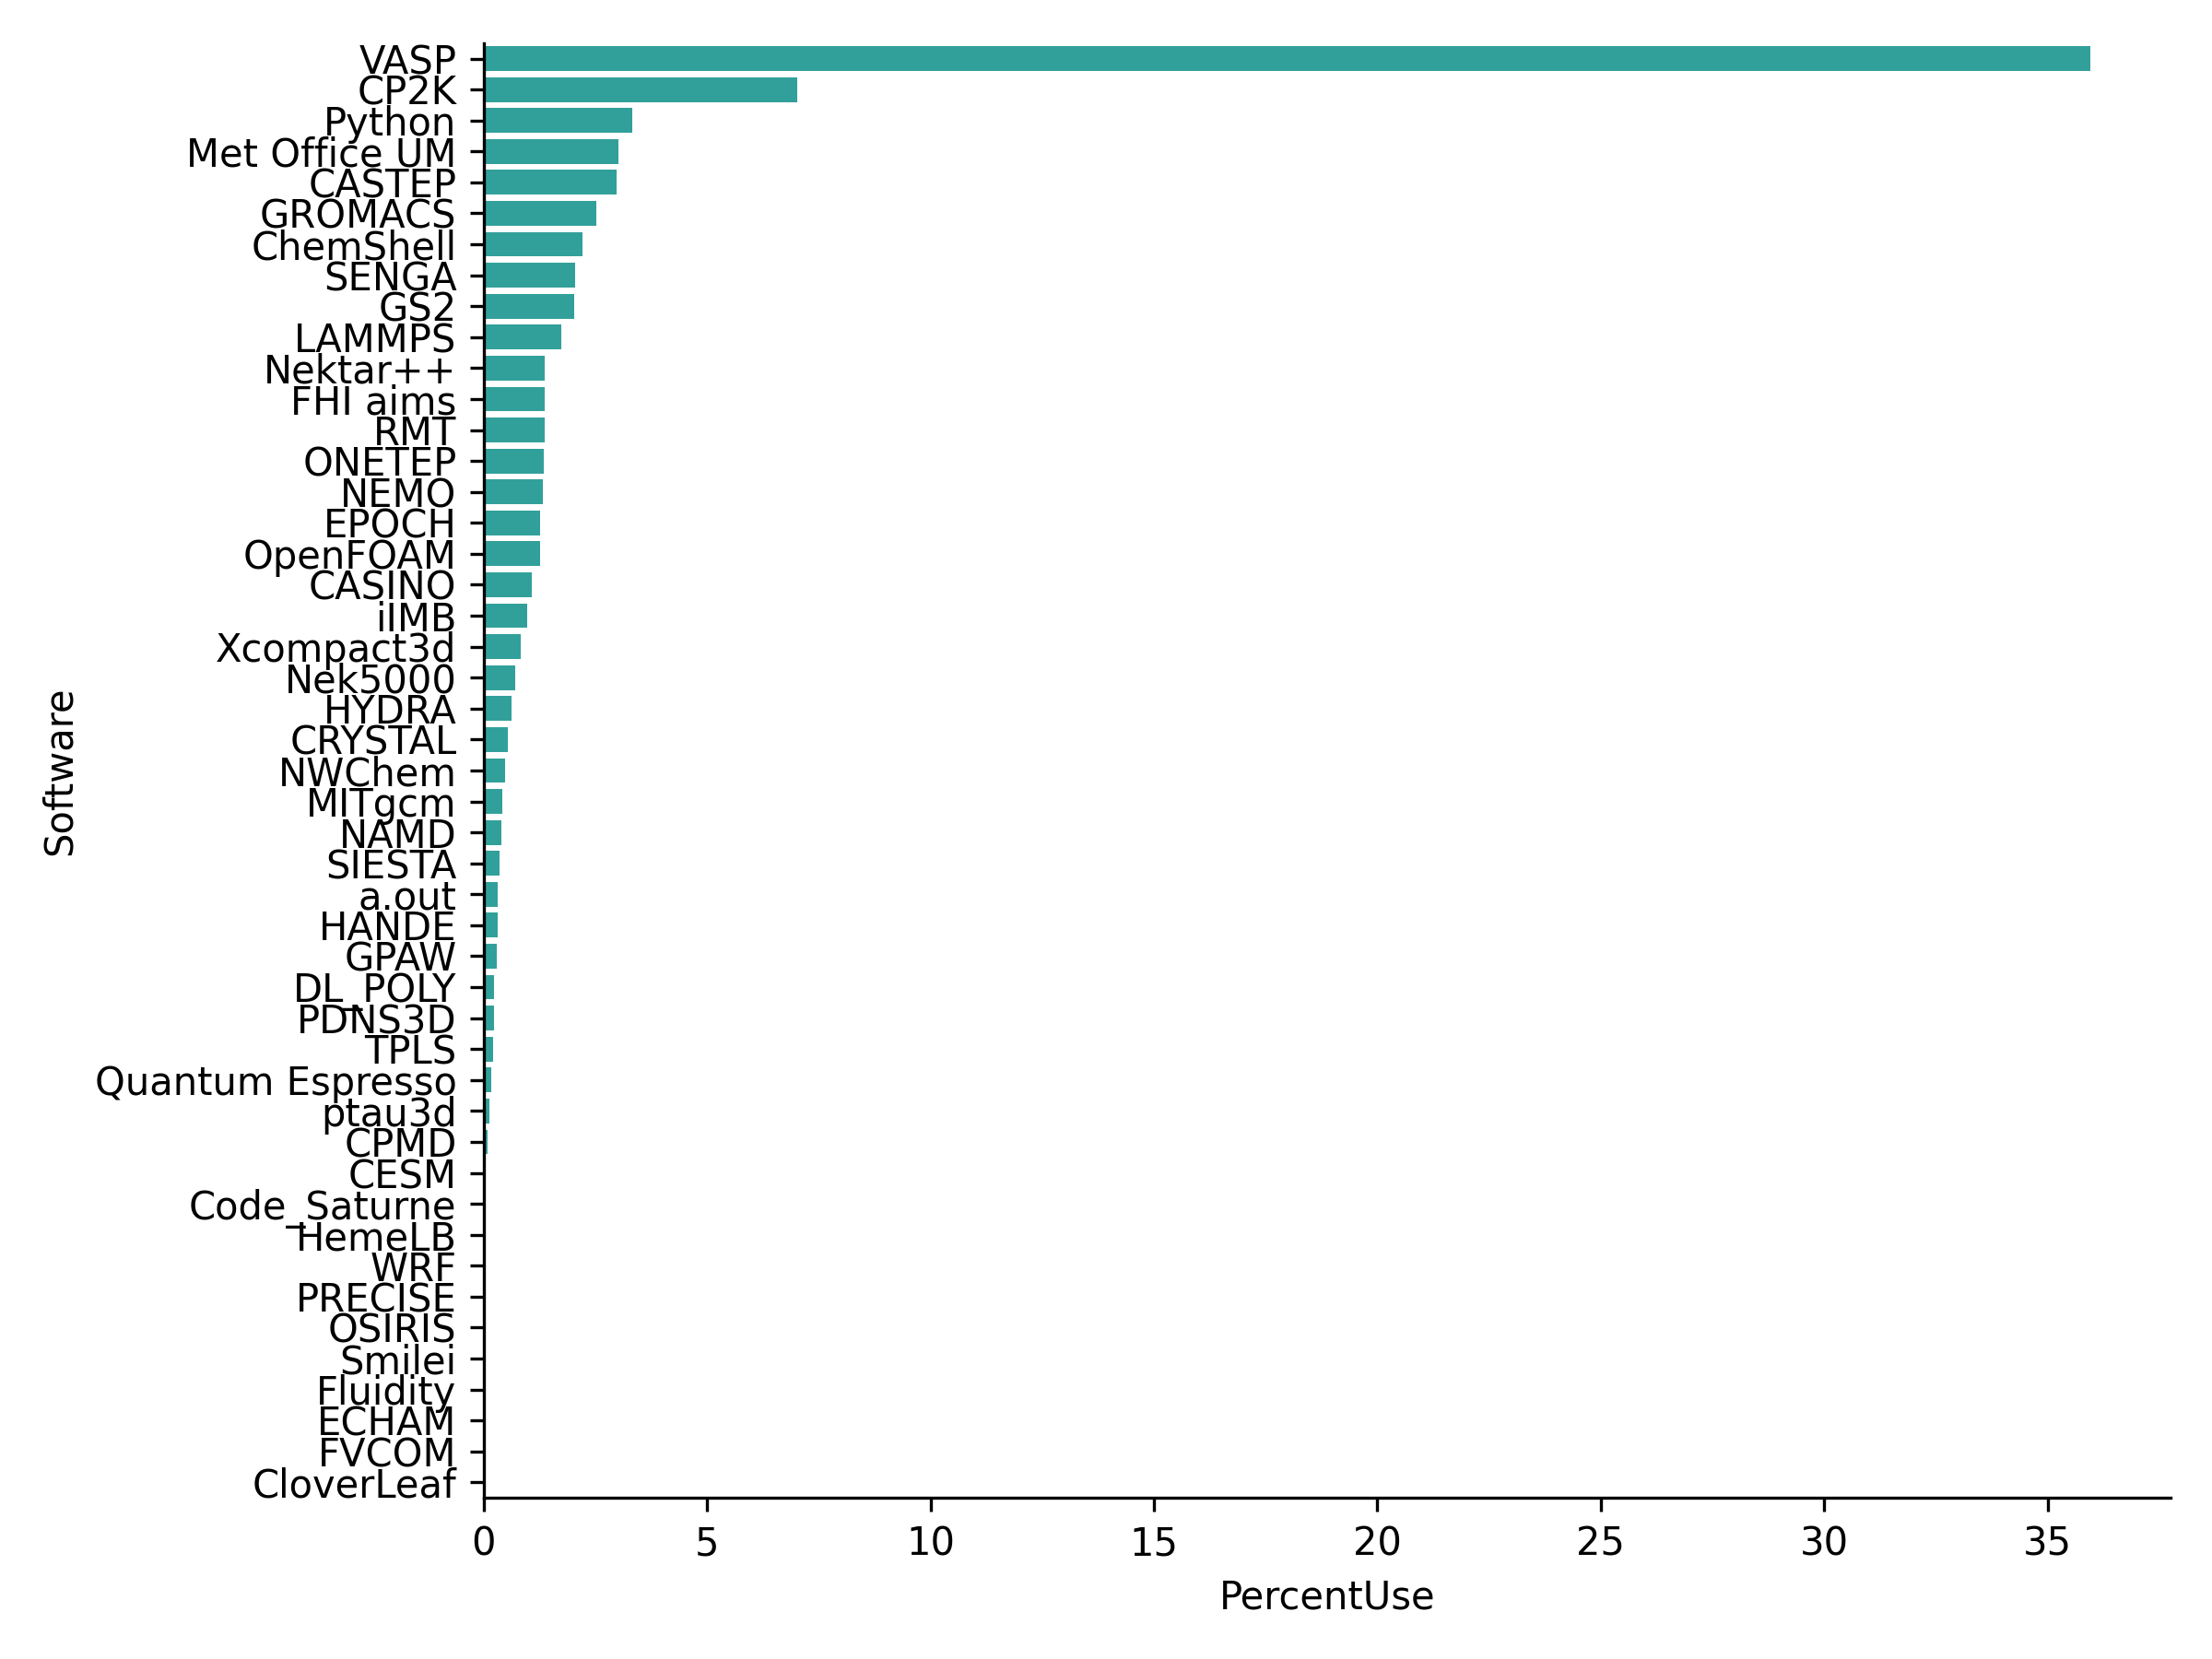
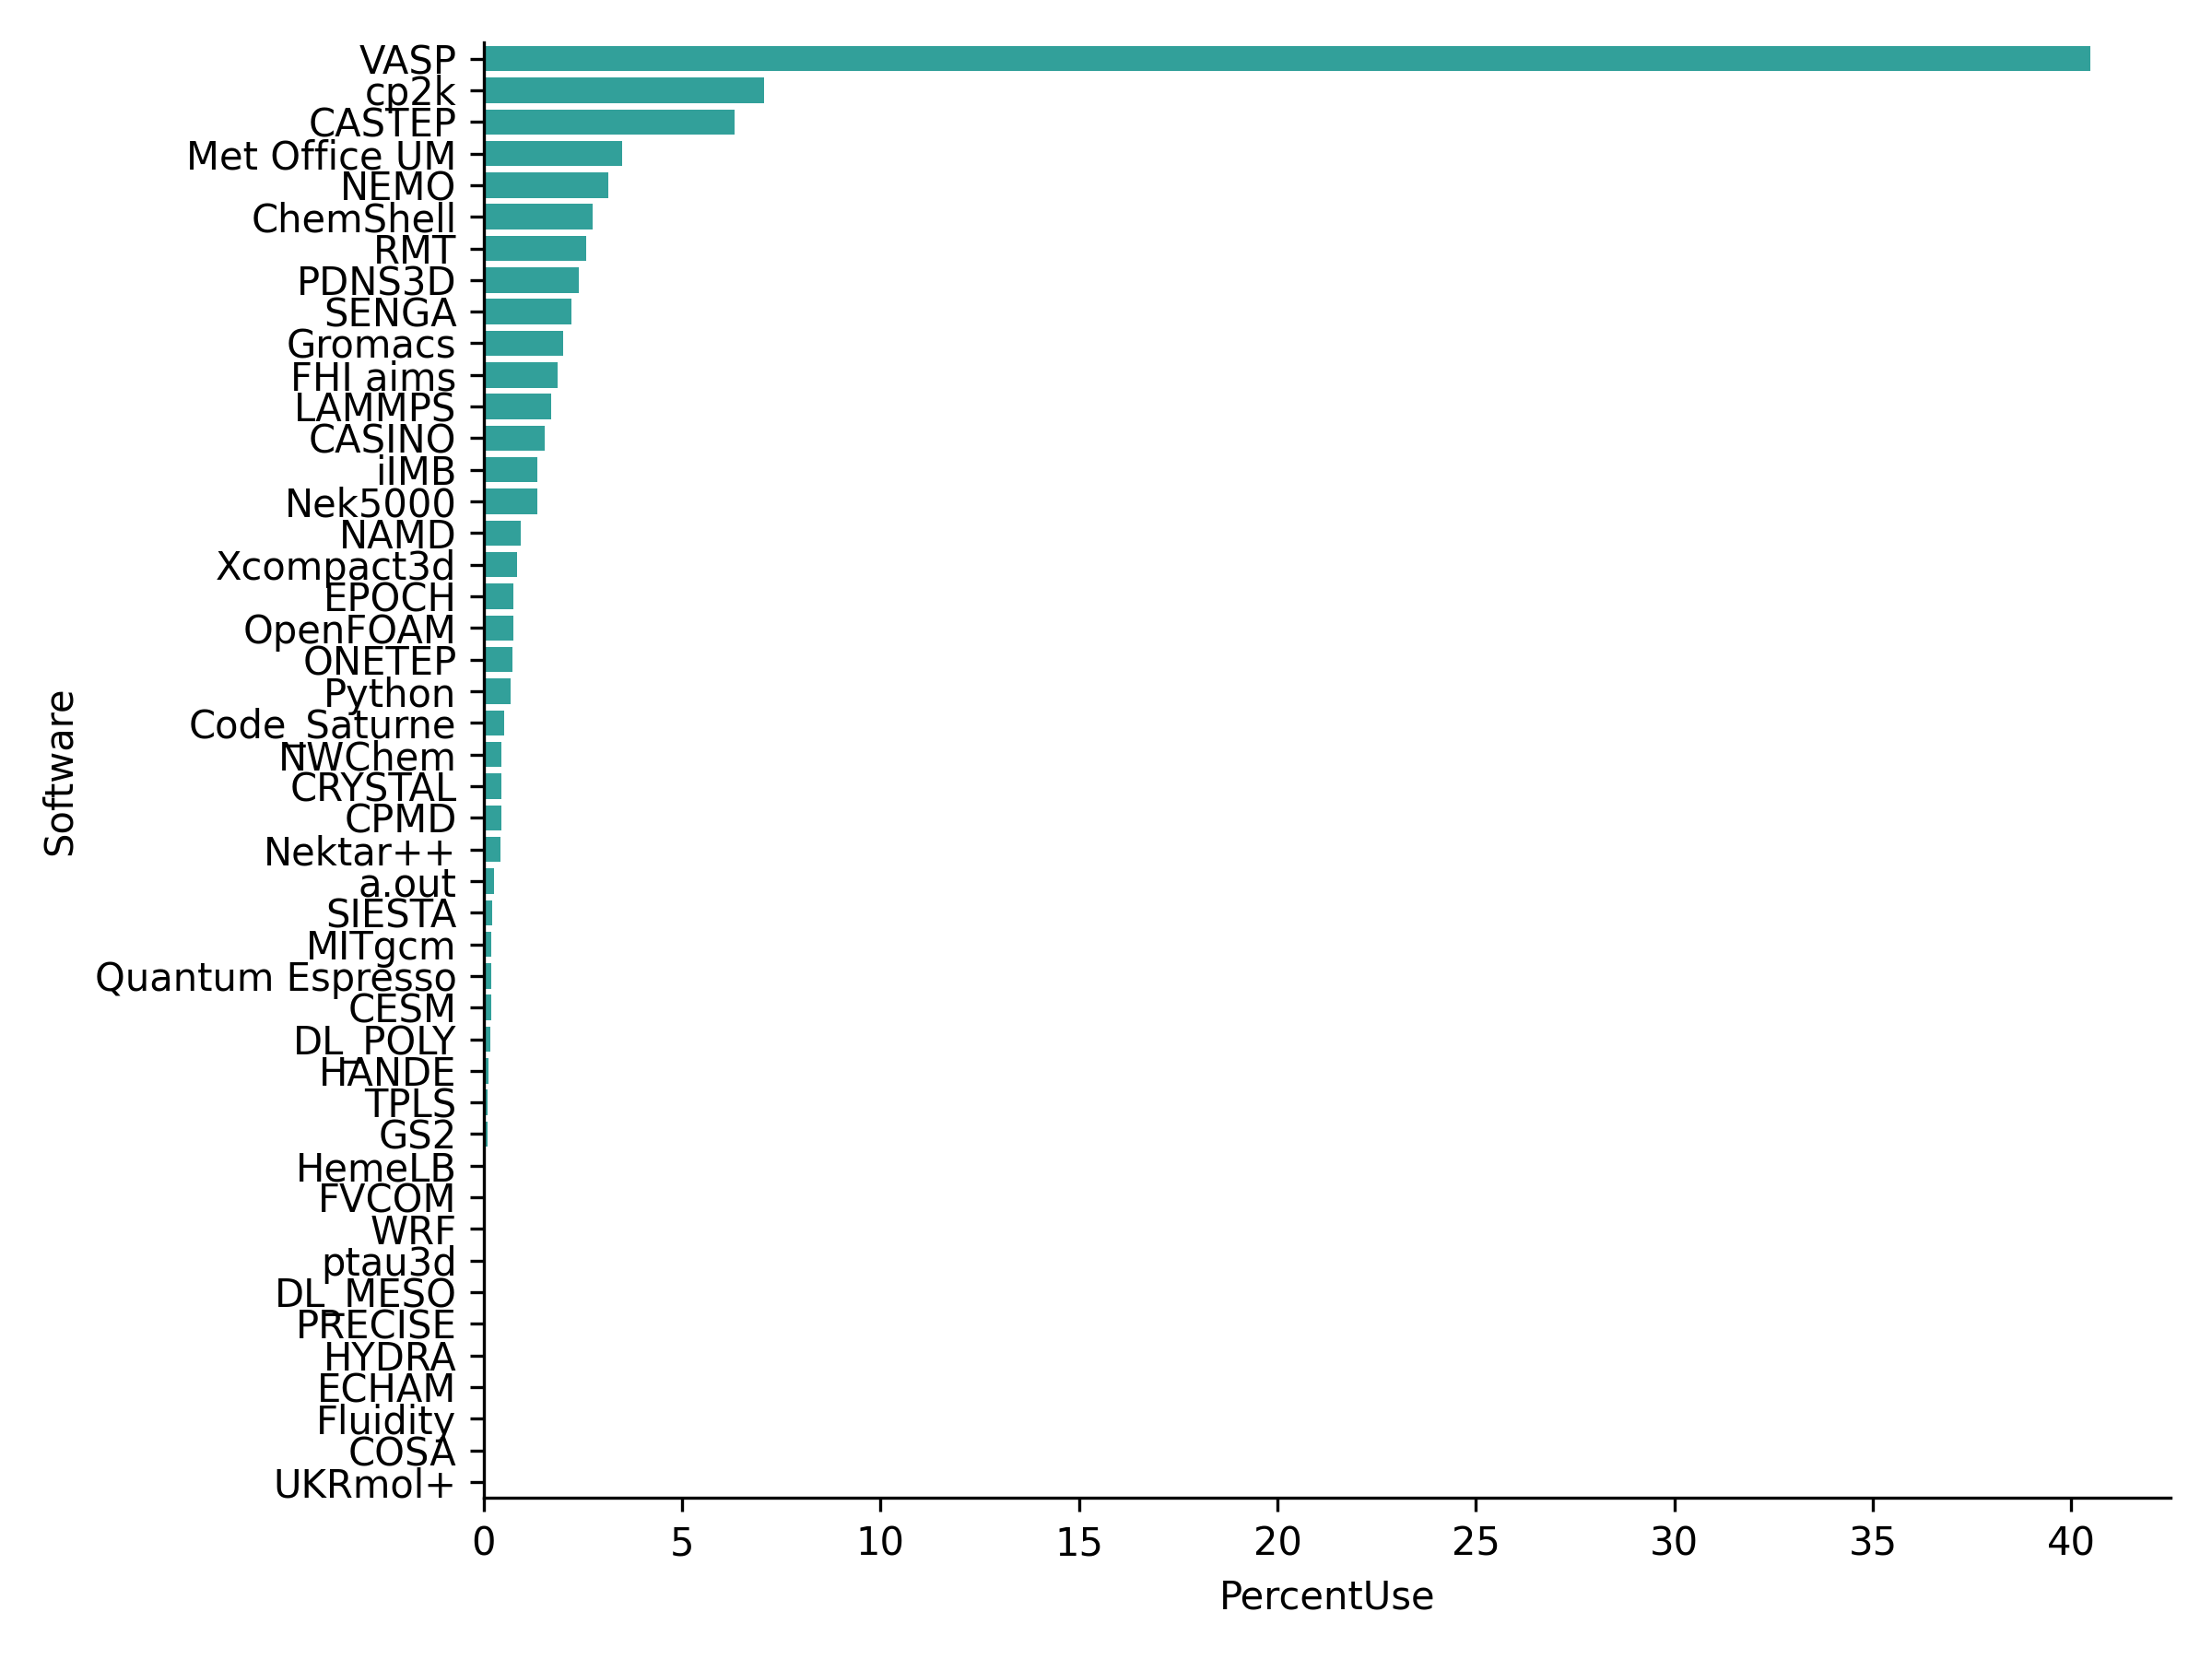
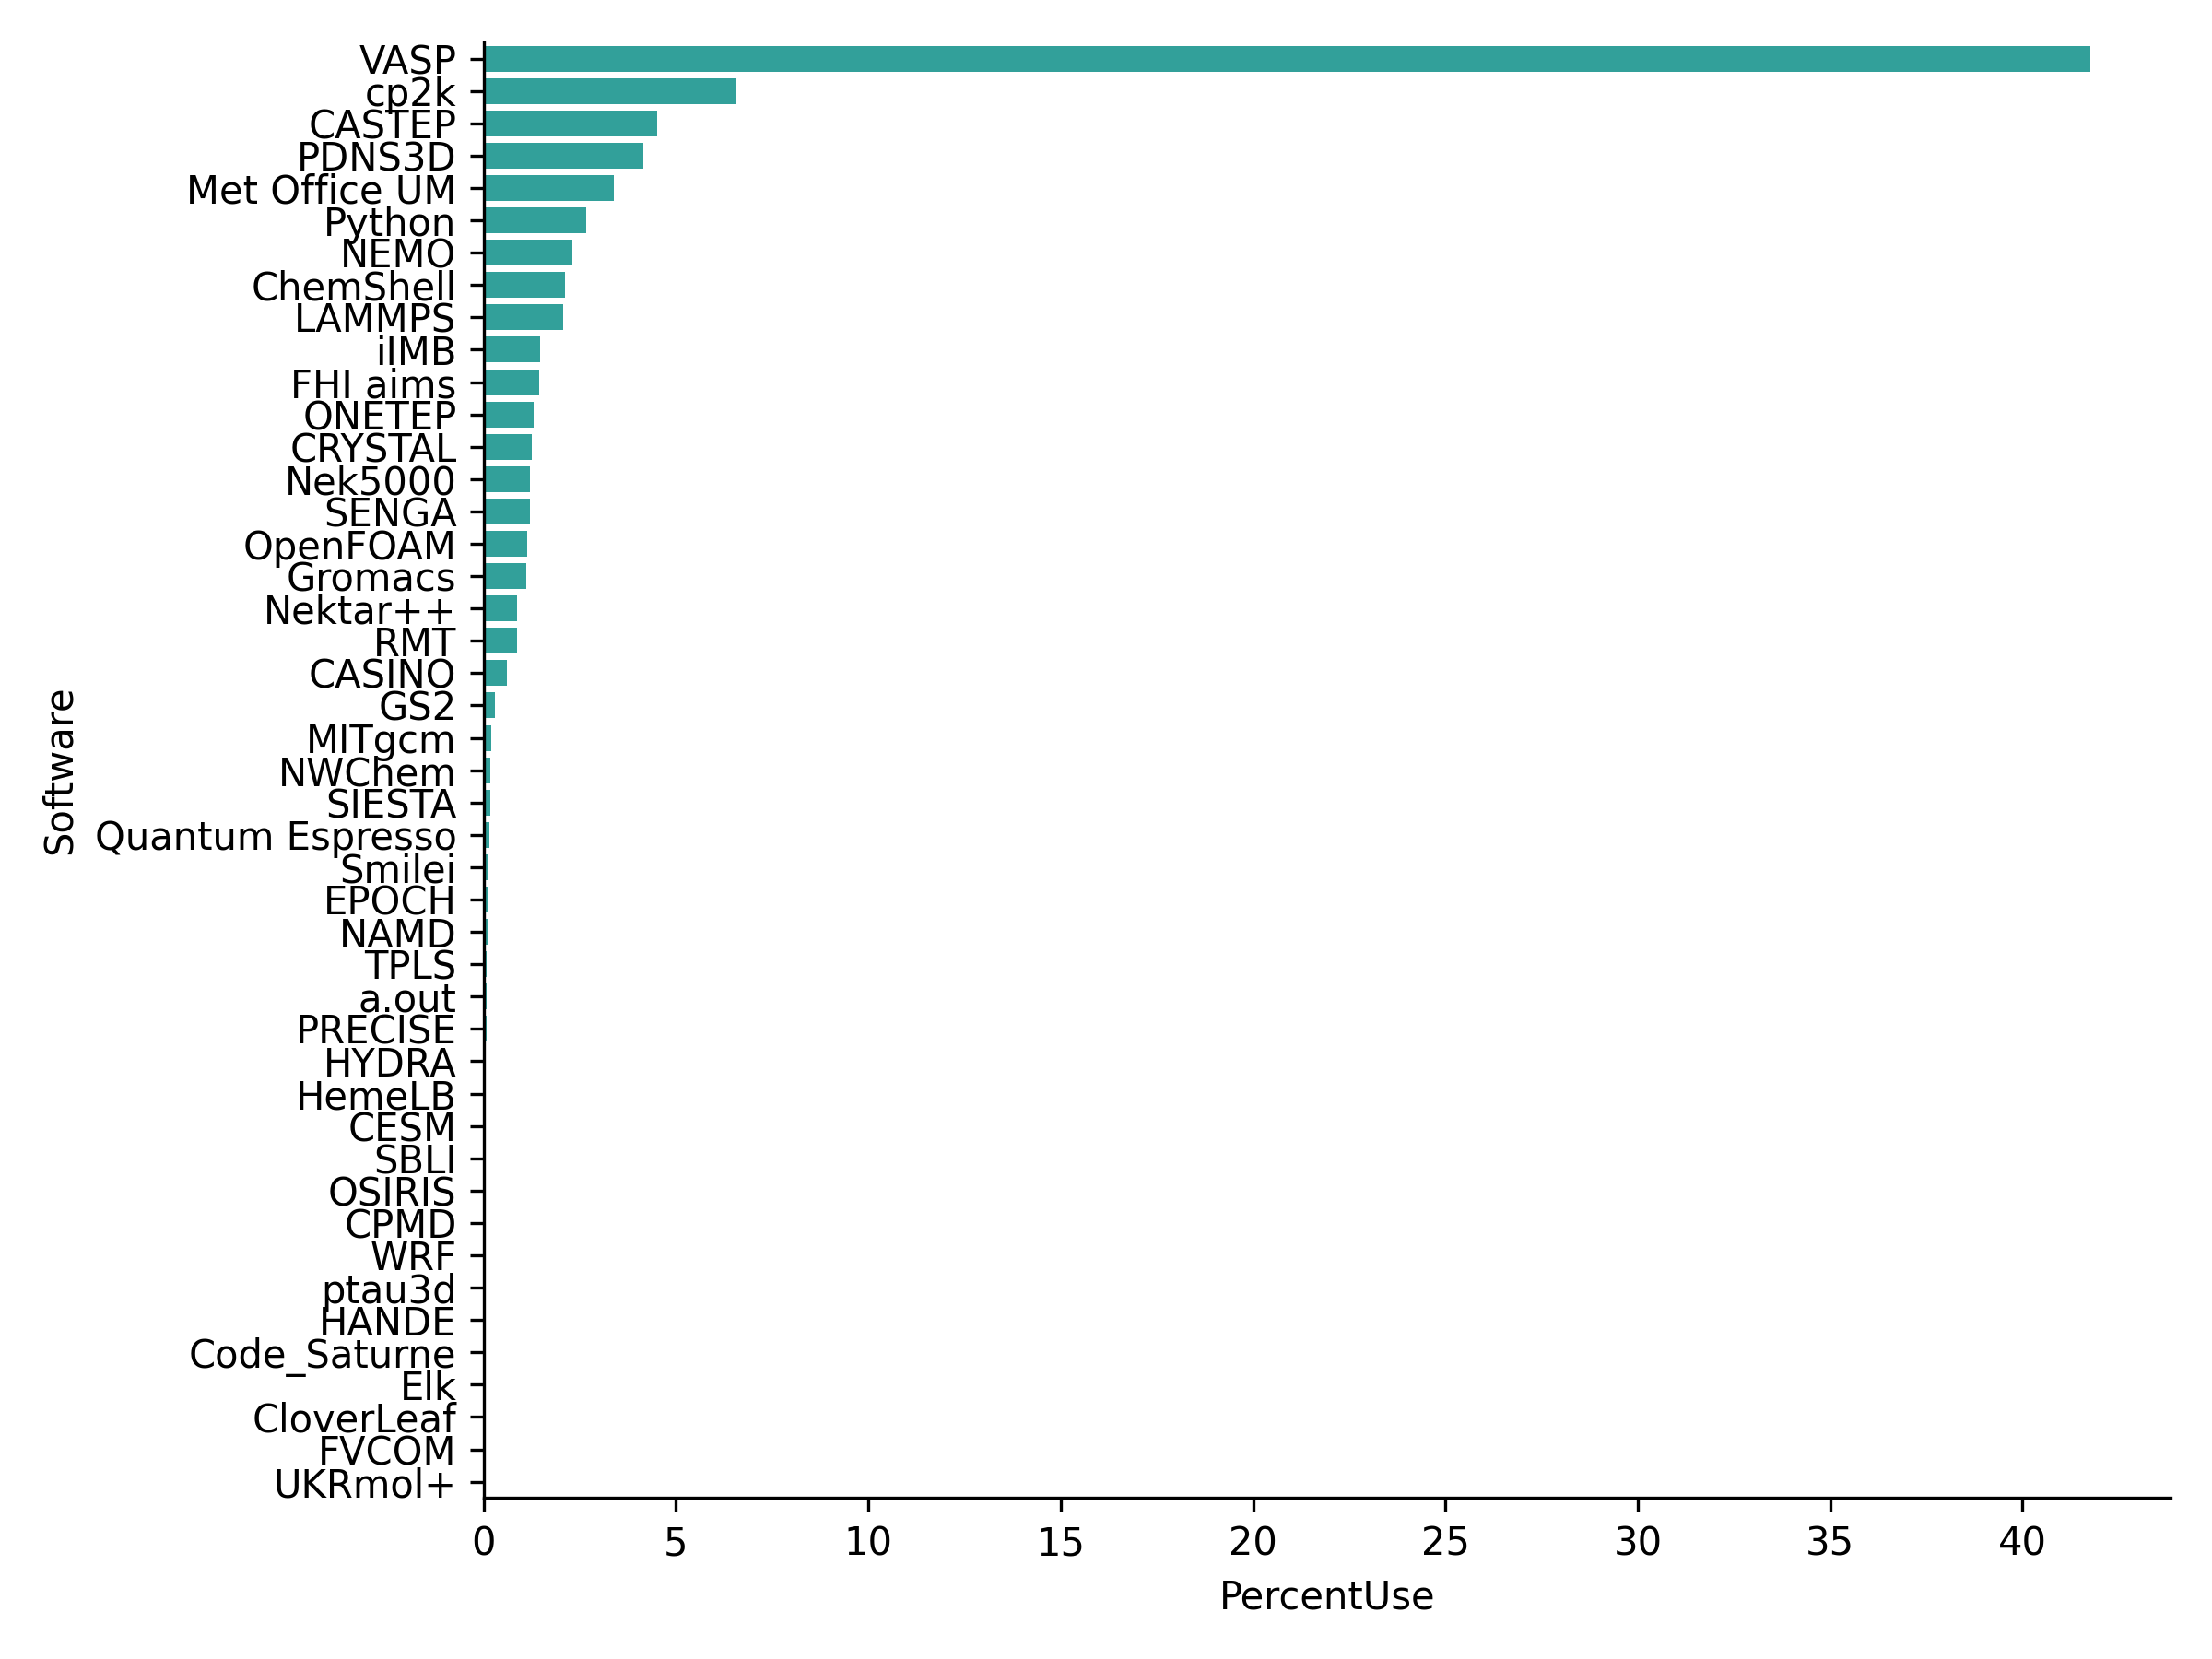
Software usage data
Plot and table of % use and job step size statistics for different software on ARCHER2 for Jun 2026. This data is also available as a CSV file.

This table shows job step size statistics in cores weighted by usage, total number of job steps and percent usage broken down by different software for Jun 2026.
| Software | Min | Q1 | Median | Q3 | Max | Jobs | Nodeh | PercentUse | Users | Projects |
|---|---|---|---|---|---|---|---|---|---|---|
| Overall | 1 | 512.0 | 1024.0 | 6144.0 | 131072 | 2363565 | 3722926.6 | 100.0 | 919 | 121 |
| Unknown | 1 | 768.0 | 1600.0 | 8192.0 | 99687 | 1066788 | 828346.6 | 22.2 | 452 | 96 |
| VASP | 1 | 512.0 | 512.0 | 512.0 | 8640 | 183656 | 682038.4 | 18.3 | 149 | 16 |
| Met Office UM | 1 | 576.0 | 1536.0 | 6165.0 | 6624 | 55508 | 357107.5 | 9.6 | 52 | 4 |
| No srun | 1 | 768.0 | 2304.0 | 10368.0 | 99712 | 104749 | 227914.1 | 6.1 | 713 | 104 |
| CP2K | 1 | 256.0 | 256.0 | 1024.0 | 4096 | 51997 | 205842.3 | 5.5 | 40 | 5 |
| Python | 1 | 1280.0 | 5120.0 | 16384.0 | 16384 | 412224 | 183860.5 | 4.9 | 69 | 30 |
| OpenFOAM | 1 | 512.0 | 1024.0 | 1536.0 | 25599 | 62239 | 129315.1 | 3.5 | 55 | 24 |
| GROMACS | 1 | 128.0 | 1536.0 | 2048.0 | 4096 | 9021 | 116487.4 | 3.1 | 37 | 8 |
| LAMMPS | 1 | 256.0 | 768.0 | 1280.0 | 131072 | 19035 | 95421.8 | 2.6 | 51 | 16 |
| Nektar++ | 1 | 3200.0 | 10240.0 | 10368.0 | 15360 | 586 | 85480.7 | 2.3 | 10 | 4 |
| NEMO | 1 | 480.0 | 1584.0 | 5040.0 | 10080 | 29492 | 84589.6 | 2.3 | 25 | 3 |
| FHI aims | 4 | 512.0 | 512.0 | 1024.0 | 16384 | 41267 | 80373.3 | 2.2 | 27 | 5 |
| Hydro3D | 144 | 4000.0 | 36040.0 | 36040.0 | 36040 | 108 | 66532.7 | 1.8 | 5 | 2 |
| GENE | 4 | 512.0 | 10240.0 | 10240.0 | 10240 | 3109 | 58626.7 | 1.6 | 4 | 2 |
| ChemShell | 1 | 256.0 | 1008.0 | 12800.0 | 12800 | 5553 | 50458.0 | 1.4 | 14 | 4 |
| Xcompact3d | 128 | 5760.0 | 32768.0 | 32768.0 | 131072 | 157 | 41557.9 | 1.1 | 7 | 4 |
| Quantum Espresso | 1 | 256.0 | 512.0 | 1280.0 | 3072 | 4548 | 37272.6 | 1.0 | 37 | 8 |
| OpenSBLI | 128 | 64000.0 | 64000.0 | 64000.0 | 131072 | 17 | 35998.3 | 1.0 | 4 | 3 |
| iIMB | 2304 | 2304.0 | 2304.0 | 2304.0 | 2304 | 139 | 33817.9 | 0.9 | 1 | 1 |
| ONETEP | 1 | 128.0 | 160.0 | 560.0 | 560 | 387 | 31778.8 | 0.9 | 6 | 2 |
| MITgcm | 24 | 112.0 | 240.0 | 240.0 | 1512 | 9886 | 30659.0 | 0.8 | 11 | 3 |
| SENGA | 25 | 2048.0 | 2500.0 | 6480.0 | 6480 | 126 | 27087.1 | 0.7 | 4 | 2 |
| CRYSTAL | 64 | 640.0 | 6400.0 | 6400.0 | 6400 | 186 | 25967.5 | 0.7 | 6 | 2 |
| GAMESS | 16 | 128.0 | 128.0 | 128.0 | 128 | 645 | 25929.9 | 0.7 | 10 | 1 |
| EPOCH | 128 | 2048.0 | 4096.0 | 4096.0 | 20736 | 654 | 24914.9 | 0.7 | 8 | 1 |
| CESM | 1 | 1024.0 | 1152.0 | 2816.0 | 5888 | 730 | 24271.6 | 0.7 | 14 | 3 |
| HYDRA | 1 | 5120.0 | 5120.0 | 5120.0 | 59904 | 1085 | 23200.1 | 0.6 | 12 | 6 |
| CASTEP | 1 | 128.0 | 128.0 | 256.0 | 3584 | 285934 | 21473.7 | 0.6 | 30 | 4 |
| VAMPIRE | 128 | 1024.0 | 1024.0 | 8192.0 | 8192 | 1525 | 17302.5 | 0.5 | 6 | 2 |
| TPLS | 512 | 2048.0 | 2048.0 | 2048.0 | 4096 | 69 | 13258.1 | 0.4 | 2 | 1 |
| 3DNS | 440 | 9900.0 | 9900.0 | 11550.0 | 11550 | 28 | 9975.6 | 0.3 | 1 | 1 |
| NAMD | 32 | 128.0 | 128.0 | 512.0 | 1536 | 1168 | 6832.0 | 0.2 | 7 | 5 |
| RMT | 128 | 2432.0 | 2432.0 | 2432.0 | 2560 | 137 | 6730.3 | 0.2 | 4 | 1 |
| Code_Saturne | 8 | 1024.0 | 2048.0 | 8192.0 | 8192 | 313 | 5321.1 | 0.1 | 6 | 4 |
| WRF | 8 | 384.0 | 384.0 | 384.0 | 384 | 52 | 4545.3 | 0.1 | 4 | 2 |
| a.out | 1 | 128.0 | 128.0 | 1536.0 | 2048 | 2395 | 4234.4 | 0.1 | 10 | 5 |
| ludwig | 1 | 512.0 | 512.0 | 512.0 | 512 | 878 | 3391.0 | 0.1 | 2 | 2 |
| PDNS3D | 1024 | 1024.0 | 1024.0 | 1024.0 | 1024 | 41 | 2900.1 | 0.1 | 1 | 1 |
| NWChem | 64 | 128.0 | 256.0 | 512.0 | 768 | 3063 | 2640.7 | 0.1 | 7 | 4 |
| GS2 | 32 | 768.0 | 768.0 | 1536.0 | 1536 | 113 | 2093.9 | 0.1 | 2 | 1 |
| AxiSEM3D | 128 | 128.0 | 2560.0 | 12800.0 | 51200 | 1208 | 1873.7 | 0.1 | 2 | 1 |
| ECOGEN | 3072 | 3072.0 | 3072.0 | 3072.0 | 3072 | 6 | 1090.9 | 0.0 | 1 | 1 |
| Smilei | 8 | 128.0 | 256.0 | 256.0 | 256 | 124 | 843.8 | 0.0 | 2 | 1 |
| OSIRIS | 512 | 1024.0 | 1024.0 | 1024.0 | 1024 | 13 | 765.3 | 0.0 | 1 | 1 |
| HemeLB | 512 | 768.0 | 1024.0 | 1024.0 | 1280 | 17 | 739.4 | 0.0 | 1 | 1 |
| FDS | 248 | 420.0 | 420.0 | 420.0 | 420 | 8 | 619.4 | 0.0 | 1 | 1 |
| SIESTA | 1 | 64.0 | 128.0 | 2304.0 | 2304 | 2289 | 393.9 | 0.0 | 2 | 1 |
| PeleLMeX | 2048 | 2048.0 | 2048.0 | 2048.0 | 2048 | 1 | 379.0 | 0.0 | 1 | 1 |
| Nek5000 | 1024 | 2048.0 | 2048.0 | 2048.0 | 2048 | 16 | 288.6 | 0.0 | 2 | 1 |
| ptau3d | 2 | 30.0 | 60.0 | 160.0 | 160 | 141 | 186.9 | 0.0 | 3 | 1 |
| DL_POLY | 64 | 64.0 | 128.0 | 1280.0 | 1280 | 35 | 164.8 | 0.0 | 3 | 2 |
| DL_MESO | 128 | 128.0 | 128.0 | 128.0 | 128 | 6 | 19.2 | 0.0 | 1 | 1 |
| Arm Forge | 1 | 128.0 | 128.0 | 256.0 | 512 | 69 | 11.6 | 0.0 | 9 | 9 |
| Elk | 32 | 32.0 | 32.0 | 32.0 | 32 | 1 | 1.2 | 0.0 | 1 | 1 |
| GPAW | 768 | 768.0 | 768.0 | 768.0 | 768 | 1 | 0.1 | 0.0 | 1 | 1 |
| SBLI | 1 | 1.0 | 1.0 | 1.0 | 64 | 21 | 0.1 | 0.0 | 1 | 1 |
| UKRmol+ | 4 | 4.0 | 4.0 | 4.0 | 4 | 1 | 0.0 | 0.0 | 1 | 1 |