
Software usage data on ARCHER2
By Andy Turner (EPCC) on February 7, 2022
Tags:
In this blog, I will introduce how we collect software usage data from Slurm on ARCHER2, introduce the sharing of this data on the ARCHER2 public website and then have a look at differences (or not!) in software usage on ARCHER2 between two months:
- December 2021: the initial access period for the full ARCHER2 system when usage was uncharged
- January 2022: charging was turned on on the 4th January 2022 so this month roughly represents usage on the system with charging enabled
TL;DR
- We query Slurm job steps for executable names and match them against a regex library to identify the software being used. The analysis tool is available on GitHub.
- Historic monthly software usage data is available on the ARCHER2 website.
- There are some differences between the charged and uncharged periods on ARCHER2 in terms of software use but the job sizes are relatively consistent.
Collection method
To get statistics on software usage on ARCHER2 we have written a small tool that queries
the Slurm accounting database (via sacct) to extract details of job steps and then
uses this data to associate specific job steps with a library of known software via
a regex match on the executable name. This exploits the fact that Slurm job step names
are given the name of the executable that is passed to the srun command.
The source for this tool and the known software library (with associated regex) are available in a public Gihub repo.
There are a number of potential issues with this approach that may lead to inaccuracies in the data:
- The user may use an executable name for a known software that does not match the regex (or matches a different software regex) so the usage for that job step is wrongly assigned. However, we do still collect this data and report on executable names that have large amounts of usage associated with them so we can add them to the regex library in the future.
- The user may precede the name of the executable with another command (such as
time) which means the data for that job step cannot be correctly assigned.
As this method does not give access to the full job environment we also have to make some assumptions on how to account for jobs that use less than a single nodes-worth of cores (i.e. less than 128 cores). In this case, we compute the charge for the job step in core hours and then divide by 128 to get the cost in CU (Compute Units, equivalent to node hours on ARCHER2). For job steps that use more than one node the charge is simply CU as nodes are allocated exclusively on ARCHER2. This approach may also lead to some inaccuracies in how much individual job steps cost in CU in the calculation.
There is an explicit assumption that the inaccuracies noted above have a small effect on the overall software use statistics if they are sampled over a reasonably large number of job steps. On ARCHER2, a month typically has well over 3 million individual job steps.
Access to historical software use data
One aspect of the service status pages for the old ARCHER service that was useful and interesting to users and more widely was access to information on the use of software on the service. We have recently added similar information to the ARCHER2 status pages on the website. In addition, we got a large number of requests for the underlying and historical software use data. The old ARCHER version only had usage for the last month but we have put in place a way to make the monthly software use data available publicly on the ARCHER2 website status page and this will be continuously updated throughout the lifetime of the service. The status page contains:
- Heatmaps showing usage and queue time by job length and size
- Plots breaking down usage by software and job size by software
- A table breaking down usage and job size by software
- Links to data from previous periods
In addition, the historical software usage data from the service now sits in a repository of historical software use data GitHub repository for people to access.
Comparison of uncharged and charged periods
In this section we compare the software usage on ARCHER2 for two different periods:
- December 2021: the initial access period for the full ARCHER2 system when usage was uncharged
- January 2022: charging was turned on on the 4th January 2022 so this month mostly represents usage on the system with charging enabled
For both of these periods, ARCHER2 usage was high, though January saw slightly lower utilisation than December:
- Dec 2021: Overall utilisation of 93.1%, 2.166 million job steps
- Jan 2022: Overall utilisation of 87.2%, 1.899 million job steps
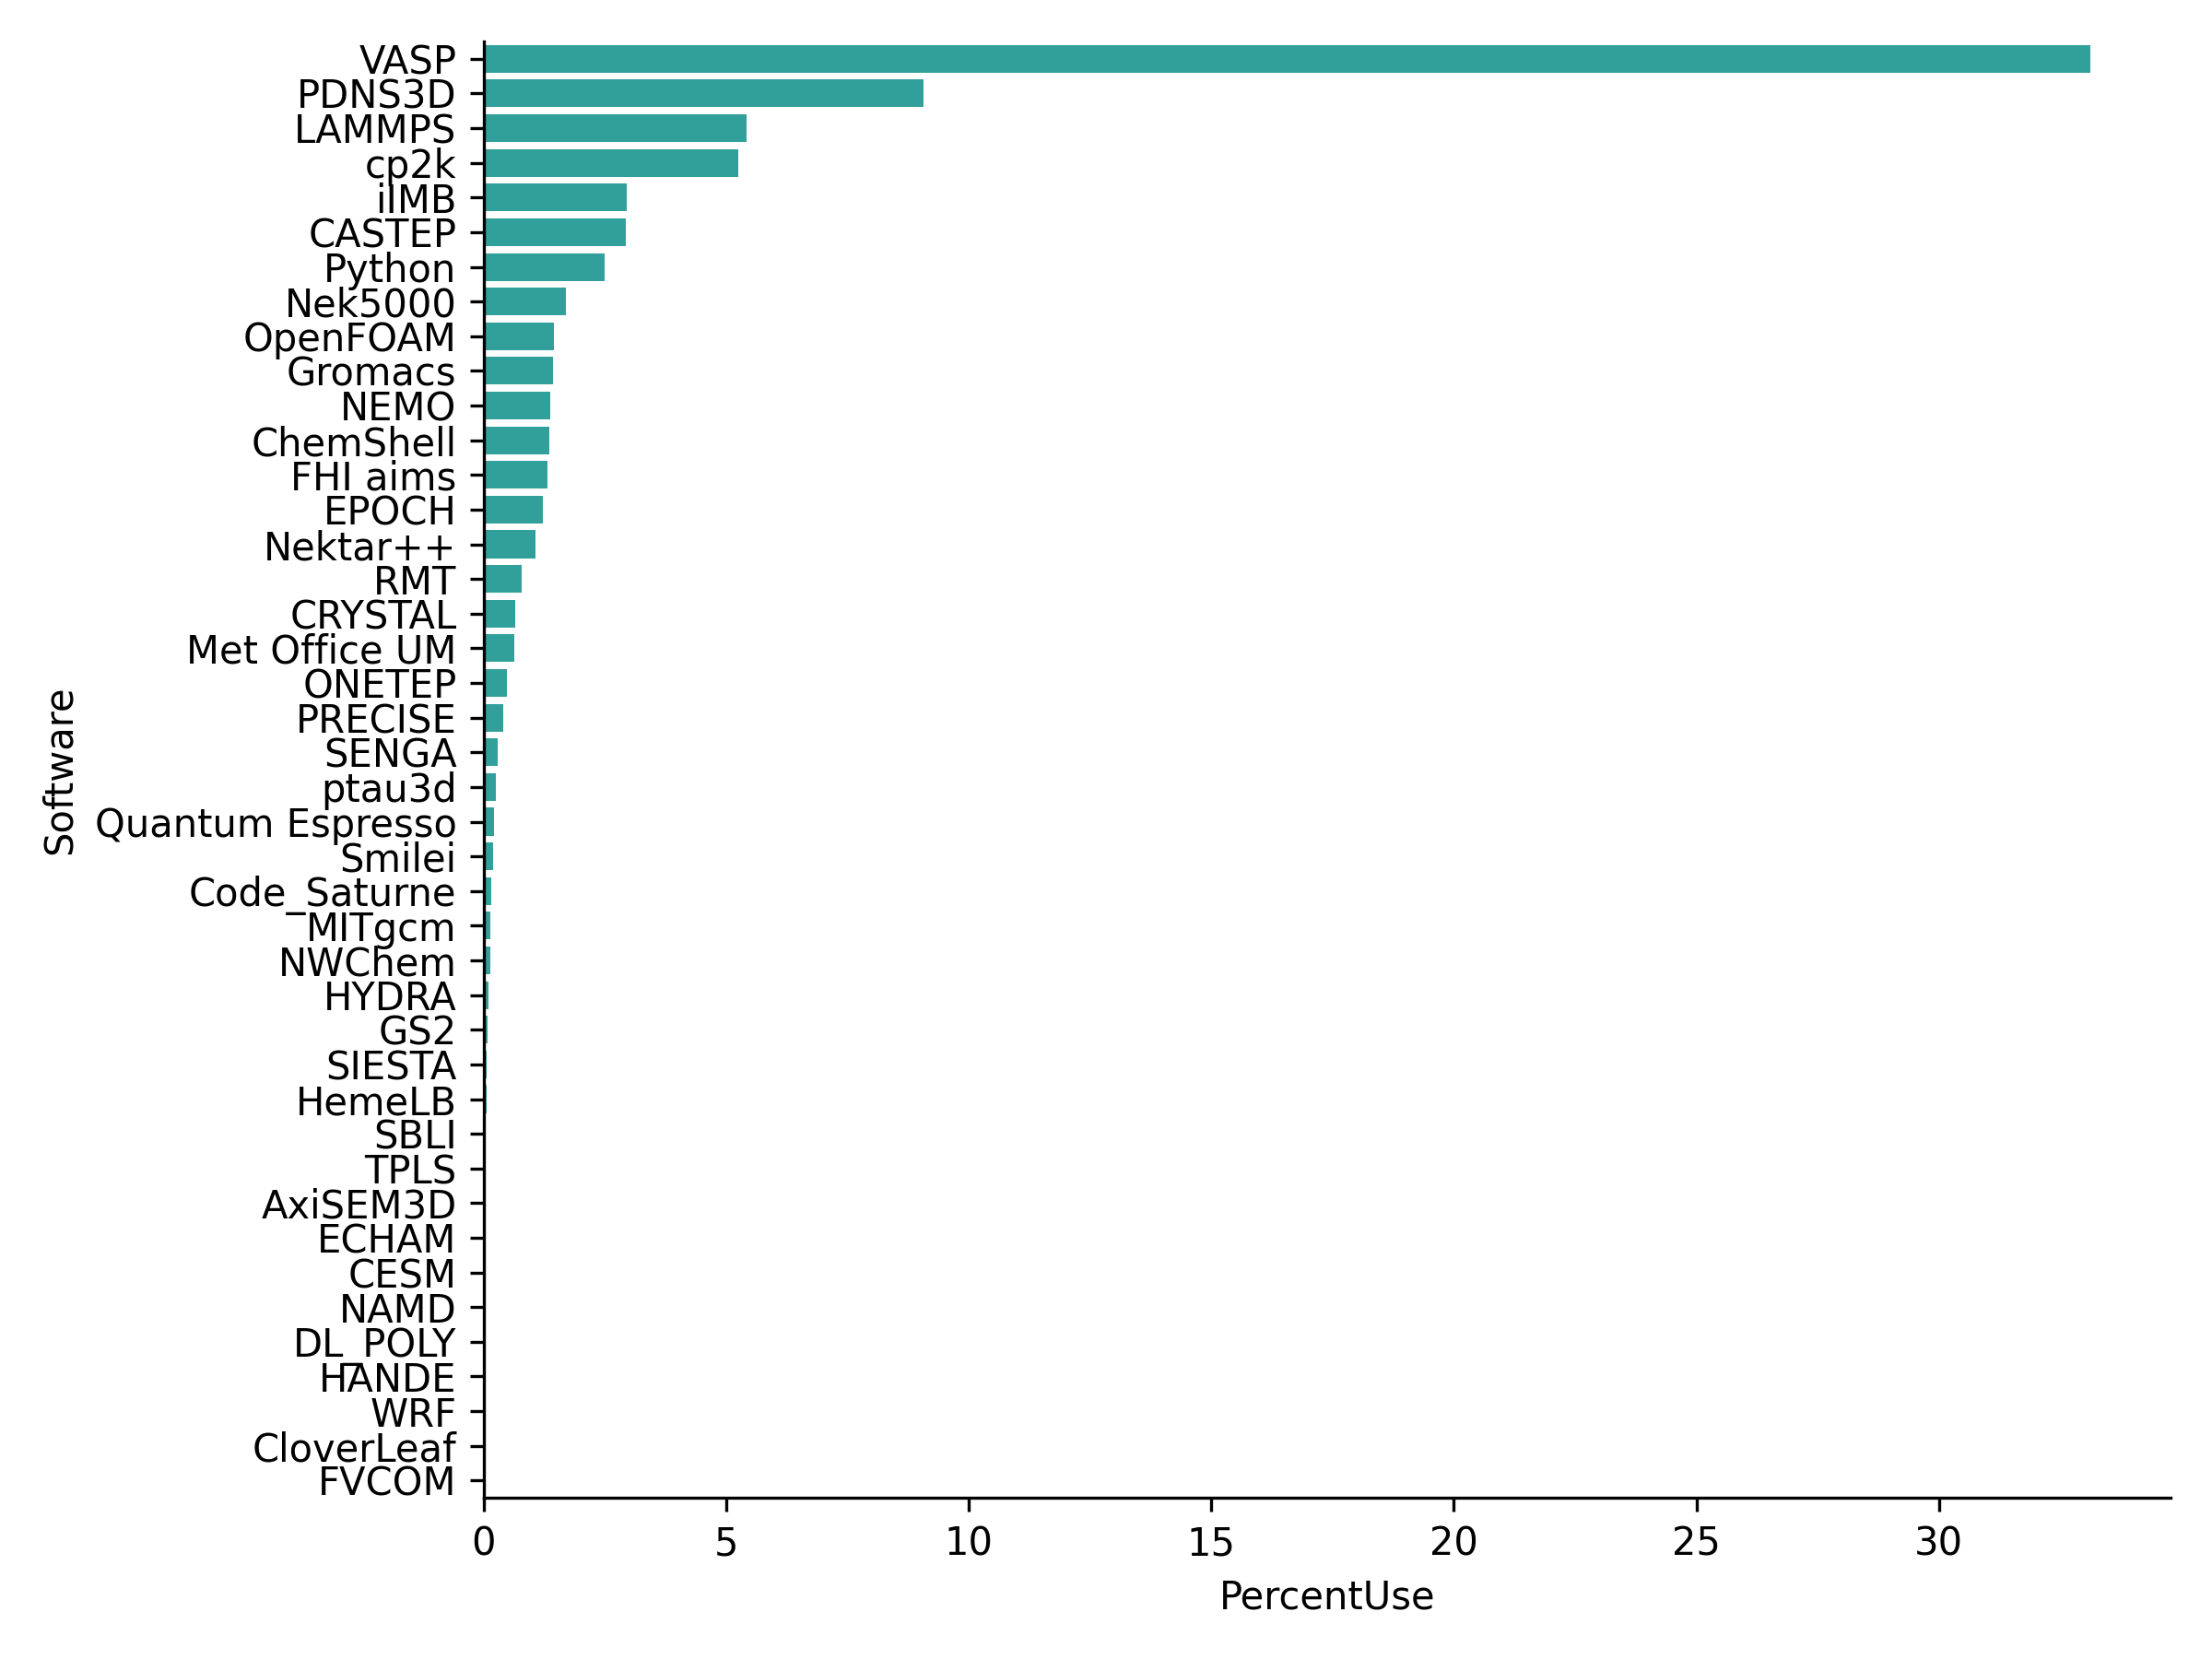
The plots below show % use by software for the two periods
December 2021:
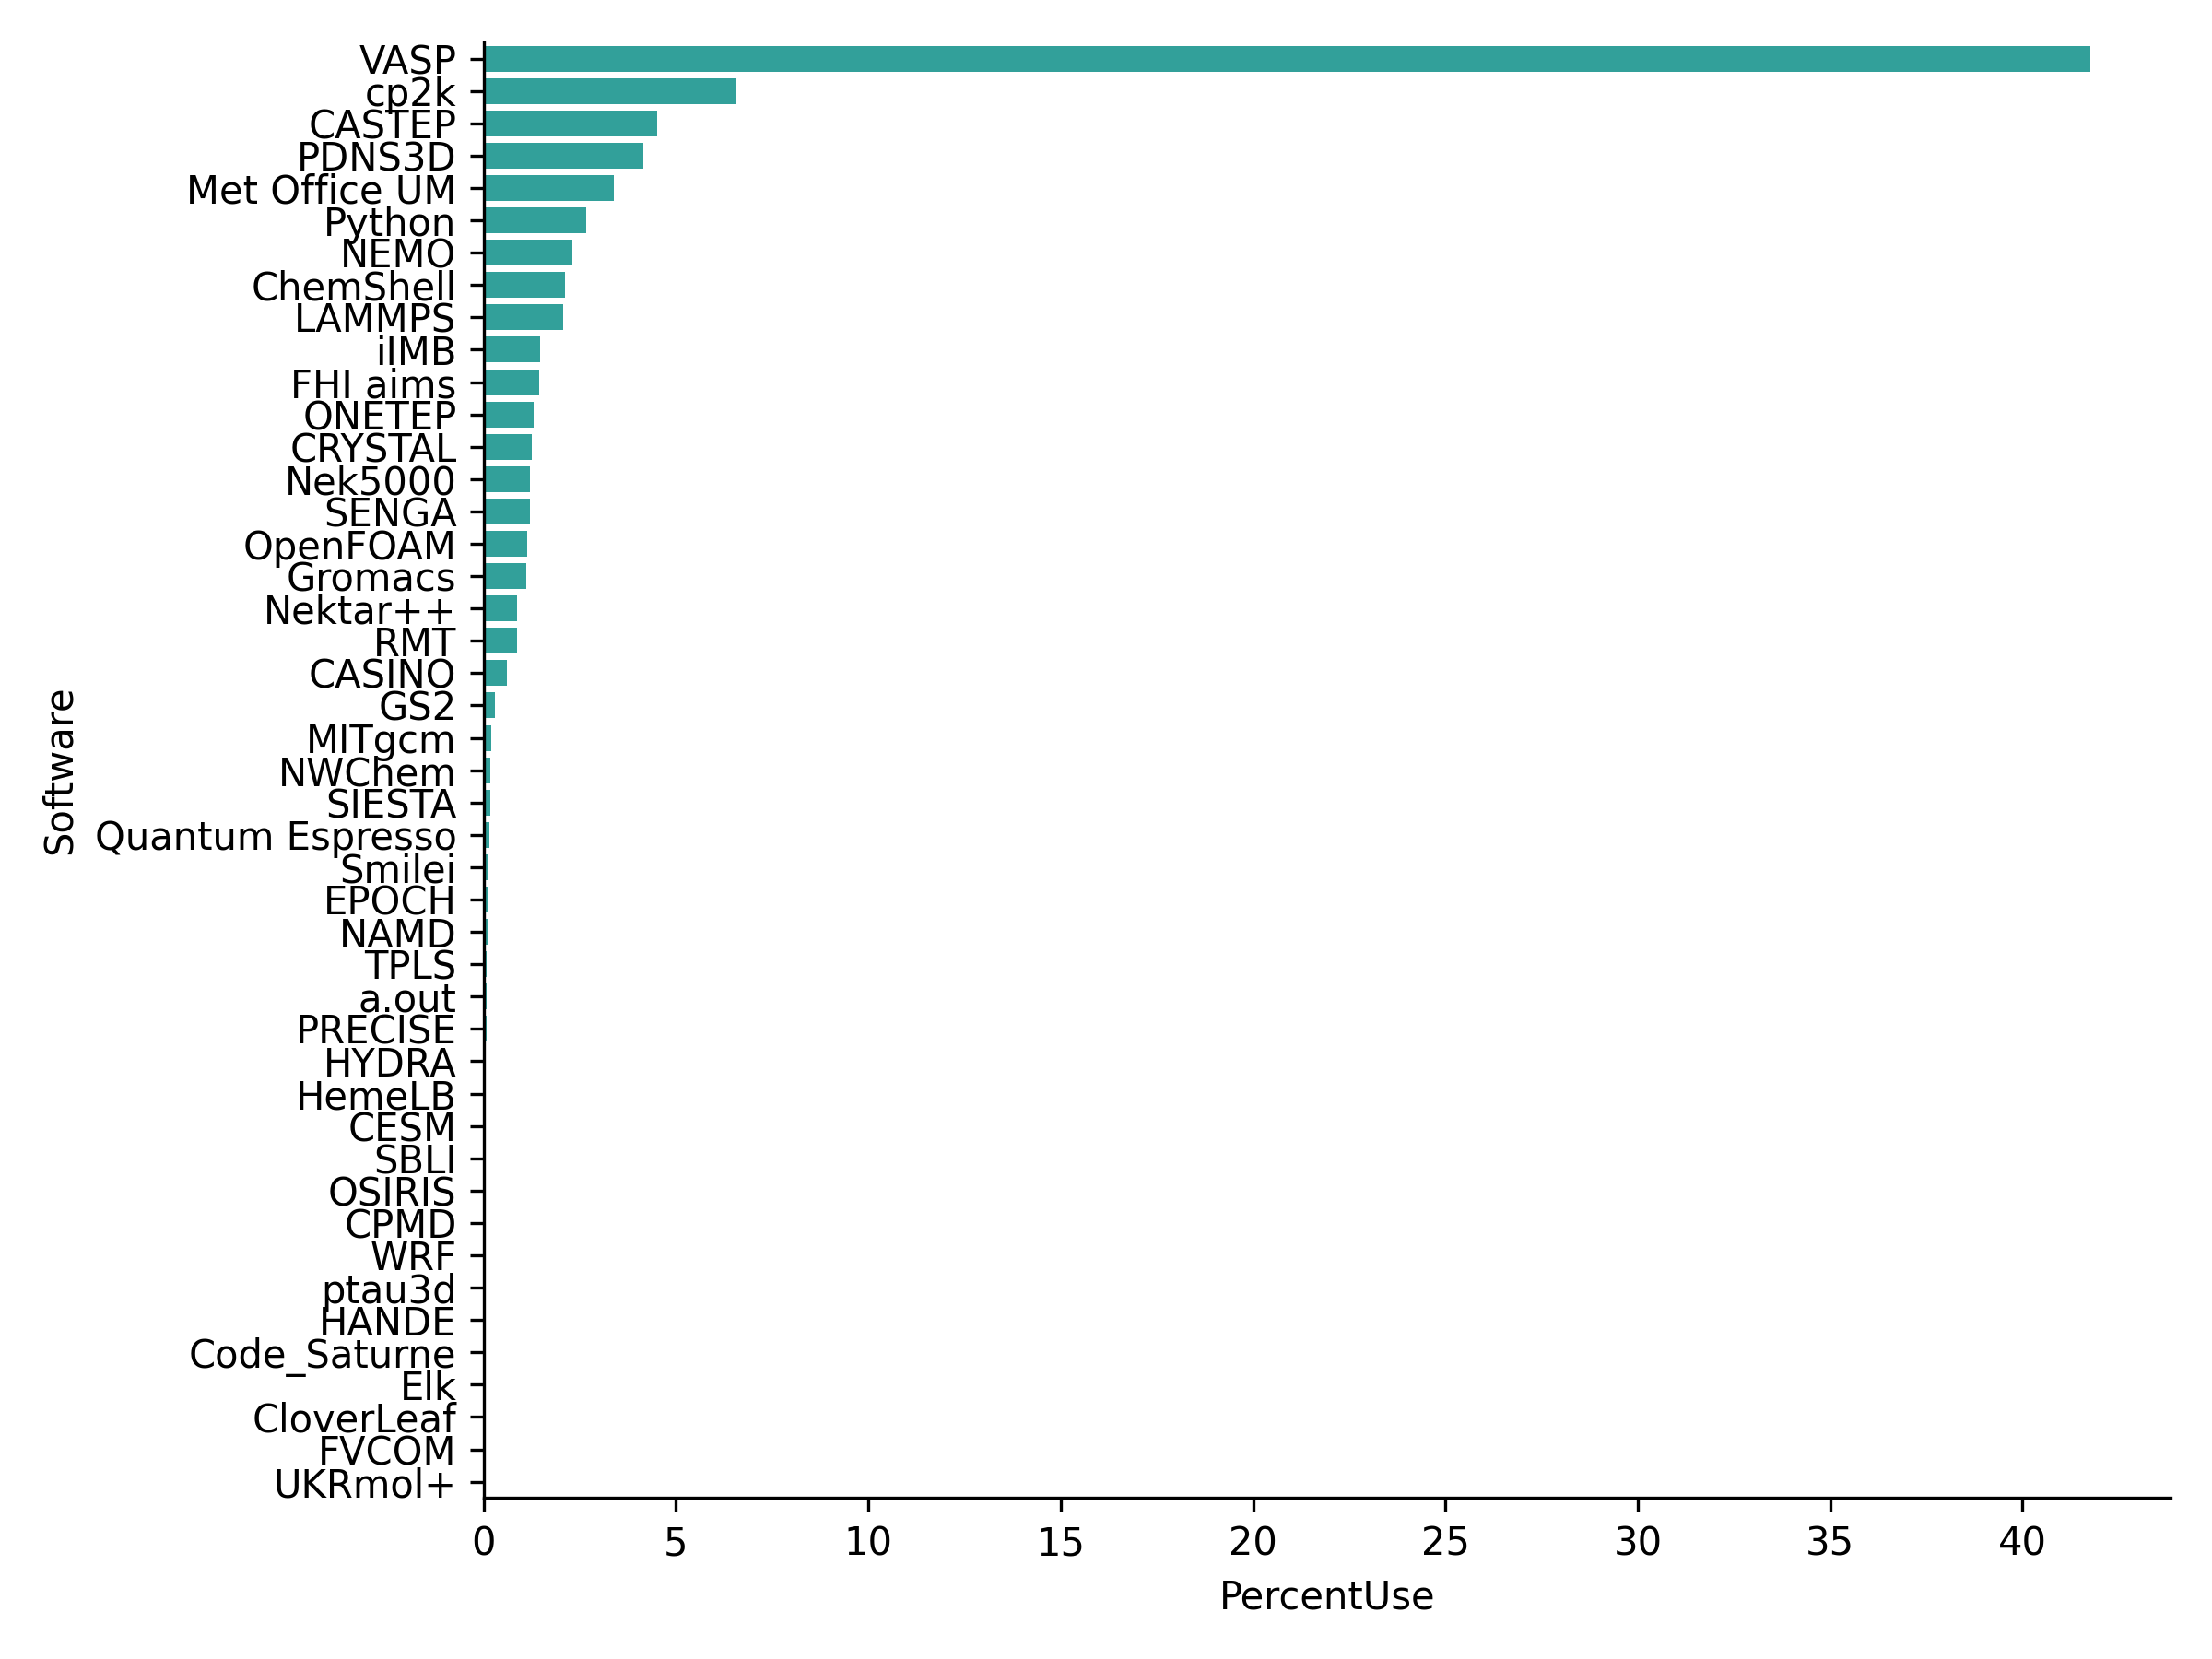
January 2022:
The table below compares the % usage for the top five codes in the two periods.
| Dec 2021 | Jan 2022 | ||
|---|---|---|---|
| Software | % Use | Software | % Use |
| VASP | 33.1 | VASP | 41.8 |
| PDNS3D | 9.1 | CP2K | 6.6 |
| LAMMPS | 5.4 | CASTEP | 4.5 |
| CP2K | 5.2 | PDNS3D | 4.1 |
| iIMB | 3.0 | Met Office UM | 3.4 |
For both periods, the most used software (by far!) is the VASP periodic electronic structure code which has use levels of 3-7× that of the next most used code. Two other codes, CP2K and PDNS3D, also appear in the top five most used software in both periods.
The table below compares statistics on job sizes (weighted by usage) for the two periods.
| Software | Min | Q1 | Median | Q3 | Max |
|---|---|---|---|---|---|
| Dec 2021 | 1 | 640.0 | 3072.0 | 6400.0 | 524288 |
| Jan 2022 | 1 | 512.0 | 2560.0 | 8192.0 | 524288 |
Both the lower quartile and median job sizes are slightly higher in the uncharged period (Dec 2021) but the upper quartile is higher in the charged period (Jan 2022). For both periods, the maximum job size run was just over half a million compute cores (in both cases, this very large job does not have an executable that is identified by the analysis tool). However, there is no huge difference between the job size statistics between the two periods.
Tables with the full code usage data for the two periods can be found below and CSV versions of the data are available:
Summary
We have developed an analysis tool to take data directly from Slurm, assign usage to different software used on ARCHER2 and produce usage and size statistics broken down by software. We have also updated the ARCHER2 status page to provide data on software usage over the past month and make historical usage data available. Finally, we compared usage data over the previous two months on ARCHER2 (one of which was uncharged and one of which was charged) and see little significant difference in software usage and job sizes.
Usage data
December 2021
| Software | Min | Q1 | Median | Q3 | Max | Jobs | % Use |
|---|---|---|---|---|---|---|---|
| Overall | 1 | 640.0 | 3072.0 | 6400.0 | 524288 | 2165760 | 100.0 |
| VASP | 3 | 256.0 | 1024.0 | 4096.0 | 43520 | 247933 | 33.1 |
| Unidentified | 1 | 1920.0 | 5184.0 | 16080.0 | 524288 | 83927 | 23.2 |
| PDNS3D | 2560 | 3200.0 | 6400.0 | 6400.0 | 32000 | 326 | 9.1 |
| LAMMPS | 1 | 2560.0 | 5120.0 | 8960.0 | 16384 | 5729 | 5.4 |
| CP2K | 1 | 256.0 | 1024.0 | 3200.0 | 262144 | 6283 | 5.2 |
| iIMB | 256 | 3072.0 | 4224.0 | 4608.0 | 8192 | 664 | 3.0 |
| CASTEP | 1 | 512.0 | 2048.0 | 2560.0 | 10240 | 1762102 | 2.9 |
| Python | 1 | 4096.0 | 16384.0 | 16384.0 | 65536 | 5118 | 2.5 |
| Nek5000 | 64 | 1280.0 | 2048.0 | 5120.0 | 12800 | 231 | 1.7 |
| OpenFOAM | 1 | 512.0 | 1280.0 | 2048.0 | 5120 | 1796 | 1.4 |
| Gromacs | 1 | 264.0 | 288.0 | 512.0 | 2304 | 18002 | 1.4 |
| NEMO | 1 | 2544.0 | 5040.0 | 5040.0 | 9728 | 5040 | 1.4 |
| ChemShell | 1 | 512.0 | 512.0 | 1024.0 | 2048 | 747 | 1.4 |
| FHI aims | 1 | 512.0 | 1024.0 | 1024.0 | 25600 | 16139 | 1.3 |
| EPOCH | 1 | 5760.0 | 32768.0 | 32768.0 | 65536 | 115 | 1.2 |
| Nektar++ | 128 | 8192.0 | 12288.0 | 12288.0 | 24576 | 126 | 1.1 |
| RMT | 1 | 1280.0 | 3712.0 | 6400.0 | 19584 | 479 | 0.8 |
| CRYSTAL | 8 | 2560.0 | 8192.0 | 32768.0 | 65536 | 363 | 0.7 |
| Met Office UM | 1 | 6464.0 | 12480.0 | 12480.0 | 262144 | 733 | 0.6 |
| ONETEP | 1 | 128.0 | 128.0 | 256.0 | 1024 | 2014 | 0.5 |
| PRECISE | 768 | 768.0 | 768.0 | 768.0 | 768 | 44 | 0.4 |
| SENGA | 64 | 16384.0 | 16384.0 | 16384.0 | 16384 | 20 | 0.3 |
| ptau3d | 80 | 192.0 | 512.0 | 512.0 | 512 | 8 | 0.3 |
| Quantum Espresso | 12 | 256.0 | 1024.0 | 1024.0 | 2048 | 3698 | 0.2 |
| Smilei | 128 | 2048.0 | 2048.0 | 2048.0 | 2048 | 287 | 0.2 |
| Code_Saturne | 4096 | 131072.0 | 131072.0 | 131072.0 | 262144 | 56 | 0.2 |
| MITgcm | 1 | 252.0 | 354.0 | 360.0 | 2000 | 1573 | 0.1 |
| NWChem | 28 | 512.0 | 768.0 | 768.0 | 1280 | 157 | 0.1 |
| HYDRA | 1 | 2560.0 | 2560.0 | 2560.0 | 2560 | 746 | 0.1 |
| GS2 | 256 | 2048.0 | 2048.0 | 2048.0 | 9216 | 751 | 0.1 |
| SIESTA | 8 | 640.0 | 640.0 | 640.0 | 768 | 39 | 0.1 |
| HemeLB | 128 | 1024.0 | 1280.0 | 1280.0 | 3072 | 21 | 0.1 |
| SBLI | 4096 | 131072.0 | 131072.0 | 131072.0 | 131072 | 8 | 0.0 |
| TPLS | 4 | 2048.0 | 18432.0 | 32768.0 | 32768 | 31 | 0.0 |
| AxiSEM3D | 64 | 128.0 | 128.0 | 384.0 | 768 | 14 | 0.0 |
| ECHAM | 384 | 384.0 | 384.0 | 384.0 | 384 | 19 | 0.0 |
| CESM | 64 | 512.0 | 512.0 | 512.0 | 768 | 48 | 0.0 |
| NAMD | 127 | 128.0 | 128.0 | 128.0 | 256 | 103 | 0.0 |
| DL_POLY | 4 | 256.0 | 512.0 | 512.0 | 512 | 70 | 0.0 |
| HANDE | 1 | 1.0 | 1.0 | 1.0 | 1 | 102 | 0.0 |
| WRF | 72 | 72.0 | 72.0 | 72.0 | 72 | 1 | 0.0 |
| CloverLeaf | 1 | 12.0 | 24.0 | 43.0 | 64 | 87 | 0.0 |
| FVCOM | 1 | 1.0 | 1.0 | 2.0 | 2 | 10 | 0.0 |
January 2022
| Software | Min | Q1 | Median | Q3 | Max | Jobs | % Use |
|---|---|---|---|---|---|---|---|
| Overall | 1 | 512.0 | 2560.0 | 8192.0 | 524288 | 1899000 | 100.0 |
| VASP | 1 | 1024.0 | 5120.0 | 9728.0 | 131072 | 672066 | 41.8 |
| Unidentified | 1 | 768.0 | 1536.0 | 6016.0 | 524288 | 599975 | 16.3 |
| CP2K | 1 | 160.0 | 640.0 | 1536.0 | 8192 | 13099 | 6.6 |
| CASTEP | 1 | 256.0 | 1024.0 | 2560.0 | 12800 | 553684 | 4.5 |
| PDNS3D | 3072 | 6400.0 | 32000.0 | 32000.0 | 32000 | 61 | 4.1 |
| Met Office UM | 1 | 6464.0 | 6464.0 | 6464.0 | 262144 | 4194 | 3.4 |
| Python | 1 | 1024.0 | 16384.0 | 16384.0 | 65536 | 6201 | 2.7 |
| NEMO | 1 | 2712.0 | 5040.0 | 6272.0 | 15232 | 5598 | 2.3 |
| ChemShell | 1 | 512.0 | 512.0 | 512.0 | 4096 | 819 | 2.1 |
| LAMMPS | 1 | 256.0 | 384.0 | 5120.0 | 8960 | 2369 | 2.1 |
| iIMB | 128 | 2688.0 | 4224.0 | 4224.0 | 6912 | 234 | 1.5 |
| FHI aims | 1 | 128.0 | 256.0 | 1024.0 | 4096 | 18665 | 1.4 |
| ONETEP | 1 | 160.0 | 256.0 | 256.0 | 1024 | 2769 | 1.3 |
| CRYSTAL | 1 | 4096.0 | 8192.0 | 8192.0 | 16384 | 281 | 1.2 |
| Nek5000 | 64 | 1280.0 | 2048.0 | 2560.0 | 7680 | 218 | 1.2 |
| SENGA | 80 | 1440.0 | 7680.0 | 7680.0 | 16384 | 92 | 1.2 |
| OpenFOAM | 1 | 512.0 | 512.0 | 2048.0 | 5120 | 827 | 1.1 |
| Gromacs | 1 | 264.0 | 1408.0 | 1536.0 | 8192 | 5259 | 1.1 |
| Nektar++ | 1 | 6144.0 | 12288.0 | 12288.0 | 15360 | 134 | 0.9 |
| RMT | 1 | 1280.0 | 3456.0 | 6400.0 | 20000 | 644 | 0.9 |
| CASINO | 128 | 512.0 | 1024.0 | 1024.0 | 1280 | 248 | 0.6 |
| GS2 | 32 | 1536.0 | 1536.0 | 2048.0 | 8192 | 2006 | 0.3 |
| MITgcm | 2 | 252.0 | 354.0 | 354.0 | 2000 | 6193 | 0.2 |
| NWChem | 128 | 640.0 | 768.0 | 768.0 | 1024 | 295 | 0.2 |
| SIESTA | 16 | 1920.0 | 2560.0 | 2560.0 | 5120 | 41 | 0.2 |
| Quantum Espresso | 5 | 128.0 | 256.0 | 1024.0 | 2048 | 1854 | 0.2 |
| Smilei | 1024 | 2048.0 | 2048.0 | 2048.0 | 2048 | 95 | 0.1 |
| EPOCH | 128 | 4096.0 | 16384.0 | 16384.0 | 65536 | 474 | 0.1 |
| NAMD | 128 | 1600.0 | 1600.0 | 1600.0 | 1600 | 70 | 0.1 |
| TPLS | 1 | 18432.0 | 49152.0 | 49152.0 | 49152 | 71 | 0.1 |
| PRECISE | 512 | 768.0 | 768.0 | 768.0 | 3072 | 28 | 0.1 |
| HYDRA | 1 | 1024.0 | 2560.0 | 2560.0 | 5120 | 74 | 0.1 |
| HemeLB | 128 | 512.0 | 512.0 | 512.0 | 1024 | 52 | 0.0 |
| CESM | 64 | 512.0 | 1024.0 | 1024.0 | 2048 | 114 | 0.0 |
| SBLI | 512 | 4096.0 | 4096.0 | 4096.0 | 4096 | 21 | 0.0 |
| OSIRIS | 1280 | 1280.0 | 1280.0 | 1280.0 | 1280 | 3 | 0.0 |
| CPMD | 128 | 128.0 | 128.0 | 128.0 | 512 | 94 | 0.0 |
| WRF | 72 | 2048.0 | 2048.0 | 2048.0 | 2048 | 41 | 0.0 |
| ptau3d | 80 | 80.0 | 80.0 | 80.0 | 80 | 2 | 0.0 |
| HANDE | 1 | 1.0 | 1.0 | 1.0 | 1 | 19 | 0.0 |
| Code_Saturne | 128 | 128.0 | 128.0 | 128.0 | 128 | 7 | 0.0 |
| Elk | 16 | 16.0 | 16.0 | 16.0 | 16 | 1 | 0.0 |
| CloverLeaf | 128 | 128.0 | 128.0 | 128.0 | 128 | 1 | 0.0 |
| FVCOM | 1 | 1.0 | 1.0 | 2.0 | 2 | 6 | 0.0 |
| UKRmol+ | 2 | 2.0 | 2.0 | 2.0 | 2 | 1 | 0.0 |