
1. The reflected shock-wave
Dr Jian Fang, Scientific computing department, STFC Daresbury Laboratory
The animation shows the results from a direct-numerical simulation of the cold supersonic flow in the combustor of a model scramjet. The cavity on the bottom wall is to hold the flame. The turbulent coherent structures are visualised with the isosurfaces of swirling strength, λci, coloured with local temperature. The shock-waves/compression-waves are represented with the isosurfaces of pressure gradient. It is interesting to see that the impingement of the shear-layer with the ramp of the cavity creates an oblique shock-wave, which bounces between the upper and bottom walls.

2. Imaging the source of great Tsunami earthquakes (Subduction of the Pacific Plate below the Australian Plate)
Dr Richard Davy, Imperial College London, Department of Earth Science and Engineering.
This image shows the subduction of the Pacific Plate below the Australian Plate, forming New Zealand’s North Island. This subduction zone produces a wide range of earthquakes, some with the ability to generate dangerous Tsunami, and others that slip by unnoticed by humans. We produced models and images of this subduction zone using ARCHER2, to help us further understand what is controlling these earthquakes. In this image, we can see seismic velocities (indicated by colours) overlying the imaged fault structure of the subduction zone (greyscale image). Interestingly, we observe low velocities on the main fault (which dips down to the left) that separates the two tectonic plates. We interpret these low velocities to indicate the presence of fluids that would facilitate long and slow earthquakes, while the presence of submarine mountains (such as the one imaged on the right edge of the coloured zone) would promote large Tsunami earthquakes.
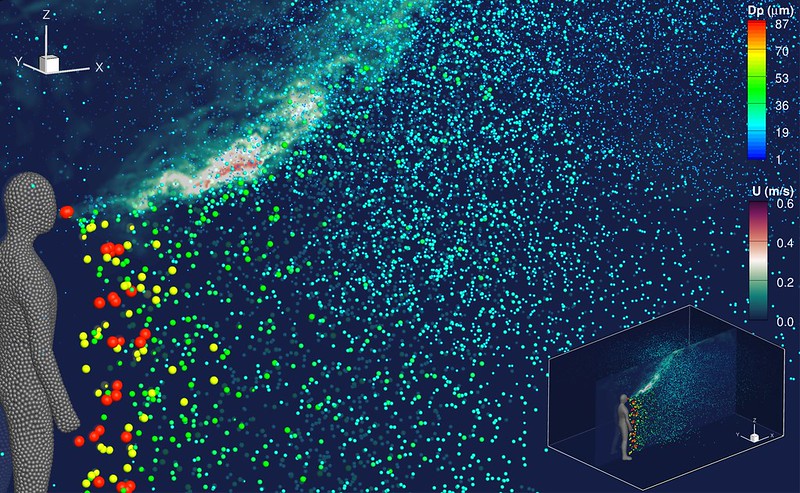
3. Expiratory particle dispersion by turbulent exhalation jet during speaking
* * * Winning Image and overall competition winning entry * * *
Aleksandra Monka, University of Birmingham, Department of Civil Engineering
The image reveals the extent of expiratory particle dispersion by the turbulent exhalation jet during speaking, with this high-resolution simulation run on the ARCHER2 system. A 3D overview figure of the whole room is shown in the bottom right-hand corner for spatial context. The particle’s ability to stay airborne is affected by its diameter: the largest particles (red and yellow) fall out close to the speaking person, while the smaller ones (blue) are entrained into the exhalation jet and transported throughout the room. The aim of the research is to develop a numerical tool to predict accurately the spread of airborne pathogens carried by very small expiratory particles in different indoor environments. The novelty of this work lies in the ability to determine and quantify the spatiotemporal distribution of airborne pathogens and the infection risk in different indoor scenarios, considering the turbulent mixing of particles on their spread.

4. Ray-traced Cloud Development Simulation Video
Domantas Dilys, University of Leeds, School of Earth and Enviroment
In the animation, an idealised cloud is shown, which is produced by a rising warm and moist air mass. There are seven timesteps, showing cloud development over time. Simulation was produced using a revolutionary parcel-based cloud model developed by the University of St Andrews, the University of Leeds and EPCC. The model, PMPIC, was parallelised in an eCSE project (eCSE12-10), and run on ARCHER2. During 2022 Summer Visualisation Internship, the video was produced on the GPU-enabled Faculty of Engineering Linux system at the University of Leeds. Volume rendering capabilities of ParaView, in particular, Intel® OSPRay path-tracer was used for realistic lighting and self-shadowing. The cover image has slightly increased contrast by post-processing, but the video remains the original output of ParaView.

5. Ray-traced Cloud Development Simulation Image
Domantas Dilys, University of Leeds, School of Earth and Enviroment
In the image, an idealised cloud is shown, which is produced by a rising warm and moist air mass. Simulation was produced using a revolutionary parcel-based cloud model developed by the University of St Andrews, the University of Leeds and EPCC. The model, PMPIC, was parallelised in an eCSE project (eCSE12-10), and run on ARCHER2. During 2022 Summer Visualisation Internship, the image was produced on the GPU-enabled Faculty of Engineering Linux system at the University of Leeds. Volume rendering capabilities of ParaView, in particular, Intel® OSPRay path-tracer was used for realistic lighting and self-shadowing. The shadows appear for any region of the cloud, as rays shoot in the direction of the light source, determining if that region is obstructed from light source or not. The image has slightly increased contrast by post-processing.

6. Cloud Development - Cross-section View
Domantas Dilys, University of Leeds, School of Earth and Enviroment
In the animation, an idealised cloud is shown, which is produced by a rising warm and moist air mass. There are seven timesteps, showing cloud development over time. Simulation was produced using a revolutionary parcel-based cloud model developed by the University of St Andrews, the University of Leeds and EPCC. The model, PMPIC, was parallelised in an eCSE project (eCSE12-10), and run on ARCHER2. During 2022 Summer Visualisation Internship, the video was produced on the GPU-enabled Faculty of Engineering Linux system at the University of Leeds. Volume Rendering capabilities of ParaView, as well as custom cross-section filter made it possible to obtain a unique perspective of the inside of the cloud, as it is developing. The colours show the liquid water content, from blue to red signifying low-to-high liquid content.

7. Simulation of 3D calving dynamics at Jakobshavn Isbrae
Iain Wheel, University of St Andrews, School of Geography and Sustainable Development
Calving is the breaking off of icebergs at the front of tidewater glaciers (those that flow into the sea). It accounts for around half of the ice mass loss from Greenland so is extremely important in the context of sea level rise. Of particular interest is Greenland's largest glacier, Jakobshavn Isbrae, which accounts for a fifth of the mass loss from the whole ice sheet. Using the open source finite element model, Elmer/Ice and a novel 3D calving algorithm, the video shows the evolution of the terminus of Jakobshavn Isbrae over 100 days of summer 2017.

8. Direct numerical simulation (DNS) of flow past a vertical plate in a transitional phase
Prof. Jae-Wook Kim, University of Southampton / Aeronautics & Astronautics
Iso-contours of spanwise vorticity showing the first vortex shedding (due to the instability of a recirculation bubble) and the development of the periodic shedding modes in the initial stage of flow past a vertical plate. Direct numerical simulation (DNS) using Compressible Aerodynamics & Aeroacoustics Research coDe (CANARD) at Re=2,000 and M=0.25.
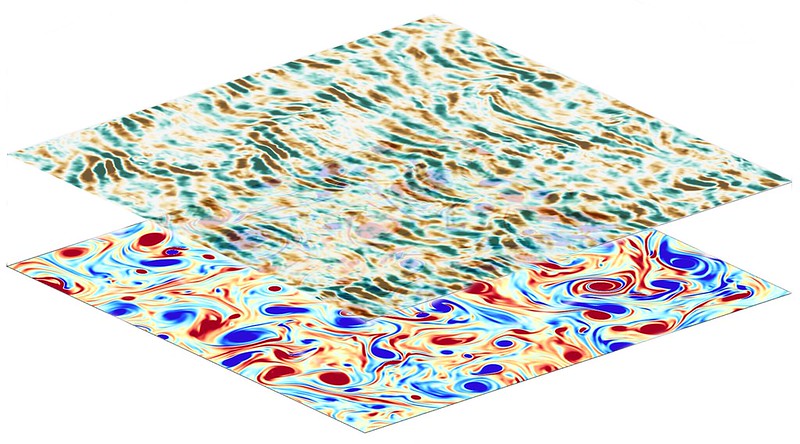
9. Scattering of waves by turbulent vortices in geophysical fluids
Dr Hossein Kafiabad, School of Mathematics, University of Edinburgh
When the waves travel in the atmosphere and ocean interior, they get scattered by the vortices leading to changes in their direction and wavelength. These changes are not random and can be quantified using mathematical tools developed for wave and fluid dynamics. The aim of this project was to theoretically find the statistics of waves (like their distribution in wavenumber space) shaped by their interactions with vortices and then compared them with the Direct Numerical Simulations of Boussinesq equations. Starting with a plane wave travelling through a fully developed turbulent background, we expect the wave to lose its preferred diction and develop small scale features. This figure shows a horizontal slice of this 3D flow for two fields: vertical vorticity of the background flow (bottom) and vertical velocity of the waves (top). The deformation of the initially plane wave is observed as result of its interaction with vortices.

10. Scattering in real space, diffusion in wavenumber space
Dr Hossein Kafiabad, School of Mathematics, University of Edinburgh
When the waves travel in the atmosphere and ocean interior, they get scattered by the vortices leading to changes in their direction and wavelength. If the background vortices are isotropic (do not have a preferred direction) and evolve on much slower time scale than that of waves, we have shown that the wave energy in wavenumber space diffuses on a cone, which is pictured in this figure. In the top panel the vertical velocity of waves for horizontal slice of a 3D flow is shown where the time increase from left to right, and in the bottom the corresponding wave energy in wavenumber space is shown. The wave field is extracted from a Boussinesq simulation. The initial condition of this simulation is a plane wave (the top left panel) superimposed on a fully-developed turbulent flow.

11. Marine plastic pollution in the Indian Ocean
Noam Vogt-Vincent, Department of Earth Sciences, University of Oxford
Marine plastic pollution is an enormous environmental problem facing our ocean. There are many remote islands in the southwestern Indian Ocean, many of which are sparsely populated with little-to-no local sources of pollution, yet are accumulating enormous quantities of plastic waste on their beaches. This animation shows the results of a simulation incorporating plastic waste entering the ocean from both coasts and beaches, and the effects of ocean currents, winds, waves, debris sinking, and beaching. Although some waste is generated within the western Indian Ocean, most pollution reaching remote western Indian Ocean islands may actually originate from southeast Asia, transported over thousands of kilometres through westward ocean currents and monsoonal winds. If you look carefully, you can also see a seasonal cycle driven by the monsoonal winds, where debris is most likely to reach more southerly islands in Seychelles during the months of January-April.

12. One year in the southwestern Indian Ocean
* * * Winning Video * * *
Noam Vogt-Vincent, Department of Earth Sciences, University of Oxford
This video shows one year of sea-surface temperatures from WINDS-C, a 1/50° (c. 2km) resolution ocean model that covers almost all coral reefs in the southwestern Indian Ocean (SWIO). We have used this model (run on ARCHER2) to assess coral reef connectivity through larval dispersal on multi-decadal timescales across the SWIO. This video was made by rendering sea-surface temperature as a shaded height-map (as well as a traditional colourmap), which does a great job of emphasising flow across scales from 10s - 1000km. In this video, you can clearly see the major features of ocean circulation in the SWIO, such as the Southern Equatorial Current transporting water westwards towards Madagascar, which then intensifies into the rapid North Madagascar Current (flowing towards East Africa and shedding many eddies) and East Africa Coastal Current, which races northwards along the East African coast.
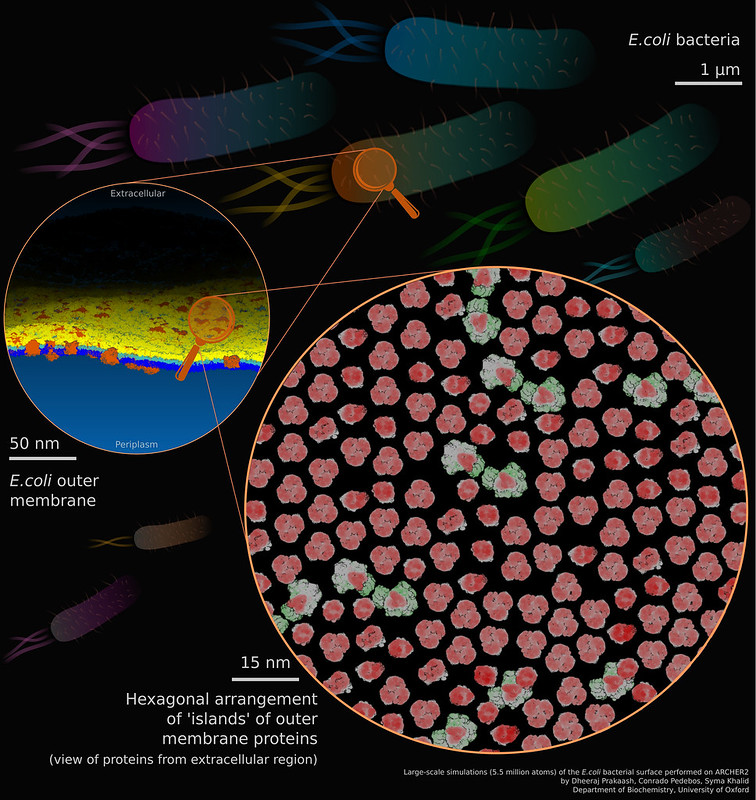
13. The organisation of protein islands on the E.coli bacterial outer membrane
Dr Dheeraj Prakaash, Department of Biochemistry, University of Oxford
Escherichia coli is a Gram-negative bacterium. The outer membrane, which surrounds the bacterium, is composed of proteins (shown in orange in the initial magnification; red-green (low-high) depth gradient in the final magnification) embedded within lipopolysaccharide (LPS) molecules in the outer leaflet (yellow and light blue layers) and phospholipids in the inner leaflet (dark blue layer). LPS acts as a barrier restricting the entry of a large number of molecules such as antibiotics. Our simulations contributed to a multidisciplinary study which showed the spatial organisation of the outer membrane to be different from textbook models. Rather than a uniform distribution of proteins and lipids, there are distinct regions enriched in proteins (termed 'islands') and regions occupied largely by lipids. The magnified images were rendered using Visual Molecular Dynamics while the remainder of the image was created using Inkscape. Molecular Dynamics simulations on ARCHER2 were performed using the Gromacs 2021 package.
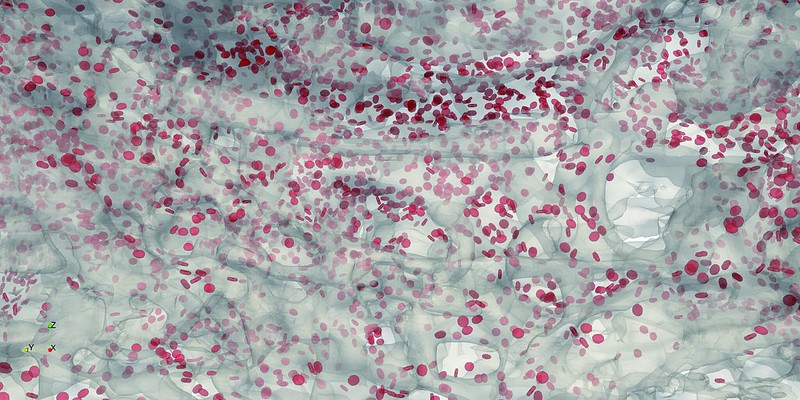
14. Maternal blood flow through the intervillous space of human placenta
Dr Qi Zhou, The University of Edinburgh, School of Engineering, Institute for Multiscale Thermofluids
A snapshot of the maternal blood flow simulated using the immersed-boundary-lattice-Boltzmann method as a suspension of deformable red blood cells through the extravascular intervillous space of the human placenta. The simulation domain is reconstructed based on a realistic tissue volume (0.48mmx1.15mmx0.46mm) extracted from a term placenta after delivery. These cellular blood flow simulations are performed with HemeLB (a high-performance parallel lattice-Boltzmann code for large scale fluid flow in complex geometries), enabled by ARCHER2 supercomputing time through the UK Consortium on Mesoscale Engineering Sciences. Our project (supported by UKRI EPSRC EP/T008725/1, EP/T008806/1) sets out to develop a robust framework for image-based modelling of blood flow and solute exchange in patient-specific placentas, aimed at elucidating the structure-function relationship between the anatomical changes and compromised nutrient transport during placental disorders. The outcome of the project will inform effective clinical management and interventions of prevalent pregnancy diseases such as pre-eclampsia and fetal growth restriction.
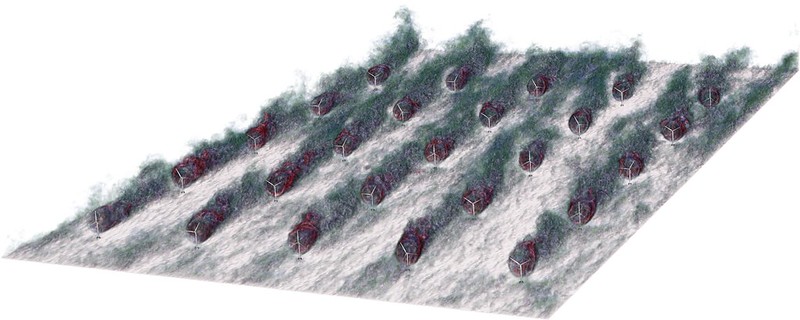
15. Flow within and around a large wind farm
* * * Winning Early Career entry * * *
Dr Nikolaos Bempedelis, Imperial College London, Department of Aeronautics
Modern large-scale wind farms consist of multiple turbines clustered together in wind-rich sites. Turbine clustering suffers some drawbacks, as downstream turbines operate within the wake of upstream ones, resulting in the reduction of their power output due to wind speed deceleration and the increase of fatigue loads due to increased wind fluctuations. High-fidelity turbulence-resolving simulations allow us to study the dynamics of the interacting turbine wakes, providing insight into complex flow phenomena such as wake meandering, tip and hub vortex breakdown, and the interaction of the wind farm with the atmospheric boundary layer. The data was generated with the open-source flow solver Xcompact3D on ARCHER2.

16. Proton tunnelling during DNA strand separation
Max Winokan, University of Surrey, Quantum Biology DTC
Proton transfer between the DNA bases can lead to mutagenic Guanine-Cytosine tautomers. Over the past several decades, a heated debate has emerged over the biological impact of tautomeric forms. In our work, we determine that the energy required for generating tautomers radically changes during the separation of double-stranded DNA. Our results demonstrate that the unwinding of DNA by a helicase enzyme could significantly enhance the stability of tautomeric base pairs and provide a feasible pathway for DNA spontaneous mutations. This image shows the site of such a double proton transfer in a G-C base pair within the nucleic acid duplex. To produce the image atomic coordinates were taken from molecular dynamics simulations before being rendered in VMD. A Van der Waals envelope was added to show the atoms used in quantum chemical models. The image has been further altered in Photoshop to highlight the delocalised nature of the protons.
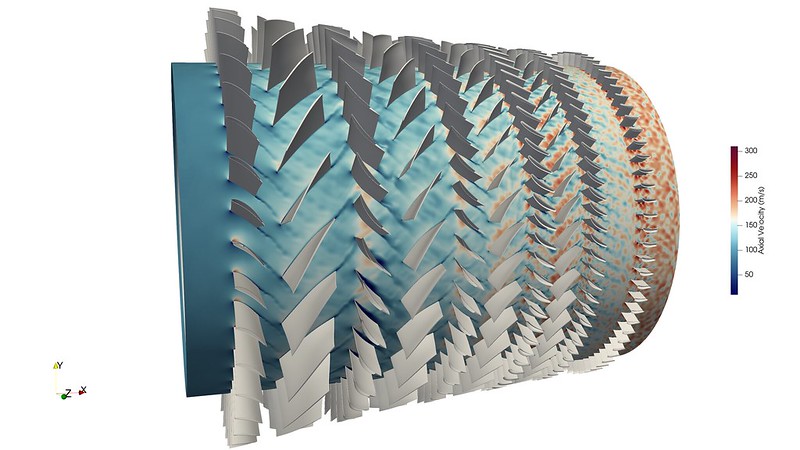
17. Axial velocity contours showing wakes from stator and rotor blades of a DLR research compressor
Dr Arun Prabhakar, University of Warwick, Department of Computer Science
The visualization is produced from a simulation of a research compressor, RIG250 from the German Aerospace Centre(DLR), using a mesh consisting of 4.58 billion elements. It shows the axial velocity contours that illustrate the wakes forming from the stator and rotor blades of the compressor. The snapshot is taken at a physical time equivalent to 1 revolution of the compressor. Rolls-Royce's in house production CFD solver, Hydra, is used to solve the Unsteady Reynolds Averaged Navier-Stokes equations. The flow in the domain is highly turbulent and is predicted using the Spalart-Allmaras turbulence model with wall functions. In situ visualization is carried out using Rolls-Royce's SS02 code, based on ParaView. This large scale simulation denotes a step towards virtual certification of gas turbine engines.

18. Iso-Surfaces of Lambda2 showing wake formation from stator blades of a DLR research compressor
Dr Arun Prabhakar, University of Warwick, Department of Computer Science
The visualization is acquired from a simulation of a research compressor, RIG250 from the German Aerospace Centre(DLR), using a mesh consisting of 654 Million elements. It depicts the unsteady vortex shedding behavior from a row of stator blades. Rolls-Royce's in house production CFD solver, Hydra, is used to solve the Unsteady Reynolds Averaged Navier-Stokes equations. The flow in the domain is highly turbulent and is predicted using the Spalart-Allmaras turbulence model with wall functions. The visualization shows iso-surfaces of wakes computed using a parameter called Lambda2. The resulting iso-surfaces are colored with the axial velocity of the flow. In situ visualization is carried out using Rolls-Royce's SS02 code, based on ParaView. This large scale simulation denotes a step towards virtual certification of gas turbine engines.

19. Acetylene Molecule subject to intense ultra-fast laser pulse, time evolution of electron probability, sound
Dale Hughes, Queen's University Belfast, Physics
The movie is a straightforward plot of electron density, derived from substantial Time-Dependent Density Functional Theory calculations carried out in recent months on ARCHER2. The sound is derived from the oscillating electric field induced by the laser interaction, and is unprocessed. In this simulation, we have directed a 50 terawatt, 30 femtosecond(fs) ultraviolet laser pulse along the molecular axis of a single Acetylene molecule, and allowed the time evolution to continue for over 600fs. From around 100fs onwards, we see a significant oscillation, termed a dipole instability, that has increased in magnitude exponentially since the end of the initial pulse (30fs) until it is of comparable magnitude to the initial pulse. It reaches its peak as the population inversion induced by the initial pulse ends, as the electron excited by the pulse recombines with its hole. This dipole instability is the current subject of our work with ARCHER2.

20. Acetylene Molecule subject to intense ultra-fast laser pulse, time evolution of electron probability, sound
Dale Hughes, Queen's University Belfast, Physics
The movie is a straightforward plot of electron density, derived from substantial Time-Dependent Density Functional Theory calculations carried out in recent months on ARCHER2. The sound is derived from the oscillating electric field induced by the laser interaction, and is unprocessed. In this simulation, we have directed a 1 femtosecond(fs) ultraviolet laser pulse along the molecular axis of a single Acetylene molecule, and allowed the time evolution to continue for around 1000fs. We immediately see significant oscillation, and at around 500fs we begin to hear a new oscillation, termed a dipole instability, that has increased in magnitude exponentially since the end of the initial pulse (1fs) until it is of comparable magnitude to the initial pulse. It reaches its peak as the population inversion induced by the initial pulse ends, as the electron excited by the pulse recombines with its hole. This dipole instability is the current subject of our work with ARCHER2.
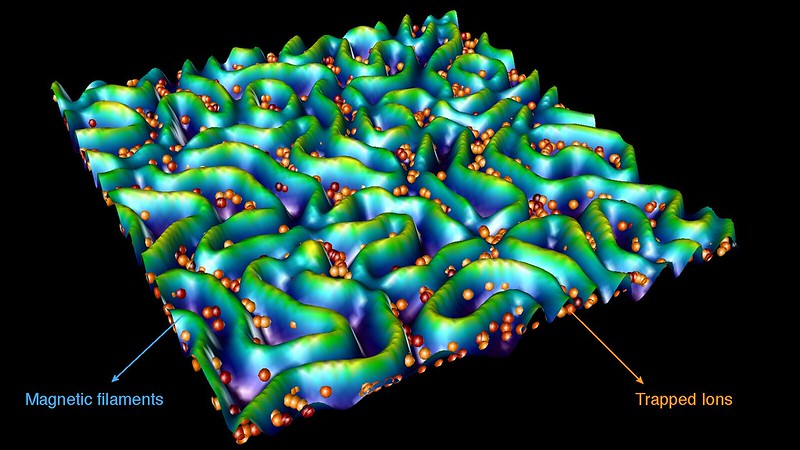
21. Magnetic field filaments generated by the current filamentation instability
Dr Elisabetta Boella, Lancaster University, Physics Department
One of the long-standing questions in plasmas physics, the science that studies ionized gases called plasmas, regards the origin and evolution of magnetic field in plasmas where such field is initially absent. The question has implications in astrophysics, where the origin of the universe magnetic field is still unknown, and in laboratory plasmas, where magnetic fields spontaneously arise from laser-matter interaction. The Current Filamentation Instability is one of the few mechanisms able to produce a strong magnetic field in an unmagnetised plasma. In the presence of two counter streaming plasma flows and some infinitesimal perturbations, the Lorentz force will deflect the trajectory of the plasma particles in such a way as to cause the formation of net micro-currents and magnetic field filaments. The picture shows the field generated by the instability (blue-green) and ions (orange-red) trapped in the magnetic field filaments. This is the result of a plasma simulation performed with the massively parallel code ECsim on ARCHER2.

22. The self-amplification and the structured chaotic sea
Juan Carlos Bilbao-Ludena, Imperial College London
The picture shows the instantaneous generation of strain (light blue) by the mechanism of self-amplification of strain (purple contour) in a turbulent flow generated by a wing. A nonlinear process distinctive to turbulence. The contour slices show the values of the alignments of the vorticity vector and the intermediate eigenvector of the strain. This alignment plays a crucial role in the magnitude of vortex stretching, a process that regulates and contributes to the generation of strain.
The present simulation was obtained with the parallel code Pantarhei on Archer2 which enabled us to have access to novel geometrical features of turbulence which can help us understand better their complex structure. Particularly, in flows of industrial relevance far from isotropic/homogeneous assumptions which would help us elucidate the origins of the small-scale dynamics.