
1. Stratospheric ozone depletion & recovery from 1960-2100
Dr. Nathan Luke Abraham, National Centre for Atmospheric Science & University of Cambridge, Department of Chemistry
Following the discovery of the ozone hole in the 1980s, the Montreal Protocol was enacted to limit the release of harmful man-made pollutants that destroy stratospheric ozone. As part of of the Chemistry-Climate Model Initiative (CCMI), past depletion and future recovery of ozone has been investigated using the United Kingdom Chemistry & Aerosols (UKCA) Chemistry-Climate Model, a configuration of the Met Office Unified Model, with this particular simulation running from 1960 to 2100. The video shows the time evolution of the March and October total integrated atmospheric ozone column, highlighting the reduction in the recent past and subsequent increase over the coming century. The model data was processed using the Iris and Matplotlib Python libraries, ImageMagick, and FFmpeg. This simulation was performed on ARCHER, and data from the University of Cambridge UKCA simulations are available via the British Atmospheric Data Centre as part of the CCMI archive.

2. The Many Faces of Heterogeneous Ice Nucleation Unmasked By Computer Simulations
Martin Fitzner, Department of Physics and Astronomy, University College London
This video shows heterogeneous ice nucleation - a phenomenon governing numerous processes ranging from cloud formation to cell-freezing in cryobiology - happening at the molecular scale. It is most challenging to obtain such insight from experiments, thus our computer simulations provide a molecule's eye view of the process where liquid water (red spheres) freezes into ice (blue spheres and bonds). We show that this process happens not in the liquid itself but rather at an interface with a foreign material (gray spheres). We studied the influence of the properties of the material that is in contact with the water and find a staggering sensitivity on its atomistic structure where even tiny changes lead to different freezing rates and ice structures ("crystal faces") forming on top of the surface. Our findings contribute to the effort aimed at one day being able to design materials that facilitate or avoid the formation of ice.

3. Ischemia-induced ventricular fibrillation
Hector Martinez-Navarro, Computational Cardiovascular Science group, University of Oxford
This video has been rendered based on the results obtained from a highly-detailed computer simulation of human cardiac electrophysiology. We used a torso/heart tridimensional multiscale model created from computer tomography scan images. It includes realistic cell membrane kinetics and has been validated against clinical data.
For this simulation, we modelled coronary occlusion leading to ischemia in certain region of the myocardial tissue. Three regular beats were simulated and then a premature stimulus was induced triggering a re-entrant wave which leaded to ventricular fibrillation.
The use of computer models for medical science offers a very powerful alternative experimental data is not available due to technical or ethical limitations. Our aim is to provide risk assessment for ischemic patients and investigate drug safety and efficacy under these circumstances using High Performance Computing.

4. Thermal plumes in thermally driven turbulence
* * * Winning Image entry * * *
Xiaojue Zhu, Physics of Fluids Group, University of Twente
This image shows the structures of three-dimensional turbulent thermal plumes in a box heated from below and cooled from the top, which is a simple model for the natural convection systems, such as those present in geo- and astro-physics. Turbulent thermal plumes are generated on the plates, forming the large scale rolls, mimicking the wind in Nature. This direct numerical simulation was performed on ARCHER with 1 billion grid points in a highly turbulent flow system.
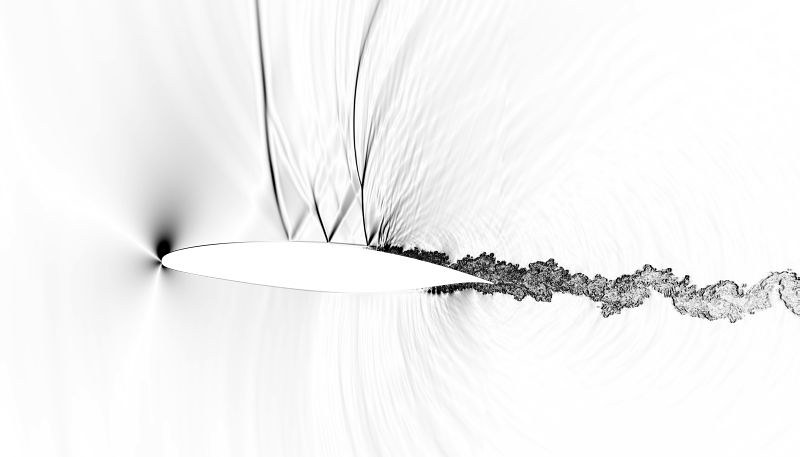
5. Density gradient for an airfoil at a Mach number of Ma=0.7 and a Reynolds number of Re=500000.
Markus Zauner, AFM Group, University of Southampton
This image shows a schlieren-like illustration of the streamwise density gradient of the flow around a wing-section at a free-stream Mach number of Ma=0.7 and a Reynolds number of Re=500,000. Schlieren pictures are commonly used in experiments to visualise shock waves. In this case, the flow field is generated by a simulation solving the compressible 3D Navier Stokes equations directly. The high resolution of the domain (1 billion grid points) requires more than 30,000 processors for running the simulation on ARCHER. The black regions in the image indicate high local density gradients caused by vortex structures in the wing aft section and the wake. In those regions we can see weak accoustic waves being generated. As the flow goes supersonic on the upper side, we can observe the formation of upstream travelling shock waves as well.

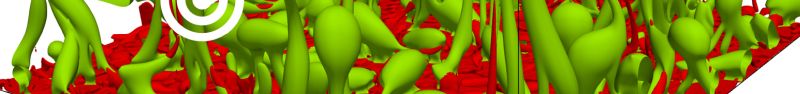
6. This image shows vortex stuctures in the transition region on the suction-side surface of a transonic airfoil.
Markus Zauner, AFM Group, University of Southampton
This image shows the transition region on the suction-side surface of an aircraft wing-section. Coherent vortices are identified by Q-criteria surfaces, which is a well established method in the field of computational fluid dynamics. The iso-surfaces are coloured by their local vorticity magnitude, where yellow suggests high vorticity, while light blue denotes lower vorticity levels. A rapid turbulent breakdown can be observed after near-wall streaks are stretched by big 2D vortex sturctures. The presented snapshot is taken from a 3D direct numerical simulation of an airfoil in a transonic free-stream at Mach 0.7, considering a Reynolds number of 500,000. The spanwise periodic domain extent is a quarter of the axial chord length resulting in a grid that consists of more than 5 billion cells. The simulation is carried out on ARCHER using more than 60,000 cores.

7. Movie showing pressure gradients and vortical structures around a transonic wing section.
Markus Zauner, AFM Group, University of Southampton
This animation visualises vortex structures in the flow around an aircraft wing-section at a free-stream Mach number of Ma=0.7 and a Reynolds number of Re=500,000. Firstly, the movie highlights strong vorticity in blue and red, suggesting clockwise and anti-clockwise rotating vortices respectively. The black regions in the background indicate strong local pressure gradients. The formation of up-stream moving shock-waves over the upper surface can be observed near the trailing edge. The second part illustrates the 3D structure of the vortices, showing the so-called Q-criteria surfaces, based on a mathematical formulation to describe vortices. The data is obtaind by one of the largest direct numerical simulations to date. The grid consists of more than 1 billion cells and the time step is in the order of 10 nano seconds. The limitations due to memory and computational resources are challenging in respect to visualisation of 3D structures and their temporal behaviour.

8. Turbulent breakdown at the rear section of a wing section at transonic flow conditions.
Markus Zauner, AFM Group, University of Southampton
This picture shows the rear section of an airfoil at a Mach and Reynolds number of Ma=0.7 and Re=500,000 respectively. The presented flow field is resolved by more than 5 billion cells and is generated by a direct numerical simulation running with more than 60,000 cores on ARCHER. Q-criteria surfaces are used to indicate vortex structures, which are coloured by the vorticity magnitude. Regions comprising strong vortices appear yellow in the plot, whereas weaker vortical structures show up light blue. The snapshot is taken after restarting from a solution with a 80% narrowerer spanwise periodic domain. This picture indicates a reasonably fast breakdown of the former periodicity.

9. Schematic representation of an ultrafast X-ray scattering event. The image represents the X-ray experiment along with the equations necessary to carry out the HPC simulation of the problem.
Andres Moreno Carrascosa, University of Edinburgh - School of Chemistry
In our research group we are interested in ultrafast imaging, i.e. the art of visualizing chemical events as they happen in real time using state-of-the-art simulations and experiments. In terms of the simulations, we rely on HPC resources such as Archer. Our simulations have two elements; the first is a quantum dynamics simulation of the quantum evolution of the nuclear and electronic motion in a molecule excited by an ultra short optical laser pulse. The second consists of advanced calculations that aim to predict the X-ray scattering signal obtained using a X-ray free-electron laser.
The image tries to evoke the critical link between experiment, theory, and computations within this procedure. While the colourful pictures rely on the real experiment, the equations behind show the physical frame we have used to explain the whole process. In this image, schematic representations of the molecule and false-colour X-ray and electron beams are used to illustrate the concepts of real pump-probe diffraction experiments.
Image has been created using only Adobe Illustrator 2017 and Adobe Photoshop 2017.

10. Scattered showers - an ARCHER-enabled view of the water-cycle.
Andrew Coward, Marine Systems Modelling
Comprehensive models of the Earth System are key to understanding our climate and its variability. The ARCHER supercomputing service provides the capability and capacity for UK scientists to explore the interactions between key components at unprecedented resolutions. The main sequence shows a simulated year from a high resolution, coupled, ocean, sea-ice and atmosphere model.
There is a lot of meteorology and oceanography to observe in the movie. Most evident is the difference in time and space scales between the three components (atmosphere/ocean/sea-ice). At first glance the atmosphere does not appear to be greatly influenced by the ocean conditions (in contrast, it clearly feels the presence of topographic features such as the Rockies). Indeed, in comparison the ocean hardly appears to be moving (but it is). The ocean's influence is more subtle, providing energy to feed atmospheric instability and memory in the system to affect long term variability.

11. Time-evolution of CS2 photodissociation upon UV excitation, visualised as nuclear density plots of the sulfur atoms generated from quantum dynamics simulations carried out on Archer. (L) After 10 fs (R) after 500 fs.
Darren Bellshaw, University of Edinburgh, School of Chemistry
Rapid developments in ultrafast laser technology allow experimentalists to study fundamental chemical reactions in unprecedented detail, using extremely short, intense pulses of laser light as a "camera" on the atomic and molecular scale. However, the data generated by such experiments is difficult to interpret directly. Thus, theoretical simulations are a necessity. The submitted image comes from a joint experimental/theoretical study examining the behaviour of the CS2 molecule after excitation by a UV laser pulse, using state-of-the-art experimental and theoretical techniques. After absorbing a photon of UV light, CS2 undergoes complex nuclear and electronic motion resulting in breakage of one of the carbon-sulfur bonds. Dynamics simulations, reliant on HPC facilities such as Archer, have aided understanding of this process, and here we show two snapshots in time of the density distributions corresponding to the two sulphur atoms, which are delocalized according to the fundamental postulates of quantum mechanics.

12. West Scotland Coastal Ocean Modelling System (WeStCOMS) - 3D currents animation
* * * Winning Video and overall competition winning entry * * *
Dmitry Aleynik and Sam Jones, Scottish Association for Marine Science, Physics Department
Circulation pattern generated by the West Scotland Coastal Ocean Modelling System (WeStCOMS) run at ARCHER. WeStCOMS comprise an operational coupled ocean and atmospheric high-resolution three-dimensional hydrodynamic models based on the unstructured-mesh Finite Volume Community Ocean Model (FVCOM, 0.1÷3km) and the Weather Research Forecasts (WRF, 2x2km) respectively. Model results have been intensively validated against observations including current meters, conductivity/temperature/pressure sensors on stationary moorings, drifters, gliders. The visualization was created in cooperation with S. Jones over weekly hindcast runs. Operational model five-days forecasts enable stakeholders and community with the informed decision-making tool both in a field of academic research (stratified fluid tidal mixing, connectivity, sea-lice, pathogens, invasive species dispersal, Environmental Impact Assessment studies) and as an early warning predictive scheme for quick response mitigation measures during industrial and natural hazards, e.g. harmful algae bloom, oil spills, and in a support of sustainable development in Aquaculture, Renewable and other Blue Growth economy sectors.

13. Self assembling peptide nanocage
Richard Sessions, University of Bristol
This video introduces the simplest model for the self-assembling peptide nanocage or SAGE. The assembly is comprised of simple coiled coil (hub) units each composed of homotrimeric helices, each attached via a disulphide bond to either negatively or positively charged peptides. The acidic or basic hub units are synthesized separately. When mixed together, the oppositely charged peptides dimerize to form coiled coil heterodimers. This drives spontaneous polymerization which produces spherical structures 80-100 nm in diameter. This was unexpected for a predominantly hexagonal (therefore, flat) lattice. Experimental and modeling evidence (atomistic and coarse-grained) suggests that this modular arrangement permits sufficient defects in the hexagonal lattice to allow sphere closure, satisfying the drive to bury hydrophobic residues from the aqueous environment.
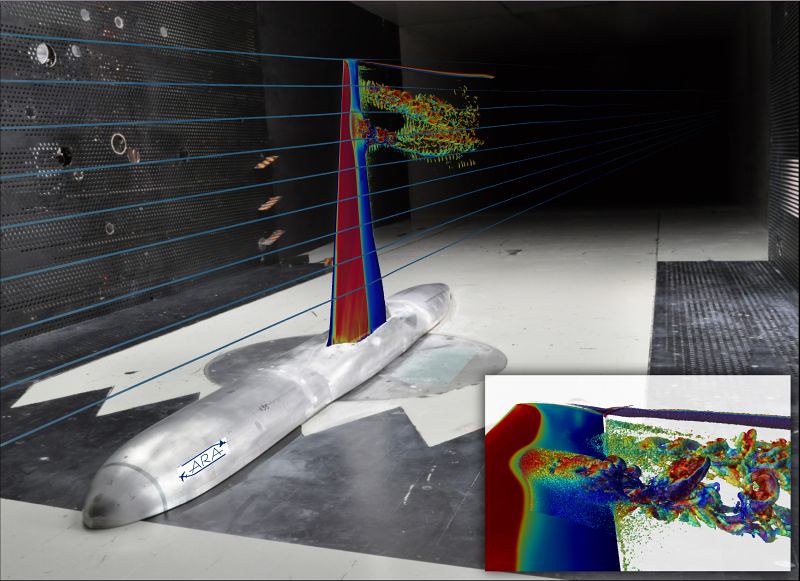
14. ARCHER's Numerical Wind Tunnel
Luke Masini, School of Engineering, University of Liverpool
The image shows the fusion of experimental and numerical wind tunnel data of an aircraft wing revealing complex flow features in high-speed flight. The wing surface is coloured by the instantaneous static pressure, with a sharp colour change highlighting a shock wave discontinuity. Such pressure jumps force the flow to detach from the wing surface generating large-scale turbulent eddies in the wake. Supercritical conditions result in shock wave unsteadiness and consequent fluctuating air loads requiring aircraft designers to incorporate measures of safety. These time-accurate simulations require extensive computational resources and were only made possible with ARCHER. The data will drive research into high-speed flow instability which will ultimately help to inform future wing design.
The image of the Aircraft Research Association transonic wind tunnel was taken using a Nikon D5000 camera and the numerical data was superimposed in Tecplot.

15. Flame-Acoustics-turbulence interation in a "noisy" gas turbine model combustor
Zhi Chen, University of Cambridge, Engineering Department
This video shows the three-way physical interaction between flame, acoustics and turbulence inside a gas turbine model combustor simulated using ARCHER. Air flow is fed into the combustor from the top-left inlet and passes through two swirlers where it is mixed with injected natural gas fuel. The mixture then enters the combustion chamber and ignites immediately forming a swirl flame as projected on the horizontal plane using heat release contours. Due to strong turbulence as indicated by the wrinkled flame surface, the unsteady heat release emits acoustic waves which interact with the combustor internal geometry establishing a thermos-acoustic instability. This can be seen on the vertical plane where the acoustic waves bounce back and forth producing a "screaming" sound. Understanding this problem helps to develop "quieter and greener" combustors for future gas turbines.
The image frames were created using Paraview and made into a movie using Mac iMovie.
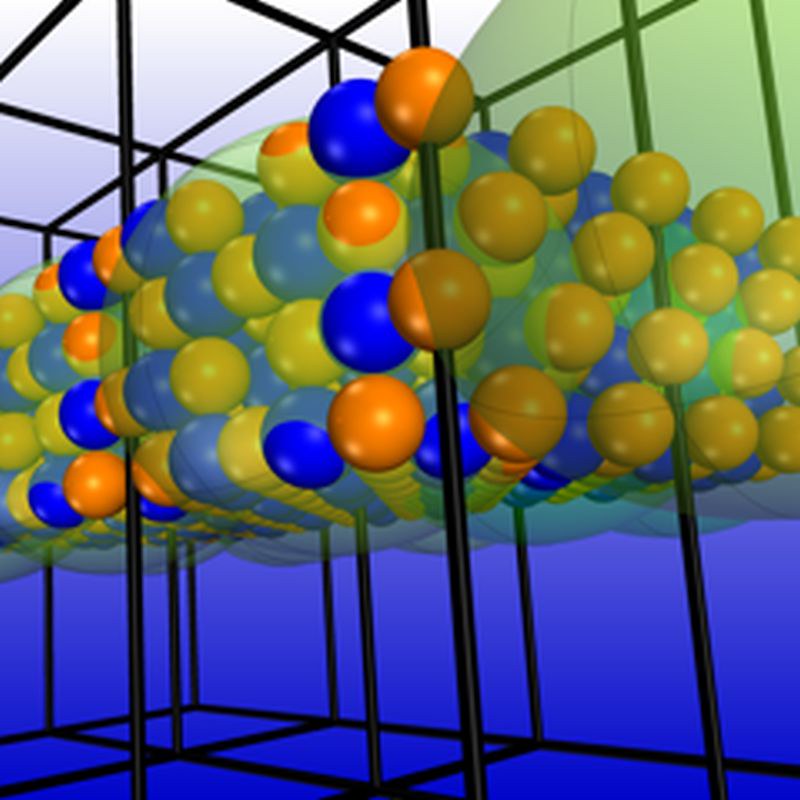
16. Li promoters on η-Mn3N2
Constantinos Zeinalipour-Yazdi, University College London
Understanding the mechanism of catalytic reactions is critical in the development of new catalyst formulations and process conditions that have lower energy requirements. In catalytic reactions the role of defects and promoters is currently not well understood at the atomistic level. In this study we obtained a better understanding via dispersion-corrected DFT of the role of Li promoters in ammonia synthesis on η-Mn3N2.

17. Supersonic Kelvin-Helmholtz instability simulation
* * * Winning Early Career Researcher entry * * *
Panagiotis Tsoutsanis, Cranfield University, SATM
This is an animation of the simulation of the Kelvin-Helmholtz instability obtained with the CFD code UCNS3D on Archer. The animation shows the evolution of small shear layer instabilities into chaotic vortical structures, that interact with pressure waves.
Research for this type of problems are widely used by the scientific community as a tool to assess the suitability of various numerical methods and techniques for turbulent flows. This is of paramount importance firstly for improving our understanding of turbulence itself, and secondly to be able to more accurately and efficiently predict the behaviour of engineering and scientific designs under turbulent flow conditions.

18. Oxidisation Damage to Graphene
Robert Sinclair, Department of Chemistry, University College London
Oxidising a graphene sheet introduces new chemical groups to a previously pristine carbon honeycomb structure. Oxidised 'islands' appear in the oxidisation process (shown in green), that buckle the flake and make it more flexible. Depending on the degree of oxidisation, undamaged graphene can remain (shown in blue) which allows some of graphene's superlative properties to persist, like its conductivity and high strength.
ARCHER was used to develop a new force-field for simulating graphene structures on an atomic scale. This allowed an accurate description of the friction between graphene sheets, with the aim of better understanding the notoriously difficult process of exfoliating graphene in solution.

19. Flamenco in the heart
Shaïma Hashem, Queen Mary University of London - School of Biological and Chemical Sciences
It looks like a flamenco dancer but in reality, the image represents a superposition of structures of human cardiac myosin, a protein involved in heart contraction, highlighting its dominant collective motions. The motions with the largest amplitude involve important structural elements of myosin (converter, lever arm and N-terminal domain), which form the lower part of the red gown of the dancer. Flexible regions are also found in the upper part of myosin, where disordered loops involved in actin binding form the head and arms of the dancer. Analysis of these data shed light on the correlation between the different structural elements of myosin and how it can be affected by drug binding. The figure was produced by running a principal component analysis on a myosin trajectory from a molecular dynamics simulation and visualising the structures along the dominant component using the VMD (Visual Molecular Dynamics) software.

20. Simulated convective storms in the Houston region
Bethan White, Atmospheric, Oceanic and Planetary Physics, University of Oxford
High-resolution simulations of isolated convective storms occurring over the Houston region, Texas. The image shows clouds (dark blue shaded volumes) and rain accumulated on the ground (blue-purple solid colour contour overlaid on the land surface). These simulations are performed as part of a study which investigates the impact of atmospheric aerosol pollution emitted in and around the city of the Houston on the intensity of the storms and rain which form in the region. The impact of aerosol pollution on convective clouds remains one of the largest sources of uncertainty in our understanding of the climate system. Studies which are able to resolve these processes in high resolution and over long timescales are therefore crucial in helping us to reduce this uncertainty and improve the confidence of our future climate projections.

21. Simulated supercell storm
Bethan White, Atmospheric, Oceanic and Planetary Physics, University of Oxford
This video shows a very high resolution simulation of a supercell thunderstorm. Supercells are high-impact severe storm systems and frequently produce tornadoes, hail, and very heavy rain. The transparent white - blue shaded surfaces show cloud water, cloud ice, and rain and snow which precipitate out of the cloud. The green-blue contour on the bottom shows the rain accumulated at the surface from the storm. This type of storm splits into two during its development and new clouds form from the mature clouds. The very high resolution of this simulation allows these processes to be seen. This simulation was performed as part of a study investigating the impact of model resolution on how well simulations produce supercell storms and rainfall, and thereby aims to help improve the forecasting of such severe weather events.

22. Ultrafast magnetic droplet formation caused by laser heating of an amorphous GdFe thin film. The colouring indicates the perpendicular orientation of the magnetization.
Richard Evans, Department of Physics, University of York
Ultrafast laser excitation causes a range of complex effects in magnetic materials. In GdFe alloys the heat from a laser pulse can cause spontaneous switching of the magnetization direction due to the complex dynamics of Fe and Gd spins in the material. Here, we have simulated the response of a micrometre sized GdFe thin film to a 50 fs laser pulse using atomistic spin dynamics. In amorphous GdFe thin films a local variation of the composition has a strong effect on the probability of switching which we aim to understand. The movie shows the switching process for the film simulated on 12,288 cores of ARCHER, with a large number of magnetic droplets forming and then coalescing to form a complex random magnetic domain pattern after the pulse. The simulations show that the rate of expansion of the magnetic droplets is over 5 km/s representing one of the fastest processes in magnet materials.

23. Simulation of the magnetization dynamics of a magnetic vortex after laser excitation
Richard Evans, Department of Physics, University of York
Confined magnetic materials are able to support complex topological structures. A magnetic vortex is the natural ground state of a permalloy nanodot, where the magnetization direction swirls continuously around the core. When excited by laser pulses, magnetic materials respond on the sub-picosecond timescale but their behaviour is hard to predict and understand. Here we have simulated the dynamics of a magnetic vortex in a 70 nm diameter nanodot after a 50 femtosecond laser pulse using atomistic spin dynamics as implemented in the VAMPIRE code. The laser heating causes a large number of vortex nuclei to form on the picosecond timescale as the vortex state attempts to reform after the laser pulse. The simulations show that topology has almost no effect on the dynamics at the ultrashort timescales, but can play a dominating role on the 100 picosecond timescale. This may lead to new ways to process and store information at Terahertz frequencies.

24. Colourful Caustics
Kathryn Hamilton, Centre for Theoretical Atomic, Molecular and Optical Physics, School of Mathematics and Physics, Queen's University Belfast
High harmonic generation (HHG) is the fundamental process of attosecond science. It enables us to convert low energy driving laser pulses into high-energy, ultrashort bursts of light.
The image shows the harmonic spectra of a neon atom irradiated by two time-delayed laser pulses. The striking red "mountains" in the foreground of the image are spectral caustics. Most people are familiar with optical caustics - the curves of light at the bottom of a tea cup or the bright spots of focused light on the floor of a swimming pool. In HHG, caustics result from the coalescence of more than two electron trajectories in the same spectral region, which can be engineered by adding a second colour to the driving laser pulse.
The harmonic spectra calculations were performed on ARCHER using the RMT code, which has been developed at Queen's University Belfast to model the correlated dynamics of many-electron systems.

25. Graphene Surfing
Robert Sinclair, Department of Chemistry, University College London
A graphene flake (blue) surfing on an undulating graphene sheet. Travelling waves in a suspended graphene sheet have been observed experimentally, this video shows how a graphene flake on top of such a surface could catch these waves and surf in the trough for large distances, almost frictionlessly. Peaks in the surface are coloured white, troughs are black. This process is a means of separating flakes by size, as the flake must be close to half the wavelength in diameter for this process to occur. ARCHER was used to develop a new force-field for simulating graphene structures on an atomic scale. This allowed an accurate description of the friction between graphene sheets, with the aim of better understanding the notoriously difficult process of exfoliating graphene and studying its superlubric nature.