
1. Ammonia synthesis.
Constantinos Zeinalipour-Yazdi, UCL
The picture depicts the reactants passing over the surface of cobalt molybdenum nitride and turning into ammonia. The background shows dry land due to the absence of fertilisers

2. Electric field response of multilayer graphene systems under different voltages.
Dr Elton Santos, Queen's University Belfast
Electric response of multilayer graphene at different values of field. One of the main implications of this response is that the dielectric constant of graphene is not constant but is tunable with an electric bias. This means that some fundamental quantities, as for instance the electron-electron interactions, can be controlled using an external parameter.

3. Photo-excitation dynamics in organic solar cells.
Dr Elton Santos and Mr. Peter Rice, Queen's University Belfast
Theoretical simulations using excited-state first-principles methods reveal that covalent functionalization and the relative orientation of donor and acceptor units in heterointerfaces are critical parameters for electron-hole dynamics. Long believed but barely shown microscopically in real-time, the device geometry affects the polarization of the interface, generating local electric fields that dissociate excitons harder or easier on a time scale of tenth of femtoseconds. This ultrafast charge transfer will help to understand how organic photovoltaic devices work in real-life applications, e.g. generation of electricity.

4. The diffusitivity of protein, lipid and solvent molecules from a simulation with periodicity removed.
Mr Robin Corey, University of Bristol
Detailed information on the motion of molecules can be gathered using molecular dynamics (MD) simulation. Using a "coarse-grained" force field, we have modelled a protein-lipid membrane system to map interaction sites between our target protein and a specific membrane lipid, furthering our understanding of this fundamental protein system.
MD simulations are generally built using boxes with periodic boundaries, meaning there are infinite boxes in all directions. Usually, the data is processed so that molecules leaving the box on one side re-enter on the other. I have removed this to chart the total movement of each molecule over ~10 microseconds. In the image, the diffusivity of white water molecules, red and blue ions, purple lipids and orange protein are shown in relation to the original MD box (yellow). The restricted diffusion of the solvent, caused by the lipid membrane, creates a galaxy-like effect.

5. The diffusitivity of protein, lipid and solvent molecules from a simulation with periodicity removed
Mr Robin Corey, University of Bristol
SecYEG is a membrane protein which transports other proteins either across or into lipid membranes. An important aspect of this process is the provision of specificity for the correct protein - the last thing a cell wants is to accidentally secrete its cytoplasmic proteins. In 1999, Günter Blobel was awarded the Nobel prize for showing that this specificity was conferred by an intrinsic 'signal sequence'.
This image illustrates key movements within SecYEG upon 'unlocking' by the signal sequence, with the protein shown as cartoon helices in multiple colours and a section of membrane shown as yellow and red spheres. The insertion of a signal sequence (purple helix) causes a shift in several different locations of SecYEG (dark blue to light blue, yellow arrows). These changes were recorded as a function of distance vs time using atomic-level computer simulation (with some example data included top right) and verified using multiple experimental analyses.

6. Substructures in a Milky Way-like dark matter halo
Mr Raphael Errani, Institute for Astronomy, Royal Observatory, University of Edinburgh
Galaxies like our own, the Milky Way, are presumed to form within haloes of Dark Matter, which exceed in mass the amount of stars and gas easily by a factor ten. Understanding the properties of Dark Matter haloes helps us to get an insight in the physics of Dark Matter, and might contribute to reveal its true nature. This simulation snapshot shows the distribution of Dark Matter in a halo similar to the one of the Milky Way, where the simulation adapts a novel approach to reveal intricate details such as shells and streams of disrupted dwarf galaxies at unprecedented resolution. Such substructures are remnants of the process of hierarchical galaxy formation and have been found to exist also in our own Galaxy, and their structure and distribution is highly sensitive to the physical properties of Dark Matter.

7. Flow around a tilt-rotor aircraft
Antonio Jimenez Garcia, Aerospace Department, CFD group, School of Engineering, University of Glasgow
This research introduces a novel approach to compute the flow around a tilt-rotor using computational fluid dynamics techniques. The image shows the flow-field of the ERICA tilt-rotor using the HMB solver of Glasgow University. The tilt-rotor technology has been successfully employed in the United States with the V-22 Osprey. However, it has been limited to just military applications. The combination of take-off/landing capabilities of helicopters with the high cruise speed of proprotors, makes this hybrid configuration aircraft an attractive concept for civil applications. However, civil tilt-rotor designs need to be quieter due to its environmental impacts on nearby communities, as well as, more efficient than military ones in terms of fuel consumptions. This project assesses and investigates the aerodynamic interference between the rotor and different components of civil tilt-rotor. This research provides more insight about tilt-rotor blade designs, and also assist in the development of the first civil tilt-rotor.

8. A confocal micrograph of antigen-presenting cells packed with millions of amorphous magnesium-substituted calcium phosphate (AMCP) nanoparticles loaded with bacterial peptidoglycan.
Dr. Helen Chappell, MRC Elsie Widdowson Laboratory
A confocal micrograph of antigen-presenting cells packed with millions of amorphous magnesium-substituted calcium phosphate (AMCP) nanoparticles loaded with bacterial peptidoglycan. Superimposed is the ARCHER-resolved inorganic-organic nanoparticles, modelled with first-principles code CASTEP. In the background image, taken by Jack Robertson, the cell nuclei are shown in blue, AMCP in green and peptidoglycan in red. The modelled particles show oxygen in red, carbon in grey, hydrogen in white, nitrogen in blue, calcium in green, phosphorus in purple and magnesium in yellow.
AMCP nanoparticles have been observed in the human gut in vast quantities. These tiny particles act as Trojan horses, crossing the gut epithelium and delivering trapped protein fragments from food and bacteria, to the cells of the immune system. Here the protein cargo is unpacked in the cell lysosome and an immuno-tolerant signal is induced, ensuring we do not experience an inflammatory response to food that we eat; in certain conditions, such as Crohn's Disease, this signal is not produced. In this image we show how ARCHER was used to explore the atomistic structure and chemistry of these composite nanoparticles, something that is not currently possible with experimental techniques. The background image is a 3D section of human antigen-presenting cells loaded with AMCP nanoparticles. The co-localization of the red (peptidoglycan) and green (AMCP) shows how the particles trap the protein in their structure to ferry it across the gut wall.

9. The birth of a footprint
* * * COMPETITION WINNING ENTRY * * *
Dr Peter Falkingham, Natural Sciences & Psychology, Liverpool John Moores University
This image is of three stages of footprint formation, simulated by combining bi-planar X-ray data of a guineafowl walking over a sand-like substrate with a Discrete Element simulation of the substrate. X-ray Reconstruction of Moving Morphology (XROMM) was used to capture the motions of the leg and foot in a living animal. LIGGGHTS was then used to model the substrate, simulating grains of 1 mm diameter. Poppy seeds were used as the substrate as they behave like dry sand but are less dense, allowing X-rays to pass through.
This work has allowed us to link features of footprints - both at and below the surface - with motions of the foot, and is now being applied to understanding footprints made by long extinct dinosaurs.

10. Vacancies in a Weyl semimetal under different conditions.
Dr. Dmitry Aleynik, Scottish Association for Marine Science / Physics and Technology
Harvesting of ferro-manganese nodules deep below the surface in the Central Tropical Pacific will generate plumes of suspended sediment with inevitable ecologically harmful long-lasting impact to the fragile, diverse, unique and largest abyssal benthic community on earth. Alongside concessions licenses, which have tripled in the past 6 years, a tool to assist spatial preservation planning is urgently required. To estimate plumes advection, the flow field was computed on ARCHER using an MIT-gcm general circulation model, forced by tides and the observed (in spring 2013) currents at the proposed mining site in the eastern Clarion-Clipperton Zone.
The figure shows a neutrally buoyant tracer spreading over a 3D bathymetry with colours indicating the concentration of dissolved matter (a) and overlaid with vertical mixing strength (Kz) after 19 days. Particulate matter plume contains half a million individual particles either suspended in a water (magenta) or settled on the seabed (pale) and charted on the same date (b).

11. Numerical experiments with 3D plume dispersal over deep-sea mining site
Dr. Dmitry Aleynik, Scottish Association for Marine Science / Physics and Technology
Harvesting of ferro-manganese nodules deep below the surface in the Central Tropical Pacific will generate plumes of suspended sediment with inevitable ecologically harmful long-lasting impact to the fragile, diverse, unique and largest abyssal benthic community on earth. Alongside concessions licenses, which have tripled in the past 6 years, a tool to assist spatial preservation planning is urgently required. To estimate plumes advection, the flow field was computed on ARCHER using an MIT-gcm general circulation model, forced by tides and the observed (in spring 2013) currents at the proposed mining site in the eastern Clarion-Clipperton Zone.
The figure shows a neutrally buoyant tracer spreading over a 3D bathymetry with colours indicating the concentration of dissolved matter (a) and overlaid with vertical mixing strength (Kz) after 19 days. Particulate matter plume contains half a million individual particles either suspended in a water (magenta) or settled on the seabed (pale) and charted on the same date (b).

12. Graphene's Dirac fermions screen a charged impurity.
Dr Fabiano Corsetti, Department of Materials, Imperial College London
Two-dimensional materials hold the potential to unlock revolutionary advances in technology with the development of ultrasmall devices for nano and bioelectronics, biosensors, flexible electronics, photovoltaics, and more. The realisation of 2D devices relies crucially on understanding and controlling the interaction with adsorbates. We use ARCHER to simulate this interaction using a multiscale methodology which bridges first-principles density-functional theory calculations with large-scale tight-binding Hamiltonians. The image shows a simulation of an isolated calcium adatom on graphene; the calcium is charged, and therefore acts as a Coulomb impurity that is screened by the electrons in graphene (shown by the green cutaway surface). The screening properties of graphene are unique due the properties of its massless Dirac quasiparticles.

13. Transparancy of graphene to an electric field
Mr Peter Rice, Atomistic Simulation Centre, Queen's University Belfast
The image depicts the "transparency" of graphene to an electric field. We performed calculations that will significantly help in the development of a range of future applications. In this way, we will be able to search for the right combinations of different 2D crystals while reducing the need for expensive lab work and test trials. The results where only made possible with the resources available to us on Archer!

14. Stimulating competition between electrons with two colour light fields
Dr Andrew Brown, CTAMOP, Queen's University Belfast
The image shows the light emitted by a neon atom subjected to two laser pulses; an ultrashort, high energy pulse, and a few-cycle long wavelength pulse. By varying the time delay between the pulses we can selectively suppress the high-harmonic radiation emission of one electron (the 'valley' like feature) allowing us to observe the contribution of the second electron, which extends the yield to higher energy. The calculations are performed with the RMT code, which has been developed specifically to model the correlated dynamics of many-electron systems.

15. Nested maps of historic mean annual maximum wave height
Dr Lucy Bricheno, Marine Systems Modelling, National Oceanography Cente
A nested modelling approach has been used to make projections of wave climate around North West Europe. A global model at 0.83° resolution for the whole globe, and an inner 'nest' of higher resolution (around 12km). The coastline and features of the wave field are captured more sharply in the finer of the two model nests.
This map shows a mean annual maximum significant wave height over a 30 year period from 1970 to 1999. The largest surface waves are seen to the west / north-west of the British Isles, and can exceed 8m in height. Semi-enclosed seas, such as the Irish Sea are more sheltered, with smaller maximum waves, averaging 2m in height over the thirty year period.

16. Vortical Lines evolving in a turbulent jet flow from a round nozzle
Mr Vassilis Ioannou, Aeronautics, Imperial College London
This image shows the evolution of a turbulent high-speed air jet ejected from a round nozzle in slow-moving air. The flow near the nozzle-exit is based on large-scale annular structures whereas the flow further downstream is highly turbulent with structures over a wide range of scales.
The turbulent jet is a canonical flow representative of many practical applications such as, e.g., propulsion jets of aircraft engines, hazardous toxic gases released from smokestacks, wastewater discharge from pipes into rivers. Our aim is to manipulate the flow structures at the exit of the nozzle in order to achieve noise mitigation and mixing enhancement.
The data was produced by a high-fidelity simulation for which the equations describing the fluid motions were solved with the open-source flow solver Incompact3d (www.incompact3d.com). The simulation was performed on ARCHER in a domain using more than 800 million nodes on 8,192 cores.

17. Vortical Lines evolving in a turbulent jet flow from a round nozzle
Mr Vassilis Ioannou, Aeronautics, Imperial College London
Evolution of a turbulent high-speed air jet ejected from a round nozzle in slow-moving air. The flow near the nozzle-exit is based on large-scale annular structures whereas the flow further downstream is highly turbulent with structures over a wide range of scales.
The turbulent jet is a canonical flow representative of many practical applications such as, e.g., propulsion jets of aircraft engines, hazardous toxic gases released from smokestacks, wastewater discharge from pipes into rivers. Our aim is to manipulate the flow structures at the exit of the nozzle in order to achieve noise mitigation and mixing enhancement.
The data were produced by a high-fidelity simulation for which the equations describing the fluid motions were solved with the open-source flow solver Incompact3d (www.incompact3d.com). The simulation was performed on the UK national high performance computing facility ARCHER in a domain using more than 800 million nodes on 8,192 cores.

18. Vortical Lines evolving in a turbulent jet flow from a round nozzle
Mr Vassilis Ioannou, Aeronautics, Imperial College London
Evolution of a turbulent high-speed air jet ejected from a round nozzle in slow-moving air. The flow near the nozzle-exit is based on large-scale annular structures whereas the flow further downstream is highly turbulent with structures over a wide range of scales.
The turbulent jet is a canonical flow representative of many practical applications such as, e.g., propulsion jets of aircraft engines, hazardous toxic gases released from smokestacks, wastewater discharge from pipes into rivers. Our aim is to manipulate the flow structures at the exit of the nozzle in order to achieve noise mitigation and mixing enhancement.
The data were produced by a high-fidelity simulation for which the equations describing the fluid motions were solved with the open-source flow solver Incompact3d (www.incompact3d.com). The simulation was performed on the UK national high performance computing facility ARCHER in a domain using more than 800 million nodes on 8,192 cores.

19. Harnessing the power of the Sun: Magnetic reconnection in a cross-section of a realistic tokamak simulated with the JOREK code
Dr Jane Pratt, M. Hoelzl and E. Westerhof, Astrophysics Group, University of Exeter
Fusion is a process that heats the Sun and stars. If harnessed in the future, fusion could generate large amounts of carbon-free energy. A tokamak, a machine that uses a magnetic field to confine the hot ionized gas that makes up a plasma, has the potential to produce energy using fusion. In a tokamak, plasma resistivity causes magnetic field lines to reconnect, forming magnetic islands. When a magnetic island grows to a large size, it can result in fast escape of plasma from the machine.
This image shows a cross-section of a realistic tokamak configuration with a divertor, obtained as a snapshot from a simulation with JOREK, a nonlinear magnetohydrodynamics code. A large magnetic island is created by a perturbation of the current density which is indicated by the colours: negative current perturbations are displayed by blue colours, positive current perturbations are displayed by red colours. White lines have been plotted over the current perturbation to visualize the surfaces of constant magnetic flux. Outside of the magnetic island, these surfaces are nearly concentric. The size and position of the magnetic island is indicated by the surfaces of constant magnetic flux that form isolated pockets between the concentric circles.

20. Electric field generated by the heart in the human body at the beginning of a heartbeat.
Dr Alfonso Bueno Orovio, Department of Computer Science, University of Oxford
The figure shows the electric field generated by the heart in the human body during the initiation of a heartbeat. In the heart, the red colour indicates the areas that have been electrically activated, while those in blue are areas yet to be excited. In the body, the streamlines show the electric field produced by such an electrical activity, coloured by electric voltage potential. This can be measured for diagnosis in the clinic in the form of an electrocardiogram. The use of ARCHER is allowing us the investigation of multiple disease conditions in the human heart, to augment the information that we can obtain from these signals for a better diagnosis of patients, and to improve their tailoring of therapy.

21. Electric field generated by the heart in the human body at the beginning of a heartbeat in healthy (left) and diseased (right) conditions.
Dr Alfonso Bueno Orovio, Department of Computer Science, University of Oxford
The figure shows the electric field generated by the heart in the human body during the initiation of a heartbeat. This is shown for a healthy person (left) and for a person with the diseased condition known as right bundle branch block (right), where your right ventricle is not able to activate properly. In the heart, the red colour indicates the areas that have been electrically activated, while those in blue are areas yet to be excited. In the body, the streamlines show the electric field produced by such an electrical activity, coloured by electric voltage potential. This can be measured for diagnosis in the clinic in the form of an electrocardiogram. The use of ARCHER has allowed the investigation of multiple disease conditions in the human heart, to augment information that has been obtained from these signals for a better diagnosis of patients, and to improve their tailoring of therapy.

22. I spy with my ARCHER t-eye-me, the future of nanoparticle formulations.
Ms Ioanna Danai Styliari, Department of Pharmacy, University of Nottingham
This image illustrates a polymer-drug nanoparticle. Producing nanoparticles is a common technique in the pharmaceutical field to increase the efficacy of poorly water-soluble drugs (grey colour). Most of the times, the formulations produced include also polymer chains (light and dark blue chains) that interact with the drug, forming a dense particle that can circulate in the body, and be deposited in the regions of interest.
Experimentally, formulating nanoparticles is a result of many tedious trial-and-error approaches. Simulations performed in ARCHER using Molecular Dynamics allowed us to replicate an experimental procedure with real-life concentrations that resulted into the formation of a polymer-drug nanoparticle.
Understanding the interactions between the polymer chains and the drug particles is the stepstone towards a formulation-by-design approach, that will reduce trial-and-error in the labs and result in better nanoparticle-based drug delivery systems.

23. Three dimensional, unsteady, flows around an aircraft wing in various flight conditions
Dr. Marco Rosti, Dr Mohammad Omidyeganeh and Prof. Alfredo Pinelli, Dept. of Mechanical Engineering and Aeronautics, City University of London
We have studied the three dimensional, unsteady, flows around a wing in various flight conditions, mimicking those experienced during take-off and landing or the influence of a wind gust. With the aid of numerical simulations, as an alternative to experiments in a wind tunnel, we were able to develop new wing designs that can enhance aerodynamic performance at no extra cost. These can improve an aircraft's manoeuvrability, increase the amount of weight it can carry, or reduce the fuel consumed - all of which may contribute to reductions in greenhouse gases. The picture shows the isosurfaces of the Q-criterion (top) and the Lagrangian Coherent structures (bottom) of an aerofoil at 20° of incidence at Re=20000.

24. Wee Archie - The Suitcase-sized Supercomputer
Dr. Lorna Smith, EPCC, University of Edinburgh
Wee Archie is a suitcase-sized supercomputer, designed to let school children try their hand at computing and learn about the benefits of supercomputing. The system has been created to be representative of the system design in massively parallel architectures. There are 18 Raspberry Pi's, each acting as a multi-core node providing a total of 72 cores and 144GB of RAM, a network switch, a power supply unit (PSU) and Ethernet cables. Each Raspberry Pi has an LED display that lights up when in use, providing a visual display that helps demonstrate how multiple processors work in parallel to solve complex tasks. We have a suite of demos for Wee Archie. These demos highlight real science from the ARCHER system and show the benefits of ARCHER in a fun and accessible manner.
Wee Archie was designed and built through a collaboration between EPCC and Edinburgh University's science outreach group, FUSION.

25. Model of EphA2 ectodomain at the membrane
Dr Matthieu Chavent and Mr Tom Newport, SBCB, Biochemistry Department, University of Oxford
Model of the ectodomain of the EphA2 receptor interacting with a lipid bilayer (here represented by triangles or cubes). Multi-scale simulations based on this model reveal the flexibility of the ectodomain. The image illustrates the simulated dynamics of the ectodomain (shown as glowing lines) as well as different conformations that highlight the possible movement of this receptor relative to the membrane surface.

26. Model of EphA2 ectodomain at the membrane
Dr Matthieu Chavent and Mr Tom Newport, SBCB, Biochemistry Department, University of Oxford
Model of the ectodomain of the EphA2 receptor interacting with a lipid bilayer (here represented by triangles or cubes). Multi-scale simulations based on this model reveal the flexibility of the ectodomain. The image illustrates the simulated dynamics of the ectodomain (shown as glowing lines) as well as different conformations that highlight the possible movement of this receptor relative to the membrane surface.

27. Model of EphA2 ectodomain at the membrane
Dr Matthieu Chavent and Mr Tom Newport, SBCB, Biochemistry Department, University of Oxford
Model of the ectodomain of the EphA2 receptor interacting with a lipid bilayer (here represented by triangles or cubes). Multi-scale simulations based on this model reveal the flexibility of the ectodomain. The image illustrates the simulated dynamics of the ectodomain (shown as glowing lines) as well as different conformations that highlight the possible movement of this receptor relative to the membrane surface.

28. A "Pac-enzyme" in action: thermodynamics analysis of domain motion.
Dr. Danilo Roccatano, School of Maths and Physics, University of Lincoln
Our pac-enzyme, Citrate Synthase (CS) is an enzyme localized in the mitochondria of our cells where it plays an important role in the aerobic respiration cycle by transforming oxaloacetate molecules (on the right side of the picture) in citrate (on the top left side) with the assistance of the acetyl-coenzyme A (CoA) molecule. As the pac-man in the famous computer game, this Pac-enzyme diffuses along the space between the convolute cristae (the convoluted inner membrane) of the mitochondria "chomping" at encountered oxaloacetates. This activates the enzyme to bind the CoA (ghosts in the playground). For each captured CoA, a new citrate molecule is then produced (score). This complex mechanism requires large conformation changes of parts of the protein (domains) whose molecular details are not yet clarified. Using molecular dynamics simulations on the ARCHER supercomputer, we are studying this enzyme to garner novel insights on structural, dynamics and thermodynamics of its functional mechanisms.

29. Multiphysics simulation and machine learning predict how dinosaurs move
Dr. William Sellers, School of Earth and Environmental Sciences, University of Manchester
The laws of physics apply for extinct animals exactly as they do for living ones. We used robotic simulation combined with mechanical load analysis and our knowledge of comparative anatomy to build virtual dinosaurs. Using Archer we were able to use massively parallel evolutionary algotithms to explore how these animals could have moved and used this information to predict how fast Tyrannosaurus rex could run based on the maximum loads the skeleton could cope with. The image was produced using an entirely open source toolchain. The output from GaitSym, our in house simulation package, was imported directly into Blender, suitable lights were added, and the final image was rendered using Cycles. The colour patterns midway through the leg bones represent the load experienced by the skeleton at that point in time.

30. Multiscale modelling of ventricular tachycardia
Mr. Hector Martinez-Navarro, Computational Cardiovascular Science group, University of Oxford
Meshes extracted from CT scannings are taken as basis for simulating the cardiac electrophysiology.
It has been taken into consideration the heterogeneity of tissue inside the human torso, which is needed for measuring the electric potential on the body surface and computing the electrocardiogram of the virtual patient, useful for the extraction of biomarkers.
Multiscale models require to simulate from single cells to whole torso, which is very expensive computationally. Archer provides an infrastructure suitable for developing in silico drug trials, and allows to consider the personalization of treatment/prognosis according to different patients, due to the massive amounts of simulations needed for these purposes.
The virtual patient shown suffers from ischaemia, a pathology related to a poor blood irrigation in some area of the heart. These patients are more likely to yield arrhythmias and on this case the virtual patient has developed ventricular fibrillation.

31. Multiscale modelling of ventricular tachycardia
Mr. Hector Martinez-Navarro, Computational Cardiovascular Science group, University of Oxford
Meshes extracted from CT scannings are taken as basis for simulating the cardiac electrophysiology.
It has been taken into consideration the heterogeneity of tissue inside the human torso, which is needed for measuring the electric potential on the body surface and computing the electrocardiogram of the virtual patient, useful for the extraction of biomarkers.
Multiscale models require to simulate from single cells to whole torso, which is very expensive computationally. Archer provides an infrastructure suitable for developing in silico drug trials, and allows to consider the personalization of treatment/prognosis according to different patients, due to the massive amounts of simulations needed for these purposes.
The virtual patient shown suffers from ventricular fibrillation. The abnormal propagation pattern produced by spiral waves produces a disorganised activation sequence and therefore the inability to pump blood properly.

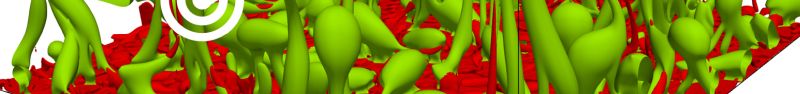
32. Star-crossed lovers: Flame quenching by wall
Mr. Jiawei Lai, Newcastle University
Cooling of walls is necessary to ensure structural integrity of combustors because the burned gas temperature is often higher than the melting point of the wall. This heat loss through the wall quenches the flame and generate pollutants, while high heat flux due to flame-wall interaction affects the lifespan of combustors. This picture shows interaction of V-shaped turbulent premixed flame with inert top and bottom isothermal walls using a simulation methodology on ARCHER which does not make any physical approximation for simulating the underlying turbulent fluid motion. This data acts as a valuable source for the development of high-fidelity models for Computational Fluid Dynamics calculations which play pivotal roles in the design of next-generation automotive engines, gas turbines and micro-combustors.
Colours represent the magnitudes of vorticity magnitude (background: red-high and white-low) and temperature (isosurface and side view, red-high and blue-low) and fuel mass fraction (lower wall view, red-high and blue-low).

33. When turbulence meets a vanishing sound speed
Dr. Emile Touber, Mechanical Engineering, Imperial College London
The picture is a snapshot of two-dimensional turbulence in the vicinity of the liquid-vapour critical point, where the speed of sound is nearly brought to a halt (red regions). Slowing down the speed of sound to such extremes gives birth to a wide range of non-linear wave phenomena not observed in ideal substances. These waves generate vast amounts of vortical structures (shown in black and white), which then significantly alter the way turbulence redistributes the kinetic energy across scales (the so-called energy cascade). These findings suggest that real-gas thermodynamics could offer a novel way of controlling turbulence (i.e. other than through boundary conditions or body forces), with possible applications in future energy production devices exploiting the properties of the liquid-vapour critical point. Capturing the kinetic energy redistribution process across scales requires significant computational resources such as Archer.

34. Eppur si muove. Computational simulations unravel hidden protein dynamics.
Dr. Jordi Juárez-Jiménez, EaStChem School of Chemistry, University of Edinburgh
Proteins play a huge diversity of functions in cells and most of nowadays medicines work because they correct abnormal behaviors of proteins. In the particular case of Cyclophilin A, its malfunctions are linked to variety of illness ranging from autoimmune diseases to cancer. In order to develop a new generation of medicines able to correct such abnormal behaviors of Cyclophilin A we need an accurate description of its "hidden dynamics". This term describes the set of movements that are known to occur on a protein, but are very difficult to describe using experimental techniques because they happen rarely. Nevertheless, the combination of molecular dynamic simulation obtained in ARCHER with new data analysis techniques have allowed us to develop a model of the hidden dynamics of Cyclophilin A with atomic detail. This picture was obtained using VMD software and illustrates movements on the Cyclophilin A protein as predicted by our model.

35. Turbulent Wake Generated by a Square Prism
Mr. Felipe Alves Portela, Aeronautics, Imperial College London
The image illustrates how a flow past a bluff body gives rise to a turbulent wake displaying a wealth of scales of motion within the fluid. The iso-surfaces represent coherent structures within the flow and the lines are stream-lines of the fluctuating velocity. Large structures aligned with the body's axis dominate the motion of fluid while smaller scales arise and interact with each other, the smallest of which destroying the energy associated with the turbulent motion. The mechanisms by which this energy is exchanged between the different scales and within the flow is not well understood yet and is the matter of ongoing research. Archer's computational power provides the means to simulate realistic flows and extract information which is often unobtainable in laboratory experiments. The present image was processed in ParaView and the data was obtained using an in-house code which ran in Archer for about 10000 CPU-hours.

36. Simulating the human ECG
Mr. Louie Cardone-Noott, Computer Science, University of Oxford
Cardiovascular disease is the leading cause of death worldwide, and the electrocardiogram (ECG) is commonly used for diagnosis. Simulations of the ECG are uniquely able to answer research questions in humans, because conventional experimentation is not possible and human simulations are more relevant (and ethical) than animal experiments. Solving such detailed mathematical models of the electrical activity in the human heart and torso is only possible with HPC resources like Archer.
This image is a visualisation of the electrical potential in the ventricles and torso in a typical simulation of a normal heartbeat. Iso-surfaces (3-D contours) of electrical potential are shown emanating from the surface of the heart throughout the torso. By measuring the potentials at the body surface we can generate the 'simulated ECG', just like placing electrodes on the chest in the clinic.
Simulations like these in Archer have many possible applications, including personalised medicine and drug discovery.

37. Graphene grain boundary
Dr. Georg Schusteritsch, Department of Materials Science and Metallurgy, University of Cambridge
Graphene grain boundary structure between armchair and zigzag graphene regions - carbon atoms are shown as spheres. The red transparent region marks the interface between the two so-called grains, forming a continuous chain of pentagons and heptagons in the otherwise pristine graphene. The atomic structure was found using our crystal structure prediction code (AIRSS), implemented to employ the CASTEP code. Polycrystalline materials can today be routinely grown experimentally, but for many of these it is not easy to determine the atomic structures experimentally, making understanding their properties and the underlying physics that govern them a slow, difficult and often expensive task. Polycrystalline materials can today be routinely grown experimentally, but for many of these it is not easy to determine the atomic structures experimentally, making understanding their properties and the underlying physics that govern them a slow, difficult and often expensive task. Crystal structure prediction in combination with the availability of the computational power from ARCHER, can be used to find the atomic structure of interfaces, and thus illustrate a future pathway towards computationally developing materials with specially designed interfaces. (DOI:https://doi.org/10.1103/PhysRevB.90.035424) [Image created using Blender 2.73].

38. Snapshot of an arrhythmia simulation in ischemic human ventricles under the effect of a potassium-based antiarrhythmic drug. Blue areas show the wavefront propagation and red areas show the activated myocardial tissue.
Dr. Ana Minchole, Ernesto Zacur and Sara Dutta, Department of Computer Science, University of Oxford
Acute ischemia is a major cause of sudden cardiac death further promoted by antiarrhythmic drugs based on potassium blockers. In order to understand the mechanisms of arrhythmia under these conditions, a human ventricular detailed model is constructed by integrating experimental and electrophysiological data. Simulations were run in Chaste on Archer using a human finite element mesh of 14 million elements. The use of Archer and its parallelisation facilities allows us to simulate the very complex and computationally demanding abnormal electrical propagation or arrhythmia.
These simulations allow the investigation of different antiarrhythmic drugs and drug doses to identify arrhythmic risk.

39. Snapshot of the simulated cardiac electrical activity for a personalized model from a 65 years old man MRI. Left panel, the electrical potential at the epicardical surface (potential values go from blue to red). Central panel, isopotential lines of the body surface and the electrode potitions (blue markers). Right panel, the resulting simulated electrocardiogram derived from the electrodes.
Dr. Ana Minchole and Ernesto Zacur, Department of Computer Science, University of Oxford
We present a fully automatic pipeline from the clinical magnetic resonance images to the simulation of the electrocardiogram (ECG). These personalised 3D finite element models of the geometry of the torso and heart together with a detailed electrophysiological model at cellular level allow us to virtually simulate the electrical activity of the heart. The ECG, which is the most important non invasive diagnostic tool in the clinic, records the electrical activity of the heart at different torso locations. The high complexity of these models as well as the different scales involved make the whole pipeline a challenge in terms of computational resources. The use of Archer and its parallelisation facilities allows us to simulate one heart beat in 2 hours in 960 processors on a ~50 million element mesh. These simulations improve the capability of the ECG as a patient-specific diagnostic tool.

40. Snapshot of the simulated cardiac electrical activity. Left panel, the electrical potential at the epicardical surface (potential values go from blue to red). Right panel, isopotential lines of the body surface propagated through the internal tissues.
Dr. Ana Minchole and Ernesto Zacur, Department of Computer Science, University of Oxford
We present a fully automatic pipeline from the clinical magnetic resonance images to the simulation of the electrocardiogram. These personalised 3D finite element models of the geometry of the torso and heart together with a detailed electrophysiological model at cellular level allow us to virtually simulate the electrical activity of the heart. This electrical activity is propagated through the internal tissues with different impedances up to the torso surface. The high complexity of these models as well as the different scales involved make the whole pipeline a challenge in terms of computational resources. The use of Archer and its parallelisation facilities allows us to simulate one heart beat in 2 hours in 960 processors on a ~50 million element mesh.

41. 2D photo-electron momentum distribution after ionisation of hydrogen molecular ion with IR fields.
Mr. Alejandro de la Calle, Atomistic Simulation Centre, School of Mathematics and Physics. Queen's University Belfast
Momentum distribution of ionised electron from hydrogen molecular ion after interaction with an ultra-intense infrared laser pulse. The circular structures with their centres along the central axis are due to rescattering of the electron against one of the two parent nucleus. The energy that the electron has gained from the field after ionisation allows for probing the structure and dynamics of the parent system. For example, electron emission in a diatomic molecule as the hydrogen molecular ion presents two-center interference, the same kind of intereference present in a double-slit experiment. The data was obtained solving the time-dependent Schr�dinger equation on a massively parallel calculation on the ARCHER supercomputer.

42. 3D photo-electron momentum distribution after photo-ionisation of hydrogen molecular ion with an ultra-short XUV laser pulse.
Mr. Alejandro de la Calle, Atomistic Simulation Centre, School of Mathematics and Physics. Queen's University Belfast
3D Momentum distribution of ejected electron from hydrogen molecular ion after interaction with an ultra-short XUV laser pulse. Absorption of one photon produces a spherical distribution centred at the origin with radius the momentum of the ionised electron. The ejected electron energy is given by the energy of the incident photon minus the ionisation potential of the molecule. The node along the z axis is due to initial state of the molecule. Calcualtions of the time-dependent Schrödinger equation in full dimensions required the computational capabilities of ARCHER.
The circular structures with their centres along the central axis are due to rescattering of the electron against one of the two parent nucleus. The energy that the electron has gained from the field after ionisation allows for probing the structure and dynamics of the parent system. For example, electron emission in a diatomic molecule as the hydrogen molecular ion presents two-center interference, the same kind of intereference present in a double-slit experiment. The data was obtained solving the time-dependent Schrödinger equation on a massively parallel calculation on the ARCHER supercomputer.

43. Steered Moleuclar Dynamic Simulations of a natural haemoglobin derived di-peptide migrating to the active site of the Malarial plasmodium falciparum M1 alanyl aminopeptidase (PFM1AAP).
Mr. Daniel Moore, Queen's University Belfast
Steered Molecular Dynamic Simulations of a natural haemoglobin derived di-peptide migrating to the active site of the Malarial plasmodium falciparum M1 alanyl aminopeptidase (PFM1AAP). (Bottom Right) Substrate recognition mechanism coordinating the di-peptide Arginine-Alanine to the entrance of the C-Terminal binding cavity. Red highlights negatively charged residues, Blue represents residues with a positively charged side chain. (Top Right) The Critical Arginine residue located within the C-Terminal channel actively pulling substrates from the entrance of the cavity, deep into the channel. Three states are visualised along the simulation also with the position of the substrate during the initial and final contact with the Arginine residue. (Left) Cartoon representation of PFM1AAP coloured by domain: I (blue), II (green), III (yellow) and IV (red). The long C-Terminal binding cavity is visualised as a surface representation in cyan.
With the advent of ever increasing computational power it is now within our grasps to simulate the binding pathways of substrates and inhibitors using High Performance Computing Clusters and Molecular Dyanmic simulations. Here, we simulate various substrates and inhibitors migrating through the binding pathway of a protein, plasmodium falciparum M1 alanayl aminopeptidase (PFM1AAP), that supports the malarial parastitc survival. Our simulations reveal critical areas of the protein which facilitate the binding process of the haemoglobin dervide peptides. The results of which pave the way for the design of new, novel theraputics against the malarial epidemic. The image provided shows an atomistic view of coordination and active migration mechanism that may be specifically targeted to inhibit the enzyme and ultimately starve the malarial parasite from its food source. All images were rendered in pymol.