

1. Magnificently magnifying
Dr Mariette Wolthers, University College London, Department of Chemistry
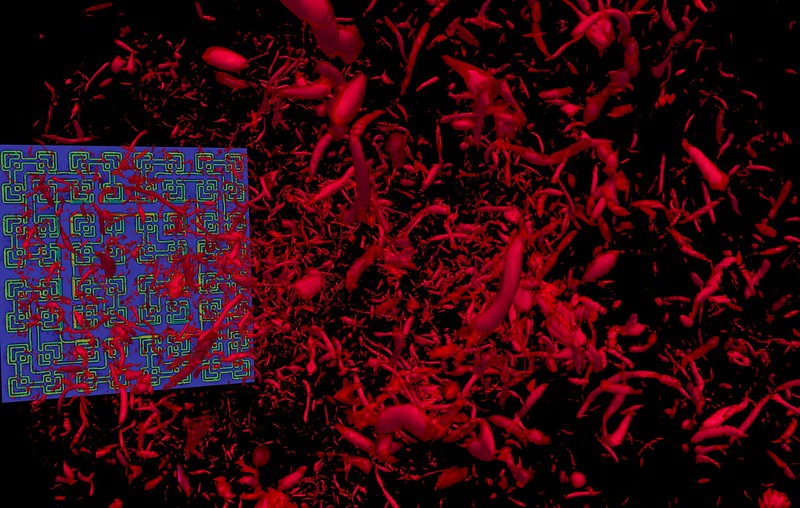
Rocks, sand and mud all have in common that they are made up of minerals. Calcite is one such mineral. It's what chalk and the beloved cliffs of Dover are made of. Calcite can affect the quality of groundwater by making it "hard", taking up or releasing contaminants. How calcite interacts with water can be analysed at the atomic scale using ARCHER.
The background image is a snapshot of a simulation of the calcite mineral surface in water. The blue V-shapes are water molecules. The green, red and grey balls are atoms in the calcite surface. Water near the calcite surface is structured, almost like ice, in rows above the green calcium atoms. Information on this nearly frozen water is to predict the surface charge (inset graph) and reactivity of calcite towards contaminants and how fast calcite forms or dissolves. As such, ARCHER works as a magnificent magnifying glass.
2. Turbulent flow generated by a fractal square grid in a virtual wind tunnel based on the flow solver Incompact3d using 8,100 computational cores
Dr Sylvain Laizet, Imperial College London, Department of Aeronautics
Fractal grids, which are made from a structure, such as a square, repeated at different scales, can make very efficient mixers. They create high turbulence with little energy input and you only need to make very small changes to the grid to have an enormous effect. Such devices are an alternative to current static in-line mixers for fluid mixing and can be used for mixing a fluid and a gas to create homogenous end products. Target applications include the petrochemical industries for additive mixing; in waste and water treatment for aeration, sludge mixing and chemical addition as well as for generating powders in the pharmaceuticals industry.
Simulations of the turbulence created by fractal grids are allowing a better understanding of the mixing process and will allow the design of optimised energy-efficient mixers. They are a central component of our research and are constantly compared to our experimental results.

3. Chaotic fluid dynamics
Dr Phil Browne, School of Mathematical and Physical Sciences, University of Reading
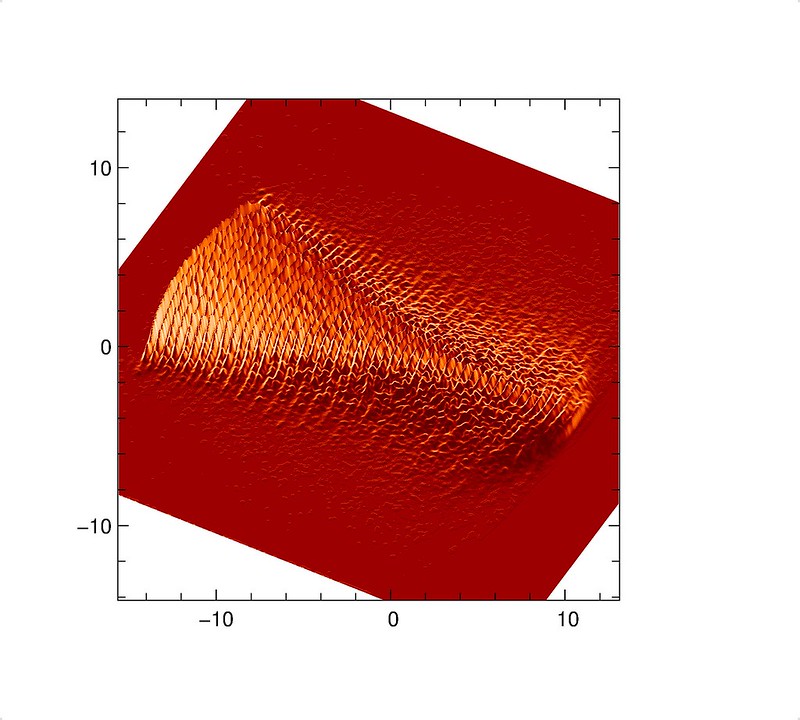
Many computational models are chaotic, meaning that small differences lead to wildly different results. This is famously true of earth's atmosphere and other fluid dynamics problems. In order to test ways to forecast the weather and climate, we often use smaller models with the same properties. This images shows one such model that simulated fluid flowing on a torus. The colours represent the intensity of rotation, and you can see areas which look similar to weather systems such as hurricanes or typhoons that occur in the atmosphere. Areas of intricate detail where the flow has sharp small-scale features are where we concentrate our efforts to ensure they are well represented, in order so that we can make the most reliable predictions. Archer allows us to run multiple high-resolution simulations at once to quantify the uncertainty in our predictions.
4. A beam of high-energy electrons created in a ultra-high-intensity laser-plasma interaction focuses within the gold target
Dr Robbie Scott, STFC Rutherford Appleton Laboratory, Central Laser Facility
Ultra-high-intensity lasers generate beams of high-energy electrons when they are fired at solid targets. In principal these electron beams can be used to initiate controlled thermonuclear fusion within the laboratory - a near infinite source of clean, green, energy. Previously the electron beam has been found to be highly divergent, meaning it is very inefficient at initiating fusion. Using the EPOCH code running on ARCHER, a new scheme has been investigated which has been shown to produce a beam of high-energy electrons instead focus within the target, potentially greatly improving the efficiency of the fusion scheme.

5. Numerical simulation of tidal flow past a single marine power turbine
Dr Christian T. Jacobs, Department of Earth Science and Engineering, Imperial College London
A visualisation of the water velocity from a numerical simulation of tidal flow past a marine power turbine. Lighter colours represent a higher velocity. As a tidal wave flows past the 5 m x 20 m turbine (outlined in white), a turbulent wake forms behind it and vortex shedding is clearly visible. The numerical simulation predicts how much power will be extracted by the turbine with a given set of conditions (e.g. placement of the turbine and incoming flow speed) to help maximise the efficiency of turbine arrays/'farms' developed in the future. The simulation was performed on Archer using a computational fluid dynamics code called Firedrake-Fluids.

6. Numerical simulation of flooding following a dam breach
Dr Christian T. Jacobs, Department of Earth Science and Engineering, Imperial College London
A visualisation of a numerical simulation of flooding following a dam breach. The setup considers a high-level of water that is initially held back by a dam wall (shaded grey). A 75 metre-wide breach in the wall is then considered, through which water rushes into the lower section to form a tidal bore wave. Swirling vortices are visible near the corners of the breach. The simulation was performed on Archer using a computational fluid dynamics code called Firedrake-Fluids to validate the numerical model. Such simulations can also be used to demonstrate how a catastrophic failure of a dam might affect surrounding inhabited areas.

7. 2-D momentum plots of electron rescattering from fluorine anions
Dr Andrew Brown, Queen's University Belfast
2-D momentum distributon of electrons driven by strong-field photodetachment of a Flourine anion. The large circular rings are a clear signature of electron rescattering, wherein the electron is pulled first away from the ion and then smashed back into it, gaining excess energy from the field and probing the atomic structure and dynamics of the residual target. Previous model calculatons failed to find any evidence of rescattering, but the massively expanded capabilites of ARCHER allow us to model the electron dynamics in greater detail than ever before.

8. Pd38 cubooctahedral nanclusters
Dr Constantinos Zeinalipour-Yazdi, University College London Department of Chemistry
The study of dynamic processes in catalysis and materials chemistry using accurate quantum mechanical calculations is a computationally demanding process. The high performance computing resources offered by ARCHER through the Materials Chemistry Consortium are pivotal for the performance of such calculations. In this study we explore through hybrid-DFT molecular dynamics simulations the spatial and time evolution of adsorbates on the surface of nanoclusters. This research has resulted in fascinating simulations with respect to the dynamic motion of adsorbates on the surface of nanoparticles at high coverages.

9. The image depicts a Pd38 cubooctahedral nanclusters at various degrees of adsorbate saturation
Dr Constantinos Zeinalipour-Yazdi, University College London Department of Chemistry
The study of dynamic processes in catalysis and materials chemistry using accurate quantum mechanical calculations is a computationally demanding process. The high performance computing resources offered by ARCHER through the Materials Chemistry Consortium are pivotal for the performance of such calculations. In this study we explore through hybrid-DFT molecular dynamics simulations the spatial and time evolution of adsorbates on the surface of nanoclusters. This research has resulted in fascinating simulations with respect to the dynamic motion of adsorbates on the surface of nanoparticles at high coverages.

10. The image depicts a Pd38 cubooctahedral nanclusters at various degrees of adsorbate saturation.
Dr Constantinos Zeinalipour-Yazdi, University College London Department of Chemistry
The study of dynamic processes in catalysis and materials chemistry using accurate quantum mechanical calculations is a computationally demanding process. The high performance computing resources offered by ARCHER through the Materials Chemistry Consortium are pivotal for the performance of such calculations. In this study we explore through hybrid-DFT molecular dynamics simulations the spatial and time evolution of adsorbates on the surface of nanoclusters. This research has resulted in fascinating simulations with respect to the dynamic motion of adsorbates on the surface of nanoparticles at high coverages.

11. The image depicts a Pd38 cubooctahedral nanoclusters at various degrees of adsorbate saturation.
Dr Constantinos Zeinalipour-Yazdi, University College London Department of Chemistry
The study of dynamic processes in catalysis and materials chemistry using accurate quantum mechanical calculations is a computationally demanding process. The high performance computing resources offered by ARCHER through the Materials Chemistry Consortium are pivotal for the performance of such calculations. In this study we explore through hybrid-DFT molecular dynamics simulations the spatial and time evolution of adsorbates on the surface of nanoclusters. This research has resulted in fascinating simulations with respect to the dynamic motion of adsorbates on the surface of nanoparticles at high coverages.

12. The image depicts a Pd38 cubooctahedral nanoclusters at various degrees of adsorbate saturation.
Dr Constantinos Zeinalipour-Yazdi, University College London Department of Chemistry
The study of dynamic processes in catalysis and materials chemistry using accurate quantum mechanical calculations is a computationally demanding process. The high performance computing resources offered by ARCHER through the Materials Chemistry Consortium are pivotal for the performance of such calculations. In this study we explore through hybrid-DFT molecular dynamics simulations the spatial and time evolution of adsorbates on the surface of nanoclusters. This research has resulted in fascinating simulations with respect to the dynamic motion of adsorbates on the surface of nanoparticles at high coverages.

13. Turbulent Jet-Flow.
Mr Patrick Bechlars, University of Southampton / Aerodynamics and Flight Mechanics Group
A turbulent pipe-flow is shown exiting into a co-flow and developing a turbulent jet. Turbulent structures, visualised as iso-surfaces of a vortex identification criterion, are coloured with the stream-wise velocity. The windows show magnifications of different regions in the flow. The turbulent jet is a canonical flow mimicking effects found in engineering applications such as, e.g., propulsion jets of aircraft engines. The flow data were produced by direct numerical simulation of the compressible Navier-Stokes equations using the UK national high performance computing facility ARCHER. These data provide insight into the fundamental dynamics of turbulent flows and to jet-noise reducing techniques. Turbulence describes the chaotic behaviour a flow can develop and is one of the most important unsolved problems of classical physics. Simulated data of turbulent flows, acquired on ARCHER, are a backbone of a better understanding of the chaos in flows.

14. Enhanced mixing of neutral buoyant plume in dynamic environments of tidally induced internal waves bouncing between steep side walls of deep narrow rift valley
Dmitry Aleynik, Physics Dept. Scottish Association for Marine Science (SAMS)
Enhanced mixing of neutral buoyant plume in dynamic environments of tidally induced internal waves (IW) bouncing between steep side walls of deep narrow rift valley. (a) 3D snapshot of rising plume dispersal from Rainbow hydrothermal vent field at Mid Atlantic Ridge (36°14'N), bathymetry is shown every 50 m. (b) Horizontal distribution of the non-hydrostatic pressure (dbar) at a water depth of 2200m assists to visualize IW upstream propagation as ripples, reflected from topography. (c) Vertical section of east/west baroclinic currents across the rift valley, tidal (vertically averaged) component was subtracted from full velocity profile (m/s). Overlapping white lines shows vertical displacement of isotherms (°C), associated with IW; yellow isolines indicate spread of a passive tracer emanating from 'black smokers'. At ARCHER the MITgcm numerical simulation of the largest documented natural plume in deep Atlantic provide a proxy to assess environmental impacts of expected human activity (EC-FP7 MIDAS at SAMS).

15. Enhanced mixing of neutral buoyant plume in dynamic environments of tidally induced internal waves bouncing between steep side walls of deep narrow rift valley.
Dmitry Aleynik, Physics Dept. Scottish Association for Marine Science (SAMS)
Enhanced mixing of neutral buoyant plume in dynamic environments of tidally induced internal waves (IW) bouncing between steep side walls of deep narrow rift valley. (a) 3D snapshot of rising plume dispersal from Rainbow hydrothermal vent field at Mid Atlantic Ridge (36°14'N), bathymetry is shown every 50 m. (b) Horizontal distribution of the non-hydrostatic pressure (dbar) at a water depth of 2200m assists to visualize IW upstream propagation as ripples, reflected from topography. (c) Vertical section of east/west baroclinic currents across the rift valley, tidal (vertically averaged) component was subtracted from full velocity profile (m/s). Overlapping white lines shows vertical displacement of isotherms (°C), associated with IW; yellow isolines indicate spread of a passive tracer emanating from 'black smokers'. At ARCHER the MITgcm numerical simulation of the largest documented natural plume in deep Atlantic provide a proxy to assess environmental impacts of expected human activity (EC-FP7 MIDAS at SAMS).

16. Enhanced mixing of neutral buoyant plume in dynamic environments of tidally induced internal waves bouncing between steep side walls of deep narrow rift valley.
Dmitry Aleynik, Physics Dept. Scottish Association for Marine Science (SAMS)
Enhanced mixing of neutral buoyant plume in dynamic environments of tidally induced internal waves (IW) bouncing between steep side walls of deep narrow rift valley. (a) 3D snapshot of rising plume dispersal from Rainbow hydrothermal vent field at Mid Atlantic Ridge (36°14'N), bathymetry is shown every 50 m. (b) Horizontal distribution of the non-hydrostatic pressure (dbar) at a water depth of 2200m assists to visualize IW upstream propagation as ripples, reflected from topography. (c) Vertical section of east/west baroclinic currents across the rift valley, tidal (vertically averaged) component was subtracted from full velocity profile (m/s). Overlapping white lines shows vertical displacement of isotherms (°C), associated with IW; yellow isolines indicate spread of a passive tracer emanating from 'black smokers'. At ARCHER the MITgcm numerical simulation of the largest documented natural plume in deep Atlantic provide a proxy to assess environmental impacts of expected human activity (EC-FP7 MIDAS at SAMS).

17. Dynamically fully self-consistent, 3-D numerical model of global mantle convection and single-sided subduction on Earth. Visible are cold, stiff surface plates (grey) sinking into the mantle and upwelling plumes of hot material (red) from the core-mantle boundary.
Dr Fabio Crameri, University College London, Department of Earth Sciences
The image shows a snapshot of our time-dependent, three-dimensional and fully spherical model of the Earth's mantle. It reproduces the thermal convection inside our planet's mantle that includes plate tectonics at the surface. It can self-consistently produce the nature-like single-sided sinking of the colliding plates (Crameri et al., 2012, GRL). The model is calculated on ARCHER with the finite-volume, multigrid code StagYY (Tackley 2008, PEPI), features a so-called 'sticky-air' layer to approximate a free surface, and is currently applied to study the interaction between mantle flow and surface topography at colliding plate boundaries (i.e., subduction zones), which are the regions of the largest earthquakes and the most active volcanoes on our planet. These modelling studies thereby allow us to understand the dynamic evolution of the Earth and why it happened so fundamentally different to all other rocky planets of our solar system.

18. Molecular Dynamics simulation of TiO2 nanoparticle sintering process in flame-synthesized nanoaerosol system.
Qian Mao, Center for Combustion Energy and Department of Thermal Engineering, Tsinghua University
TiO2 nanoparticle is widely used as semiconductor, dye-sensitized solar cell, catalyst support and so on. Flame synthesis is an effective way to produce pure anatase nanoparticles with diameter below 10nm. During the synthesis process, particles experience nucleation, surface growth, collision and sintering. Among them, sintering is an important stage to determine the final structure and size. Here, we use Lammps software to carry out molecule dynamics simulation to study the dynamic sintering process after off-center collision and unequal-sized sintering. Two interesting phenomenon have been found. One is phase transformation from anatase to rutile in the sintering after the off-center collision, the other is packaging meaning atoms from an amorphous smaller particle spread uniformly on the surface layer of the bigger particle. This image shows this dynamic process. The simulations were partly performed on ARCHER funded under the EPSRC project "UK Consortium on Mesoscale Engineering Sciences (UKCOMES)" (Grant No. EP/L00030X/1).

19. Study of interacting cracks in polycrystalline iron
Dr Anton Shterenlikht, Mechanical Engineering Dept, University of Bristol
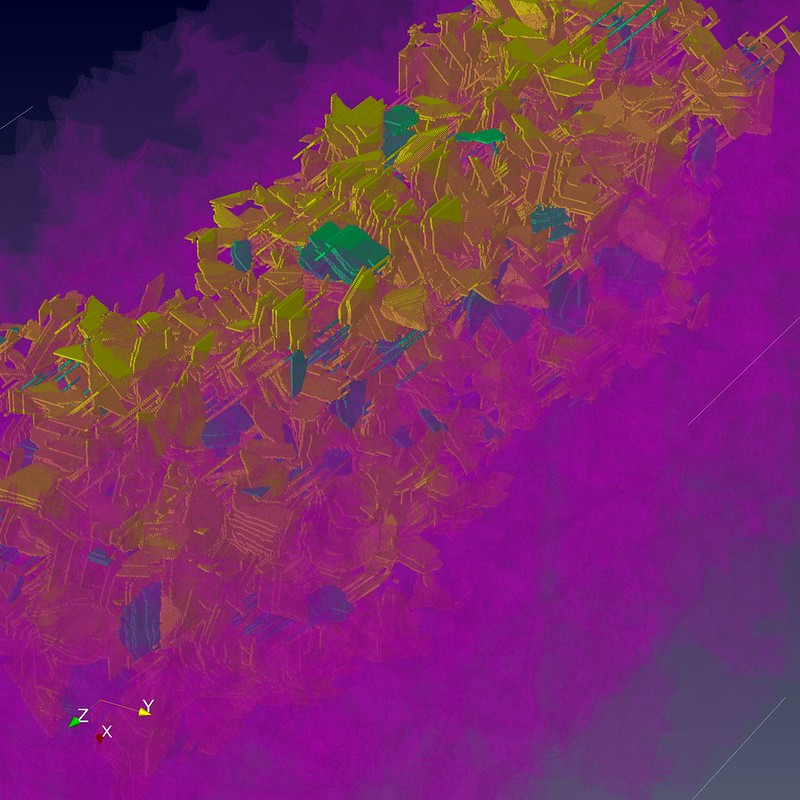
The images show three alternative views of the same 10 cubic mm volume of iron with 10,000 uniquely shaped crystals.
To capture fine details of the shape of each crystal, they are built, on average, from 100,000 tiny cubic cells. The complete, 1 billion cell computer model, requires very large memory for the calculation and the visualisation, which is why we used Archer.
In the images the crystal boundaries are shown in purple. The cracks on {100} crystallographic planes are shown in yellow, and those on {110} planes are in green. {100} planes are easier to cleave, so there are more yellow cracks than green.
Cracks in individual crystals form a large crack system, spanning across multiple crystal boundaries. A view of cracks through semi-transparent network of crystal boundaries enables a detailed analysis of the influence of crystal boundary orientation on fracture energy, the ultimate aim of this work.

20. Study of interacting cracks in polycrystalline iron.
Dr Anton Shterenlikht, Mechanical Engineering Dept, University of Bristol
The images show three alternative views of the same 10 cubic mm volume of iron with 10,000 uniquely shaped crystals.
To capture fine details of the shape of each crystal, they are built, on average, from 100,000 tiny cubic cells. The complete, 1 billion cell computer model, requires very large memory for the calculation and the visualisation, which is why we used Archer.
In the images the crystal boundaries are shown in purple. The cracks on {100} crystallographic planes are shown in yellow, and those on {110} planes are in green. {100} planes are easier to cleave, so there are more yellow cracks than green.
Cracks in individual crystals form a large crack system, spanning across multiple crystal boundaries. A view of cracks through semi-transparent network of crystal boundaries enables a detailed analysis of the influence of crystal boundary orientation on fracture energy, the ultimate aim of this work.
21. Study of interacting cracks in polycrystalline iron
Dr Anton Shterenlikht, Mechanical Engineering Dept, University of Bristol
The images show three alternative views of the same 10 cubic mm volume of iron with 10,000 uniquely shaped crystals.
To capture fine details of the shape of each crystal, they are built, on average, from 100,000 tiny cubic cells. The complete, 1 billion cell computer model, requires very large memory for the calculation and the visualisation, which is why we used Archer.
In the images the crystal boundaries are shown in purple. The cracks on {100} crystallographic planes are shown in yellow, and those on {110} planes are in green. {100} planes are easier to cleave, so there are more yellow cracks than green.
Cracks in individual crystals form a large crack system, spanning across multiple crystal boundaries. A view of cracks through semi-transparent network of crystal boundaries enables a detailed analysis of the influence of crystal boundary orientation on fracture energy, the ultimate aim of this work.
22. Particle trajectories in a high resolution simulation of the Southern Ocean
Dr Andrew Coward, National Oceanography Centre/ Marine System Modelling
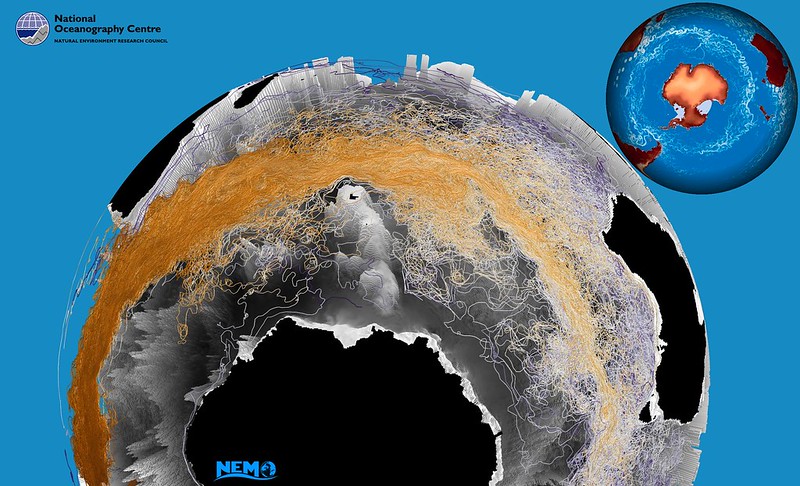
The Natural Environment Research Council maintains a high resolution global ocean modelling capability on the ARCHER service. Results from these simulations are used in a wide variety of scientific applications and national and international collaborations. Here we show a selection of trajectories for simulated particles released into the model's Southern Ocean. This work was part of a study into the feasibility of sequesting and storing carbon dioxide in the deep ocean and uses a technique capable of tracking hundreds of thousands of particles over century long timescales. Each trajectory is coloured with the time since release and is displayed over a 3D representation of the model bathymetry (in grayscale). The smaller, inset, image shows an example of the instantaneous surface current speed which illustrates the typical currents in the region.

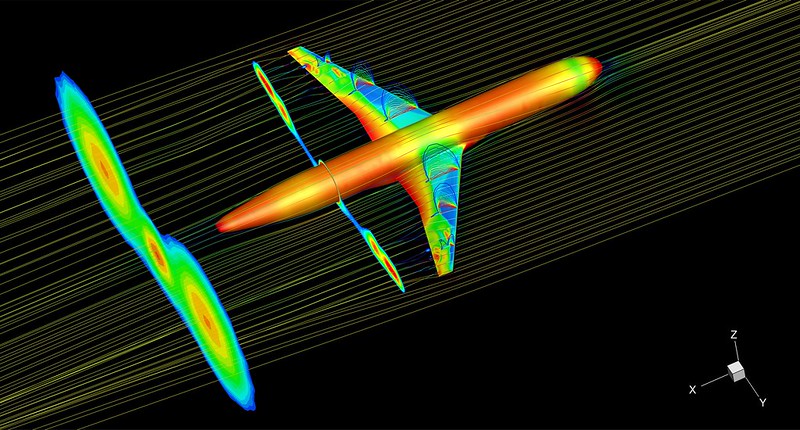
23. Transonic shock buffet on large transport aircraft
Dr Fulvio Sartor, University of Liverpool School of Engineering
Transonic flow field around a wing-body configuration representative of a large transport aircraft at flight conditions. The image is a snapshot of an unsteady computational fluid dynamics simulation run on ARCHER.
The aircraft surface is coloured by the air pressure. The slices indicate the velocity field in the supersonic zone of the flow. On the left wing, vortical structures represent the large-scale turbulent air generated by the separated flow due to the shock wave interacting with the boundary layer.
Streamlines coloured by the velocity magnitude give an idea of the flow direction around the aircraft.

24. Transonic shock buffet on large transport aircraft.
Dr Fulvio Sartor, University of Liverpool School of Engineering
Transonic flow field around a wing-body configuration representative of a large transport aircraft at flight conditions. The image is a snapshot of an unsteady computational fluid dynamics simulation run on ARCHER.
The aircraft surface is coloured by the air pressure. The slices on the wings indicate the velocity field in the supersonic zone of the flow. Streamlines coloured by the velocity magnitude give an idea of the flow direction around the aircraft.
25. Transonic shock buffet on large transport aircraft
Dr Fulvio Sartor, University of Liverpool School of Engineering
Transonic flow field around a wing-body configuration representative of a large transport aircraft at flight conditions. The image is a snapshot of an unsteady computational fluid dynamics simulation run on ARCHER.
The aircraft surface is coloured by the air pressure. The slices on the wings indicate the velocity field in the supersonic zone of the flow. The slices in the wake represent the turbulent air generated by the separated flow due to the shock wave interacting with the boundary layer. Streamlines coloured by the velocity magnitude give an idea of the flow direction around the aircraft.

26. Streamlines illustrating the temperature distribution and spontaneous emergence of counter-rotating vortices within the flow of an irregular 3D liquid droplet undergoing phase change.
Dr Pedro J. Sáenz, University of Edinburgh Institute for Materials and Processes
This image illustrates the flow and temperature distribution within an evaporating liquid droplet with irregular contact area. For the first time, deformed drops have been simulated in three-dimensions, investigation which has elucidated the spontaneous emergence of previously-unknown vortices playing an essential role on the drop's flow and heat transfer mechanism. Understanding the dynamics of an evaporating droplet is a fundamental problem with a broad range of application, such as the development of new techniques for early diagnosis of several life-threatening diseases based on the pattern formation from drying drops of blood. The data depicted in the figure is the result of seven coupled nonlinear equations simultaneously solved at more than 8 million points, herculean task which would have required years to complete without ARCHER.

27. Streamlines illustrating the temperature distribution and emergence of azimuthal currents within the flow of an irregular 3D liquid droplet undergoing phase change
* * * COMPETITION WINNING ENTRY * * *
Dr Pedro J. Sáenz, University of Edinburgh Institute for Materials and Processes
This image illustrates the flow and temperature distribution within an evaporating liquid droplet with elliptical contact area. For the first time, deformed drops have been simulated in three-dimensions, investigation which has elucidated the spontaneous emergence of previously-unknown azimuthal currents playing an essential role on the drop's flow and heat transfer mechanism. Understanding the dynamics of an evaporating droplet is a fundamental problem with a broad range of application, such as the development of new techniques for early diagnosis of several life-threatening diseases based on the pattern formation from drying drops of blood. The data depicted in the figure is the result of seven coupled nonlinear equations simultaneously solved at more than 8 million points, herculean task which would have required years to complete without ARCHER.
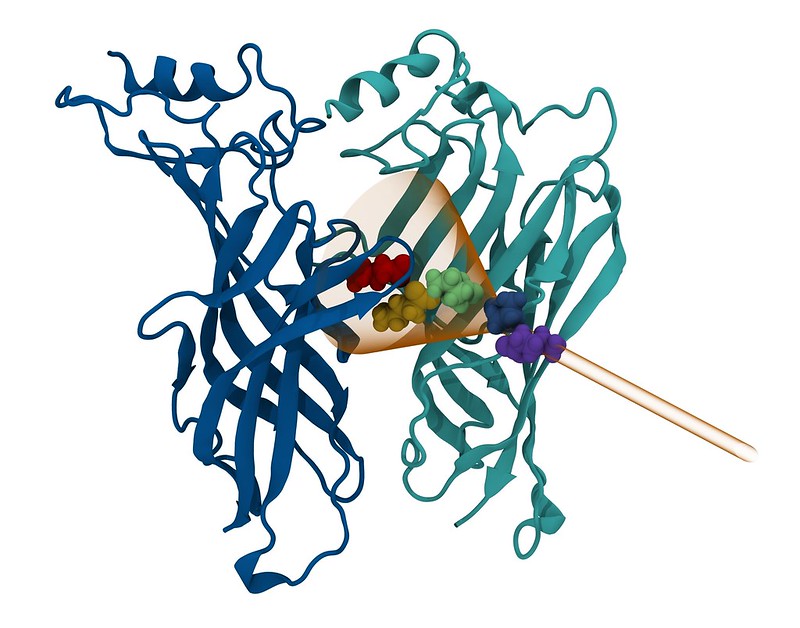
28. Exploring the Activation Mechanisms of an Insect Neuroreceptor
Mr Federico Comitani, King's College London, Department of Physics
Pentameric ligand-gated ion channels (pLGICs) are important neuroreceptors that mediate the fast communication between neurons by allowing ions to pass across the cell membrane in response to the binding of a small molecule, the neurotransmitter. Their malfunction is linked to serious neuronal disorders such as Alzheimer's disease and they are major drug target; in insects they are involved in insecticide resistance. Using a novel computational technique for accelerating rare events, "funnel metadynamics", we simulated binding and unbinding events of the neurotransmitter GABA to the fruit fly RDL receptor: the part of this system containing the binding site is shown in blue. The orange funnel represents a restraining potential that restricts the exploration of GABA in the solvent outside the protein, allowing for accurate estimations of the energy of binding. Sequential snapshots of GABA, coloured from red to violet, suggest a possible unbinding path. The image was generated with VMD v1.9.2.
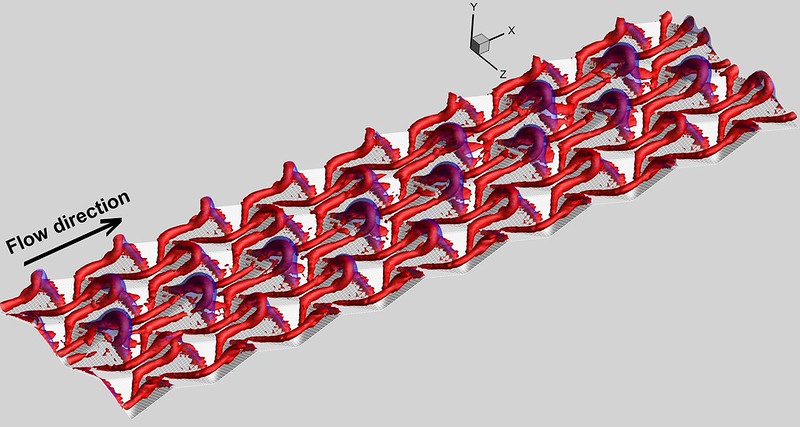
29. Primary hairpin vortex structure in a turbulent-to-turbulent transition of flow in a channel with a 3-D roughness.
Dr Mehdi Seddighi, University of Sheffield Department of Mechanical Engineering
Unsteady flows, in which the bulk velocity of a wall-bounded flow or the free-stream velocity of a boundary-layer flow vary with time, are encountered in many engineering applications. DNS has been used to investigate the transient behaviour of turbulence following a rapid flow acceleration from an initially turbulent flow in a channel with a smooth top wall and a roughened bottom wall made of close-packed pyramids. The image shows the shape of the head-up hairpin structures (in red colour) observed during the early transient stages which is similar to that of the primary hairpin structures observed for steady smooth wall flow, contrasting with the U-shape head-down vortices observed for steady fully-rough channel flows with similar pyramid roughness. The vortex is visualised using Q-criterion. The blue structures exhibit the iso-surface of the pressure.

30. Hydroxyl eprime 1
Mr Al-Moatasem El-Sayed, Department of Physics and Astronomy, University College London
Silicon dioxide is widely used for various technological applications. In particular, it is an integral component of the transistors that make up computer processors. Over the years, advances in engineering have reduced the size of transistors into the nano-scale which has exacerbated a number of transistor reliability issues. In addition, the average processor now typically undergoes more than 400 fabrication processes and is soaked in hydrogen after every fabrication step. Although silicon dioxide has been intensively studied for over five decades, its interaction with hydrogen still remains controversial, with the common perception being that hydrogen acts as a benign entity. Our state of the art calculations on the Archer supercomputer find that hydrogen can create defective sites in silicon dioxide, such as that depicted in the image. This interaction has implications for our transistor fabrication processes in addition to playing a role in some transistor device reliability issues.

31. Hydroxyl eprime 2
Mr Al-Moatasem El-Sayed, Department of Physics and Astronomy, University College London
Silicon dioxide is widely used for various technological applications. In particular, it is an integral component of the transistors that make up computer processors. Over the years, advances in engineering have reduced the size of transistors into the nano-scale which has exacerbated a number of transistor reliability issues. In addition, the average processor now typically undergoes more than 400 fabrication processes and is soaked in hydrogen after every fabrication step. Although silicon dioxide has been intensively studied for over five decades, its interaction with hydrogen still remains controversial, with the common perception being that hydrogen acts as a benign entity. Our state of the art calculations on the Archer supercomputer find that hydrogen can create defective sites in silicon dioxide, such as that depicted in the image. This interaction has implications for our transistor fabrication processes in addition to playing a role in some transistor device reliability issues.

32. Hydroxyl eprime 3
Mr Al-Moatasem El-Sayed, Department of Physics and Astronomy, University College London
Silicon dioxide is widely used for various technological applications. In particular, it is an integral component of the transistors that make up computer processors. Over the years, advances in engineering have reduced the size of transistors into the nano-scale which has exacerbated a number of transistor reliability issues. In addition, the average processor now typically undergoes more than 400 fabrication processes and is soaked in hydrogen after every fabrication step. Although silicon dioxide has been intensively studied for over five decades, its interaction with hydrogen still remains controversial, with the common perception being that hydrogen acts as a benign entity. Our state of the art calculations on the Archer supercomputer find that hydrogen can create defective sites in silicon dioxide, such as that depicted in the image. This interaction has implications for our transistor fabrication processes in addition to playing a role in some transistor device reliability issues.